Kenya Lithium compounds Market (2026-2032) Outlook | Value, Revenue, Growth, Size, Share, Industry, Forecast, Analysis, Companies & Trends
Market Forecast By Derivative (Hydrides, Fluorides, Chlorides, Bromides, Iodides, Oxides, Carbonates, Others), By Application (Rechargeable & Non-Rechargeable Batteries, Air Conditioning, Industrial Drying System, Glass & Ceramics, Metallurgy, Polymers, Others), By Industry Vertical (Aerospace and Defense, Automobile, Energy, Chemicals, Engineering Machinery, Pharmaceuticals, Others) And Competitive Landscape
| Product Code: ETC087969 | Publication Date: Jun 2021 | Updated Date: Jun 2026 | Product Type: Report | |
| Publisher: 6Wresearch | Author: Ravi Bhandari | No. of Pages: 70 | No. of Figures: 35 | No. of Tables: 5 |
Kenya Lithium compounds Market Size, Share & Growth Rate
The Kenya Lithium compounds Market was estimated at USD 229 Million in 2025 and is projected to reach USD 323 Million by 2032, growing at a CAGR of 5.0% from 2026 to 2032. This growth trajectory is being propelled by increasing demand for electric vehicle batteries and the rising adoption of renewable energy technologies, which heavily rely on lithium-based solutions. Moreover, the country's rich lithium resources position Kenya as a key player in the global lithium supply chain.
Kenya Lithium compounds Market Growth Rate Analysis (2021-2032)
The Kenya lithium compounds market has demonstrated stable growth, reflecting an average annual increase of around 6% from 2021 until 2032. With growth peaking at 6.2% in 2022, this upward trend can be attributed to rising consumer demand linked to the global energy transition, particularly in electric vehicle production and renewable energy storage solutions. Although there were slight fluctuations, notably a drop to 5.6% in 2024 and 2027, these were influenced by temporary supply chain disruptions and policy shifts. Looking ahead, the sector is poised for rejuvenation, supported by continued investments in mining infrastructure and advancements in sustainable extraction technologies, fostering a resilient market environment through 2032.
Kenya Lithium compounds Market Year-wise Growth Rate and Key Drivers
This graph highlights how the Kenya Lithium compounds Market has steadily grown over the past five years, supported by major growth factors.
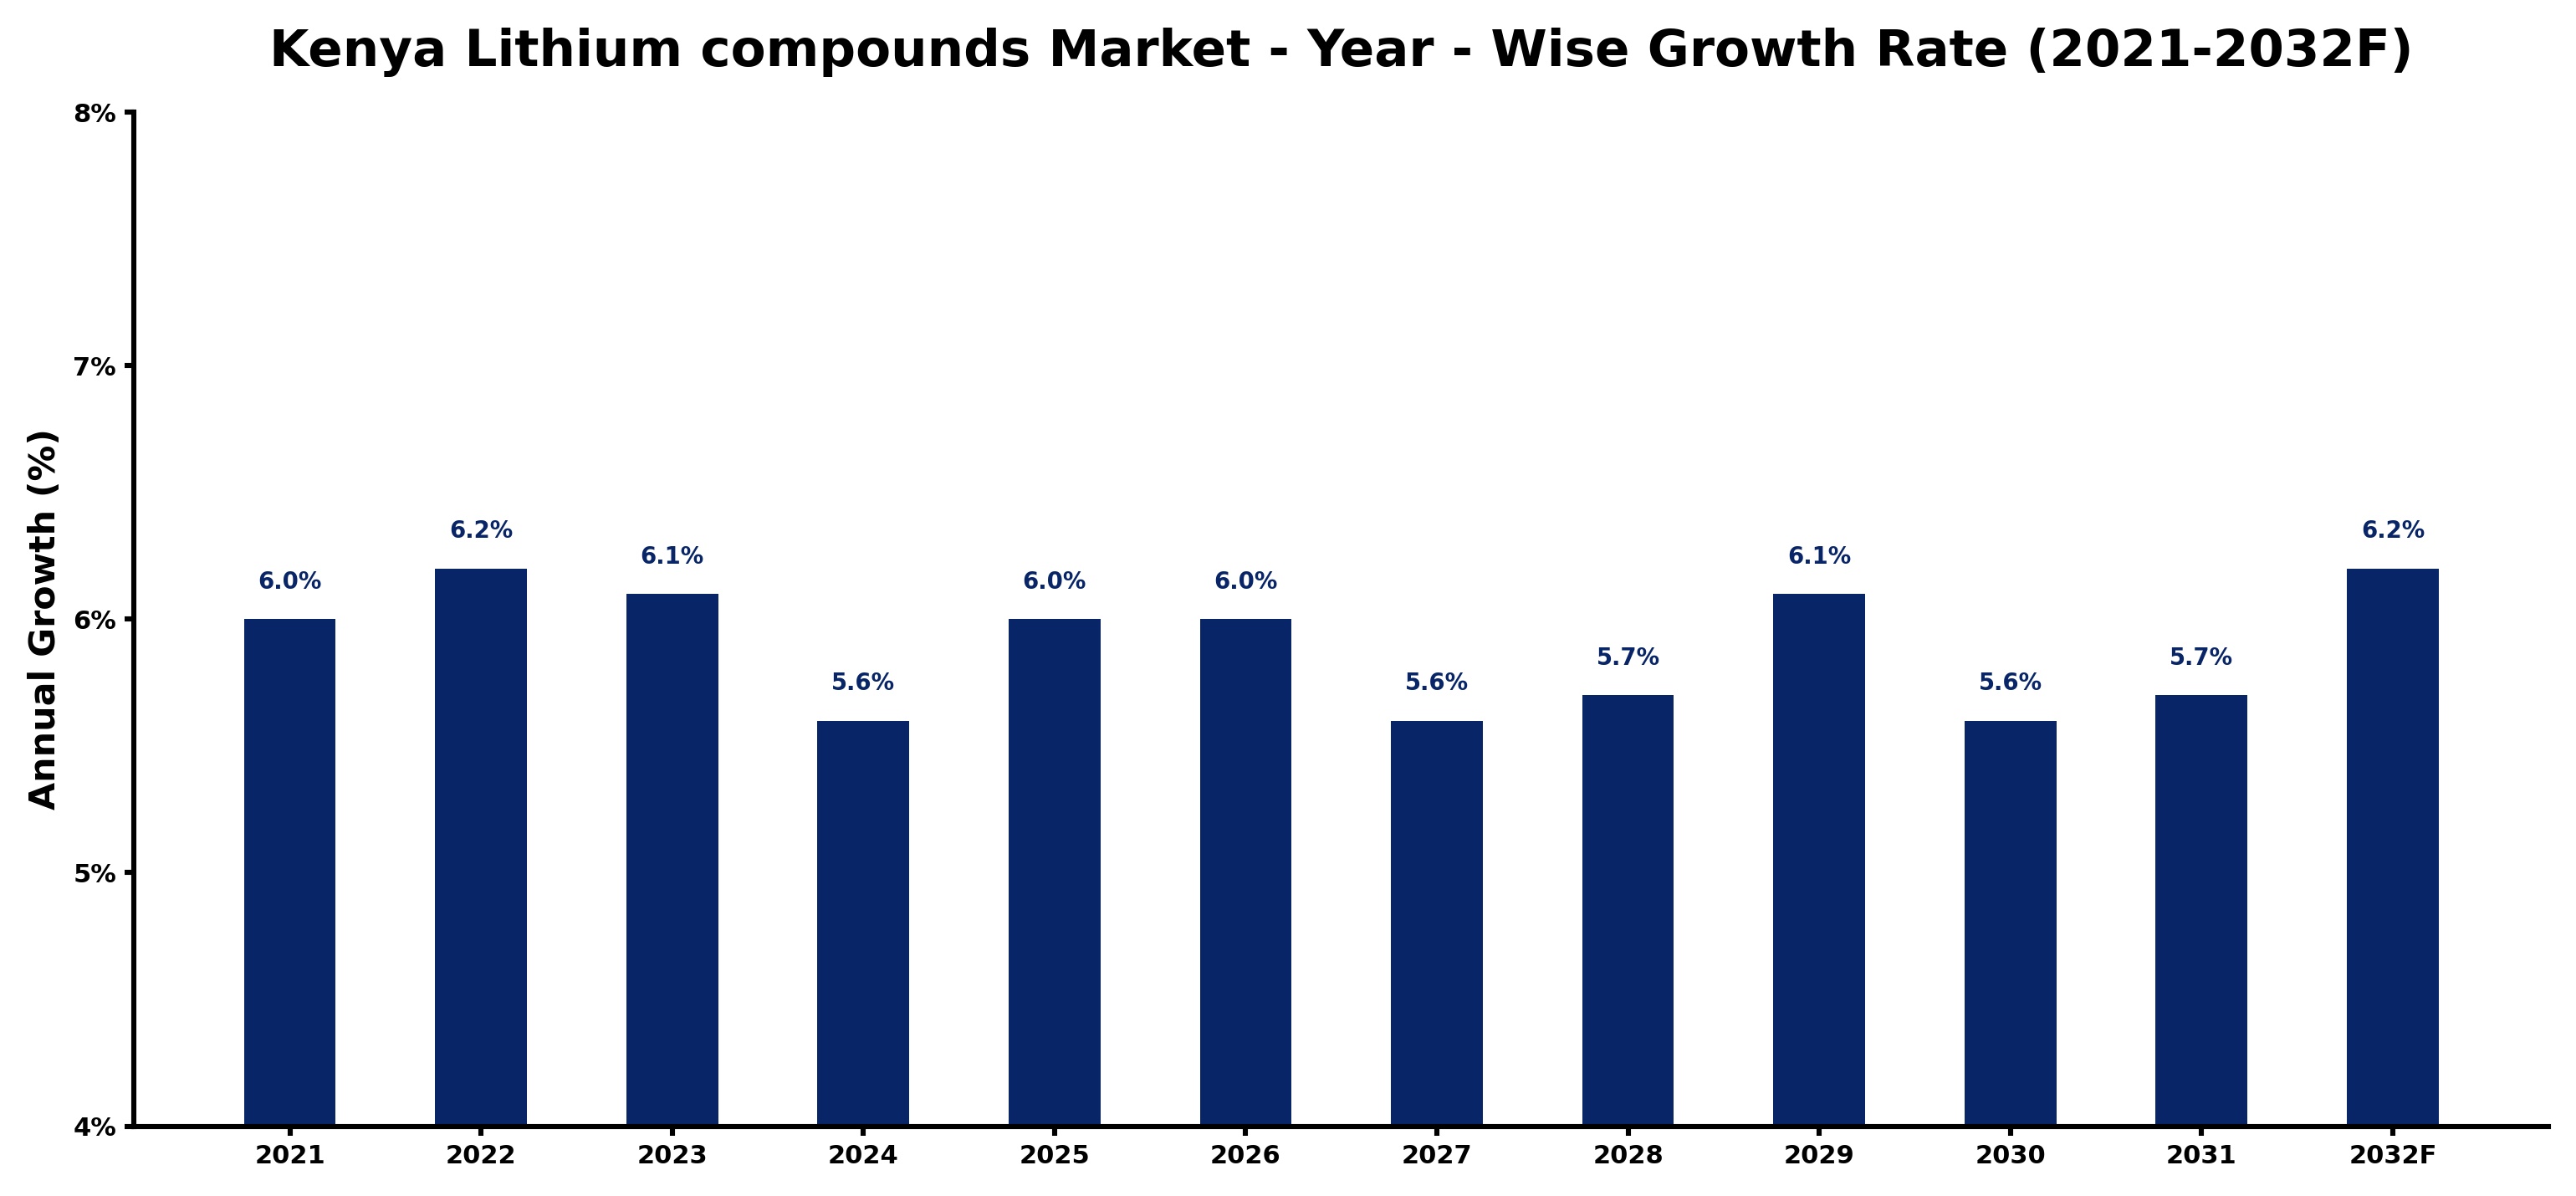
The table below presents the year‑wise growth rates along with the key drivers influencing the market
| Year | Growth Rate | Major Drivers |
| 2021 | 6.0% | Increasing industrial automation investments |
| 2022 | 6.2% | Expansion of transportation and logistics networks |
| 2023 | 6.1% | Rapid growth in telecom and data center sectors |
| 2024 | 5.6% | Expansion of manufacturing activities |
| 2025 | 6.0% | Expansion of commercial construction activities |
| 2026 | 6.0% | Increasing adoption of advanced technologies |
| 2027 | 5.6% | Expansion of transportation and logistics networks |
| 2028 | 5.7% | Government infrastructure modernization initiatives |
| 2029 | 6.1% | Expansion of commercial construction activities |
| 2030 | 5.6% | Expansion of manufacturing activities |
| 2031 | 5.7% | Increasing smart city development projects |
| 2032 | 6.2% | Increasing industrial automation investments |
Note - Market size estimations and growth projections presented in this report are based on 6Wresearch’s advanced forecasting approach, validated with industry datasets as of June 2026.
Kenya Lithium compounds Market Synopsis
Currently, the most influential factor shaping the Kenya Lithium compounds Market is the global push towards sustainability. With a growing emphasis on reducing carbon footprints, industries are increasingly turning to lithium for clean energy applications. This trend is bolstered by supportive government policies aimed at promoting local lithium extraction and processing.
Additionally, the rising investment in infrastructure to support mining activities is creating a conducive environment for growth. As international interest in lithium compounds escalates, Kenya's role in the market is becoming increasingly significant, attracting both foreign investments and technological partnerships.
Kenya Lithium compounds Market Key Takeaways
- Kenya's lithium market is set for steady growth, driven by global demand for cleaner energy solutions.
- The country's rich natural resources present significant opportunities for mining and processing industries.
- Government initiatives are aligning with private sector efforts to enhance the lithium supply chain.
- The electric vehicle sector's expansion is a key demand driver for lithium compounds in Kenya.
- Investment in infrastructure is crucial for facilitating the mining and export of lithium products.
Evaluation of Restraints in Kenya Lithium compounds Market
Despite the promising outlook for the Kenya Lithium compounds Market, several restraints could hinder its growth trajectory. One significant challenge is the potential environmental concerns associated with lithium mining, which could lead to public resistance and regulatory hurdles. Additionally, the lack of established mining infrastructure poses a risk to timely project execution and may deter investors. Fluctuations in global lithium prices and competition from other lithium-producing countries could also impact market stability.
Kenya Lithium compounds Market Trends
Current trends indicate a marked increase in research and development efforts focused on enhancing lithium extraction techniques. Innovations in sustainable mining practices are gaining traction, aimed at minimizing environmental impact while maximizing yield. Furthermore, there is a growing emphasis on local value addition, with stakeholders seeking to establish processing facilities within Kenya to capture a greater share of the supply chain.
Kenya Lithium compounds Market Opportunities
Opportunities for growth within the Kenya Lithium compounds Market are substantial. The global shift towards electric vehicles presents a lucrative avenue for expansion, as automakers increasingly seek reliable lithium sources. Additionally, as countries transition to renewable energy, the demand for energy storage solutions, particularly those incorporating lithium compounds, is set to surge. Capitalizing on these trends could lead to significant financial returns for early investors in the sector.
Government Initiatives in the Kenya Lithium compounds Market
The Kenyan government has implemented various initiatives to boost the lithium sector. Policies are being developed to support sustainable mining practices and streamline licensing processes for exploration and extraction. Additionally, public funding is directed towards enhancing infrastructure, ensuring that mining operations can proceed efficiently. The government is also engaging with international partners to promote technology transfer and skill development, which are vital for optimizing local production capabilities.
Future Insights of the Kenya Lithium compounds Market
Looking ahead to 2026-2032, the Kenya Lithium compounds Market is expected to thrive, driven by sustained global demand and domestic initiatives. As more industries adopt electric vehicles and renewable energy sources, the need for lithium compounds will continue to grow. Furthermore, advancements in mining technology and processes will likely improve efficiency, making Kenya a competitive player in the global market. Investments in local processing will also enhance value capture and stabilize market dynamics.
Kenya Lithium compounds Market Latest Developments (May 2025 - June 2026)
Recently, the industry has seen a strategic focus on building partnerships between local mining companies and international tech firms to leverage advanced extraction methods. Additionally, there has been an uptick in exploratory activities, with several new projects commencing in anticipation of increased demand. The government is also moving to solidify regulations aimed at promoting sustainable practices within the sector, ensuring both economic and environmental viability.
Kenya Lithium compounds Market - Key Attractiveness of the Report
- 10 Years of Market Numbers
- Historical Data Starting from 2022 to 2025
- Base Year: 2025
- Forecast Data until 2032
- Key Performance Indicators Impacting the Market
- Major Upcoming Developments and Projects
Key Highlights of the Report:
- Kenya Lithium compounds Market Outlook
- Market Size of Kenya Lithium compounds Market, 2025
- Forecast of Kenya Lithium compounds Market, 2032
- Historical Data and Forecast of Kenya Lithium compounds Revenues & Volume for the Period 2022-2032F
- Kenya Lithium compounds Market Trend Evolution
- Kenya Lithium compounds Market Drivers and Challenges
- Kenya Lithium compounds Price Trends
- Kenya Lithium compounds Porter's Five Forces
- Kenya Lithium compounds Industry Life Cycle
- Historical Data and Forecast of Kenya Lithium compounds Market Revenues & Volume By Derivative for the Period 2022-2032F
- Historical Data and Forecast of Kenya Lithium compounds Market Revenues & Volume By Hydrides for the Period 2022-2032F
- Historical Data and Forecast of Kenya Lithium compounds Market Revenues & Volume By Fluorides for the Period 2022-2032F
- Historical Data and Forecast of Kenya Lithium compounds Market Revenues & Volume By Chlorides for the Period 2022-2032F
- Historical Data and Forecast of Kenya Lithium compounds Market Revenues & Volume By Bromides for the Period 2022-2032F
- Historical Data and Forecast of Kenya Lithium compounds Market Revenues & Volume By Iodides for the Period 2022-2032F
- Historical Data and Forecast of Kenya Lithium compounds Market Revenues & Volume By Oxides for the Period 2022-2032F
- Historical Data and Forecast of Kenya Lithium compounds Market Revenues & Volume By Carbonates for the Period 2022-2032F
- Historical Data and Forecast of Kenya Hydrides Lithium compounds Market Revenues & Volume By Others for the Period 2022-2032F
- Historical Data and Forecast of Kenya Lithium compounds Market Revenues & Volume By Application for the Period 2022-2032F
- Historical Data and Forecast of Kenya Lithium compounds Market Revenues & Volume By Rechargeable & Non-Rechargeable Batteries for the Period 2022-2032F
- Historical Data and Forecast of Kenya Lithium compounds Market Revenues & Volume By Air Conditioning for the Period 2022-2032F
- Historical Data and Forecast of Kenya Lithium compounds Market Revenues & Volume By Industrial Drying System for the Period 2022-2032F
- Historical Data and Forecast of Kenya Lithium compounds Market Revenues & Volume By Glass & Ceramics for the Period 2022-2032F
- Historical Data and Forecast of Kenya Lithium compounds Market Revenues & Volume By Metallurgy for the Period 2022-2032F
- Historical Data and Forecast of Kenya Lithium compounds Market Revenues & Volume By Polymers for the Period 2022-2032F
- Historical Data and Forecast of Kenya Lithium compounds Market Revenues & Volume By Others for the Period 2022-2032F
- Historical Data and Forecast of Kenya Lithium compounds Market Revenues & Volume By Industry Vertical for the Period 2022-2032F
- Historical Data and Forecast of Kenya Lithium compounds Market Revenues & Volume By Aerospace and Defense for the Period 2022-2032F
- Historical Data and Forecast of Kenya Lithium compounds Market Revenues & Volume By Automobile for the Period 2022-2032F
- Historical Data and Forecast of Kenya Lithium compounds Market Revenues & Volume By Energy for the Period 2022-2032F
- Historical Data and Forecast of Kenya Lithium compounds Market Revenues & Volume By Chemicals for the Period 2022-2032F
- Historical Data and Forecast of Kenya Lithium compounds Market Revenues & Volume By Engineering Machinery for the Period 2022-2032F
- Historical Data and Forecast of Kenya Lithium compounds Market Revenues & Volume By Pharmaceuticals for the Period 2022-2032F
- Historical Data and Forecast of Kenya Lithium compounds Market Revenues & Volume By Others for the Period 2022-2032F
- Kenya Lithium compounds Import Export Trade Statistics
- Market Opportunity Assessment By Derivative
- Market Opportunity Assessment By Application
- Market Opportunity Assessment By Industry Vertical
- Kenya Lithium compounds Top Companies Market Share
- Kenya Lithium compounds Competitive Benchmarking By Technical and Operational Parameters
- Kenya Lithium compounds Company Profiles
- Kenya Lithium compounds Key Strategic Recommendations
Kenya Lithium compounds Market - Frequently Asked Questions
The Kenya Lithium compounds Market is projected to reach USD 323 Million by 2032, following a growth trajectory that starts at USD 229 Million in 2025 and reflects a CAGR of 5.0% from 2026 to 2032.
Environmental concerns are becoming a significant issue, with potential resistance from communities and stricter regulatory oversight impacting project timelines and investor confidence.
The Kenyan government is actively promoting the lithium sector through supportive policies, funding for infrastructure, and initiatives aimed at enhancing sustainable mining practices.
The electric vehicle and renewable energy sectors are the main drivers of lithium demand, as these industries increasingly rely on lithium for battery production and energy storage solutions.
Efforts are underway to establish processing facilities within Kenya, which will not only enhance local job creation but also enable the country to capture more value from its lithium resources.
6Wresearch actively monitors the Kenya Lithium compounds Market and publishes its comprehensive annual report, highlighting emerging trends, growth drivers, revenue analysis, and forecast outlook. Our insights help businesses to make data-backed strategic decisions with ongoing market dynamics. Our analysts track relevent industries related to the Kenya Lithium compounds Market, allowing our clients with actionable intelligence and reliable forecasts tailored to emerging regional needs.
Yes, we provide customisation as per your requirements. To learn more, feel free to contact us on sales@6wresearch.com
1 Executive Summary |
2 Introduction |
2.1 Key Highlights of the Report |
2.2 Report Description |
2.3 Market Scope & Segmentation |
2.4 Research Methodology |
2.5 Assumptions |
3 Kenya Lithium compounds Market Overview |
3.1 Kenya Country Macro Economic Indicators |
3.2 Kenya Lithium compounds Market Revenues & Volume, 2022 & 2032F |
3.3 Kenya Lithium compounds Market - Industry Life Cycle |
3.4 Kenya Lithium compounds Market - Porter's Five Forces |
3.5 Kenya Lithium compounds Market Revenues & Volume Share, By Derivative, 2022 & 2032F |
3.6 Kenya Lithium compounds Market Revenues & Volume Share, By Form, 2022 & 2032F |
3.7 Kenya Lithium compounds Market Revenues & Volume Share, By Industry Vertical, 2022 & 2032F |
4 Kenya Lithium compounds Market Dynamics |
4.1 Impact Analysis |
4.2 Market Drivers |
4.3 Market Restraints |
5 Kenya Lithium compounds Market Trends |
6 Kenya Lithium compounds Market, By Types |
6.1 Kenya Lithium compounds Market, By Derivative |
6.1.1 Overview and Analysis |
6.1.2 Kenya Lithium compounds Market Revenues & Volume, By Derivative, 2022-2032F |
6.1.3 Kenya Lithium compounds Market Revenues & Volume, By Hydrides, 2022-2032F |
6.1.4 Kenya Lithium compounds Market Revenues & Volume, By Fluorides, 2022-2032F |
6.1.5 Kenya Lithium compounds Market Revenues & Volume, By Chlorides, 2022-2032F |
6.1.6 Kenya Lithium compounds Market Revenues & Volume, By Bromides, 2022-2032F |
6.1.7 Kenya Lithium compounds Market Revenues & Volume, By Iodides, 2022-2032F |
6.1.8 Kenya Lithium compounds Market Revenues & Volume, By Oxides, 2022-2032F |
6.1.9 Kenya Lithium compounds Market Revenues & Volume, By Others, 2022-2032F |
6.1.10 Kenya Lithium compounds Market Revenues & Volume, By Others, 2022-2032F |
6.2 Kenya Lithium compounds Market, By Application |
6.2.1 Overview and Analysis |
6.2.2 Kenya Lithium compounds Market Revenues & Volume, By Rechargeable & Non-Rechargeable Batteries, 2022-2032F |
6.2.3 Kenya Lithium compounds Market Revenues & Volume, By Air Conditioning, 2022-2032F |
6.2.4 Kenya Lithium compounds Market Revenues & Volume, By Industrial Drying System, 2022-2032F |
6.2.5 Kenya Lithium compounds Market Revenues & Volume, By Glass & Ceramics, 2022-2032F |
6.2.6 Kenya Lithium compounds Market Revenues & Volume, By Metallurgy, 2022-2032F |
6.2.7 Kenya Lithium compounds Market Revenues & Volume, By Polymers, 2022-2032F |
6.3 Kenya Lithium compounds Market, By Industry Vertical |
6.3.1 Overview and Analysis |
6.3.2 Kenya Lithium compounds Market Revenues & Volume, By Aerospace and Defense, 2022-2032F |
6.3.3 Kenya Lithium compounds Market Revenues & Volume, By Automobile, 2022-2032F |
6.3.4 Kenya Lithium compounds Market Revenues & Volume, By Energy, 2022-2032F |
6.3.5 Kenya Lithium compounds Market Revenues & Volume, By Chemicals, 2022-2032F |
6.3.6 Kenya Lithium compounds Market Revenues & Volume, By Engineering Machinery, 2022-2032F |
6.3.7 Kenya Lithium compounds Market Revenues & Volume, By Pharmaceuticals, 2022-2032F |
7 Kenya Lithium compounds Market Import-Export Trade Statistics |
7.1 Kenya Lithium compounds Market Export to Major Countries |
7.2 Kenya Lithium compounds Market Imports from Major Countries |
8 Kenya Lithium compounds Market Key Performance Indicators |
9 Kenya Lithium compounds Market - Opportunity Assessment |
9.1 Kenya Lithium compounds Market Opportunity Assessment, By Derivative, 2022 & 2032F |
9.2 Kenya Lithium compounds Market Opportunity Assessment, By Application, 2022 & 2032F |
9.3 Kenya Lithium compounds Market Opportunity Assessment, By Industry Vertical, 2022 & 2032F |
10 Kenya Lithium compounds Market - Competitive Landscape |
10.1 Kenya Lithium compounds Market Revenue Share, By Companies, 2025 |
10.2 Kenya Lithium compounds Market Competitive Benchmarking, By Operating and Technical Parameters |
11 Company Profiles |
12 Recommendations |
13 Disclaimer |
Global Go To Market Strategy - 2030
Export potential enables firms to identify high-growth global markets with greater confidence by combining advanced trade intelligence with a structured quantitative methodology. The framework analyzes emerging demand trends and country-level import patterns while integrating macroeconomic and trade datasets such as GDP and population forecasts, bilateral import–export flows, tariff structures, elasticity differentials between developed and developing economies, geographic distance, and import demand projections. Using weighted trade values from 2020–2024 as the base period to project country-to-country export potential for 2030, these inputs are operationalized through calculated drivers such as gravity model parameters, tariff impact factors, and projected GDP per-capita growth. Through an analysis of hidden potentials, demand hotspots, and market conditions that are most favorable to success, this method enables firms to focus on target countries, maximize returns, and global expansion with data, backed by accuracy.
By factoring in the projected importer demand gap that is currently unmet and could be potential opportunity, it identifies the potential for the Exporter (Country) among 190 countries, against the general trade analysis, which identifies the biggest importer or exporter.
To discover high-growth global markets and optimize your business strategy:
Click Here
Pricing
- Single User License$ 1,995
- Department License$ 2,400
- Site License$ 3,120
- Global License$ 3,795

Leadership Perspectives from Industry Events
Search
Thought Leadership and Analyst Meet


Our Clients
6WResearch In News
- India Air Conditioner Market Set for Strong Rebound in 2026 After Weather-Led Correction and GST-Driven Recovery: 6Wresearch
- ADAS in India: How Automatic Emergency Braking, Blind Spot Detection & Driver Monitoring are Transforming Road Safety
- Doha a strategic location for EV manufacturing hub: IPA Qatar
- Demand for luxury TVs surging in the GCC, says Samsung
- Empowering Growth: The Thriving Journey of Bangladesh’s Cable Industry
- Demand for luxury TVs surging in the GCC, says Samsung
Latest Reports
- Nicaragua RPG Gaming Market (2026-2032)
- New Zealand RPG Gaming Market (2026-2032)
- Netherlands RPG Gaming Market (2026-2032)
- Nauru RPG Gaming Market (2026-2032)
- Namibia RPG Gaming Market (2026-2032)
- Mozambique RPG Gaming Market (2026-2032)
- Montenegro RPG Gaming Market (2026-2032)
- Mongolia RPG Gaming Market (2026-2032)
- Monaco RPG Gaming Market (2026-2032)
- Micronesia RPG Gaming Market (2026-2032)
Industry Events and Analyst Meet

HIMTEX 2026

India Refining Summit 2026

India EV Show 2026

EV tech India Expo 2026

Auto Tech Asia 2026
Whitepaper
- Middle East & Africa Commercial Security Market Click here to view more.
- Middle East & Africa Fire Safety Systems & Equipment Market Click here to view more.
- GCC Drone Market Click here to view more.
- Middle East Lighting Fixture Market Click here to view more.
- GCC Physical & Perimeter Security Market Click here to view more.