Kenya Low Fat Dairy Products Market (2026-2032) Outlook | Industry, Analysis, Forecast, Growth, Value, Companies, Revenue, Share, Trends, Size
Market Forecast By Nature (Organic, Conventional), By Type (Low Fat Butter, Low Fat Cheese, Low Fat Yoghurt, Low Fat Ice Cream, Reduced Fat Margarine, Fat Free Condensed Milk, Skimmed Milk, Others), By Distribution Channel (Supermarkets and Hypermarkets, Convenience Stores, Dairy Stores, Online, Others) And Competitive Landscape
| Product Code: ETC188282 | Publication Date: May 2022 | Updated Date: Jun 2026 | Product Type: Market Research Report | |
| Publisher: 6Wresearch | Author: Ravi Bhandari | No. of Pages: 60 | No. of Figures: 40 | No. of Tables: 7 |
Kenya Low Fat Dairy Products Market Size, Share & Growth Rate
The Kenya Low Fat Dairy Products Market was estimated at USD 1495 Million in 2025 and is projected to reach USD 2721 Million by 2032, growing at a CAGR of 8.9% from 2026 to 2032. This growth trajectory is significantly influenced by rising health consciousness among consumers who are increasingly inclined towards low-fat alternatives. Additionally, urbanization and the adoption of Western dietary habits further amplify the demand for nutritious yet convenient dairy options.
Kenya Low Fat Dairy Products Market Year-wise Growth Rate and Key Drivers
This graph highlights how the Kenya Low Fat Dairy Products Market has steadily grown over the years, supported by major growth factors.
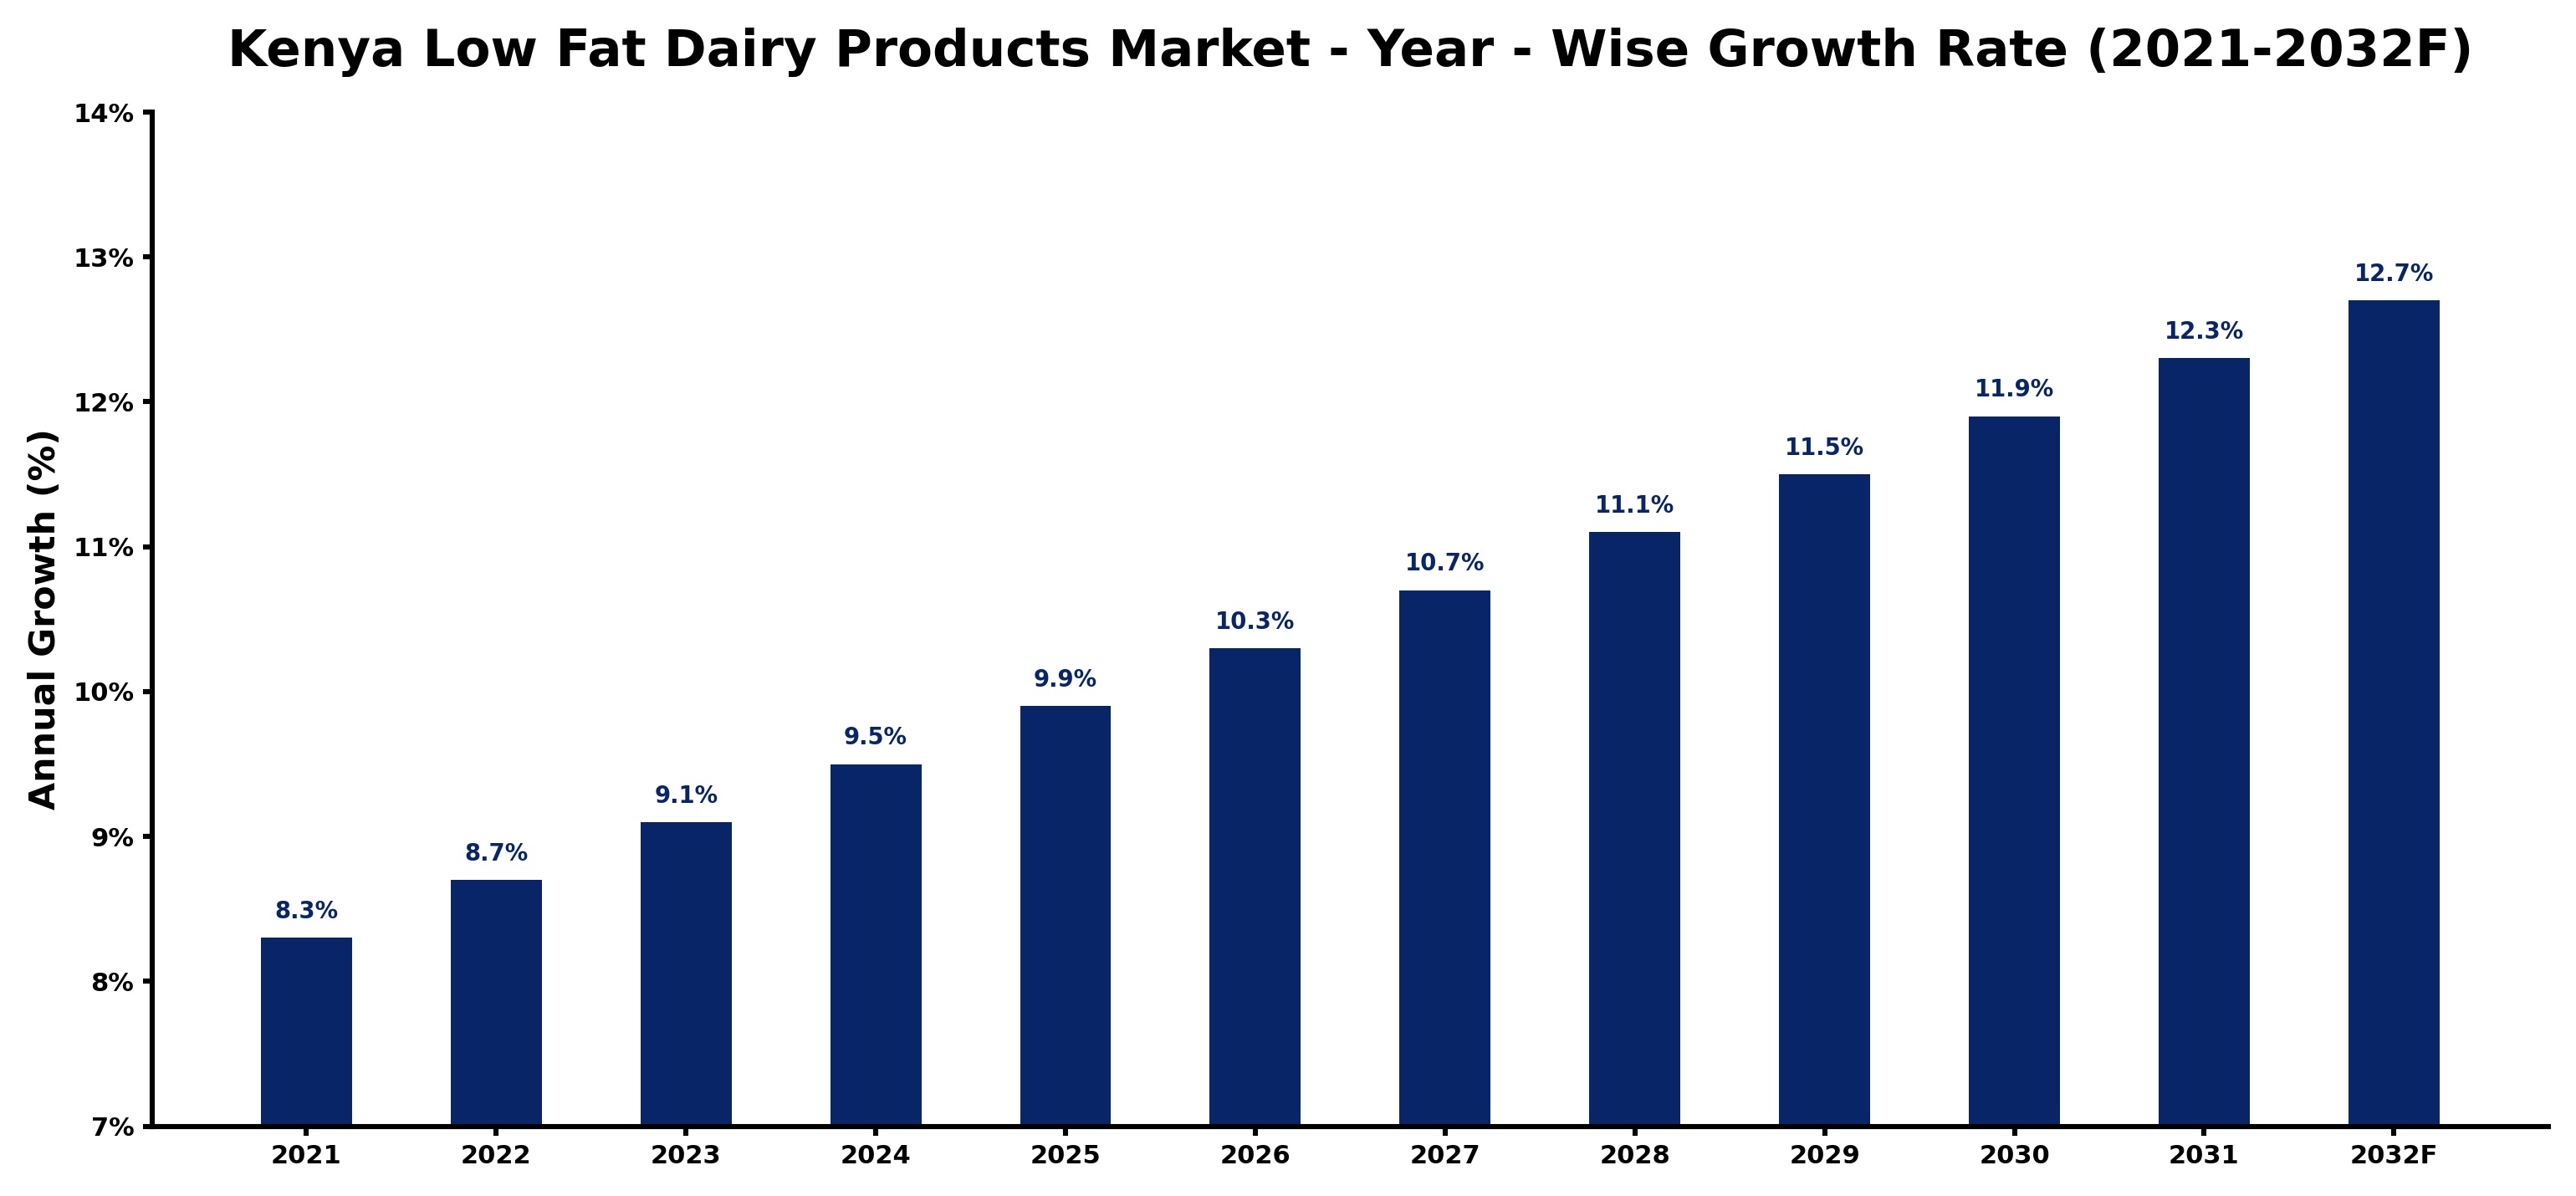
The table below presents the year‑wise growth rates along with the key drivers influencing the market
| Year | Growth Rate | Major Drivers |
| 2021 | 8.3% | Health consciousness among consumers |
| 2022 | 8.7% | Increased demand for low fat |
| 2023 | 9.1% | Rising awareness of nutrition |
| 2024 | 9.5% | Dairy alternatives gaining popularity |
| 2025 | 9.9% | Innovative product offerings emerging |
| 2026 | 10.3% | Sustainability trends influencing choices |
| 2027 | 10.7% | Growing urban population drives demand |
| 2028 | 11.1% | Fitness culture promoting dairy intake |
| 2029 | 11.5% | E-commerce growth enhancing accessibility |
| 2030 | 11.9% | Brand loyalty strengthening consumer base |
| 2031 | 12.3% | Government initiatives supporting health |
| 2032 | 12.7% | Youth demographic prioritizing wellness |
Note - Market size estimations and growth projections presented in this report are based on 6Wresearch’s advanced forecasting approach, validated with industry datasets as of June 2026.
Kenya Low Fat Dairy Products Market Synopsis
In recent years, Kenya has witnessed a remarkable shift towards low-fat dairy products, driven by changing lifestyles and health concerns such as obesity and cardiovascular diseases. Products like low-fat milk, yogurt, and cheese have become staples for many households seeking to maintain a balanced diet without compromising on taste or nutritional value.
As consumers become more aware of the health benefits associated with low-fat dairy, the market landscape is evolving. This transformation is further supported by government initiatives aimed at promoting healthier dietary choices and the production of quality dairy products, making low-fat options more accessible across the country.
Kenya Low Fat Dairy Products Market Key Takeaways
- The demand for low-fat dairy products is primarily driven by rising health awareness and changing consumer preferences.
- Urbanization and Western dietary influences are reshaping food consumption patterns in Kenya.
- Low-fat dairy products retain essential nutrients while offering lower calories and fat content.
- Government policies are increasingly supportive of the low-fat dairy segment, promoting public health initiatives.
- Product formulation and maintaining taste while reducing fat content remain key challenges for manufacturers.
Evaluation of Restraints in Kenya Low Fat Dairy Products Market
Despite the promising growth, several limitations hinder the market's potential. Consumer preferences for full-fat dairy options, often rooted in traditional dietary habits, can pose challenges for manufacturers attempting to promote low-fat alternatives. Additionally, achieving an optimal balance in product formulation that maintains flavor and texture while reducing fat content remains complex. As competition intensifies, companies must innovate continuously to meet evolving consumer expectations without sacrificing quality.
Kenya Low Fat Dairy Products Market Trends
Current trends indicate a rising inclination towards fortified low-fat dairy options enriched with vitamins and minerals, catering to health-conscious consumers. The increasing popularity of yogurt, particularly with probiotic benefits, is also noteworthy. Social media and health influencers play a significant role in shaping consumer perceptions and driving demand for low-fat dairy products. Moreover, eco-friendly packaging and sustainable production practices are becoming essential components of market strategies.
Kenya Low Fat Dairy Products Market Opportunities
The low-fat dairy products segment offers considerable growth opportunities for new entrants and established brands alike. Innovations in product development, such as lactose-free and plant-based alternatives, present untapped markets that align with the health and wellness trends gaining momentum among consumers. Moreover, expanding distribution networks, particularly in rural areas, can significantly enhance market penetration and accessibility, driving further demand for low-fat options.
Government Initiatives in the Kenya Low Fat Dairy Products Market
The Kenyan government is actively promoting the production and consumption of low-fat dairy products through various initiatives. Policies aimed at enhancing nutritional guidelines, along with public awareness campaigns, emphasize the health benefits of low-fat options. Additionally, quality standards are being established to ensure that low-fat dairy products meet consumer expectations, thereby encouraging both local production and consumption. Such measures are pivotal in fostering a healthier population and supporting the dairy industry's growth.
Future Insights of the Kenya Low Fat Dairy Products Market
Looking ahead to 2026-2032, the Kenya Low Fat Dairy Products Market is poised for robust growth. The increasing focus on health and wellness among consumers will continue to fuel demand, particularly for products that offer convenience alongside nutritional benefits. With ongoing urbanization and the influence of Western diets, market players must remain agile, adapting to emerging consumer preferences while leveraging technological advancements in dairy production to enhance efficiency and product quality.
Kenya Low Fat Dairy Products Market Latest Developments (May 2025 - June 2026)
Recent developments in the Kenya low-fat dairy sector highlight a shift towards innovative product offerings, including flavored low-fat yogurts and fortified milk variants. Companies are also exploring partnerships to enhance distribution channels, particularly in underserved rural markets. Furthermore, there is an observable rise in consumer engagement through social media platforms, where brands are promoting the health benefits of low-fat dairy options and connecting with health-conscious consumers.
Kenya Low Fat Dairy Products Market - Key Attractiveness of the Report
- 10 Years of Market Numbers
- Historical Data Starting from 2022 to 2025
- Base Year: 2025
- Forecast Data until 2032
- Key Performance Indicators Impacting the Market
- Major Upcoming Developments and Projects
Key Highlights of the Report:
- Kenya Low Fat Dairy Products Market Outlook
- Market Size of Kenya Low Fat Dairy Products Market, 2025
- Forecast of Kenya Low Fat Dairy Products Market, 2032
- Historical Data and Forecast of Kenya Low Fat Dairy Products Revenues & Volume for the Period 2022-2032F
- Kenya Low Fat Dairy Products Market Trend Evolution
- Kenya Low Fat Dairy Products Market Drivers and Challenges
- Kenya Low Fat Dairy Products Price Trends
- Kenya Low Fat Dairy Products Porter's Five Forces
- Kenya Low Fat Dairy Products Industry Life Cycle
- Historical Data and Forecast of Kenya Low Fat Dairy Products Market Revenues & Volume By Nature for the Period 2022-2032F
- Historical Data and Forecast of Kenya Low Fat Dairy Products Market Revenues & Volume By Organic for the Period 2022-2032F
- Historical Data and Forecast of Kenya Low Fat Dairy Products Market Revenues & Volume By Conventional for the Period 2022-2032F
- Historical Data and Forecast of Kenya Low Fat Dairy Products Market Revenues & Volume By Type for the Period 2022-2032F
- Historical Data and Forecast of Kenya Low Fat Dairy Products Market Revenues & Volume By Low Fat Butter for the Period 2022-2032F
- Historical Data and Forecast of Kenya Low Fat Dairy Products Market Revenues & Volume By Low Fat Cheese for the Period 2022-2032F
- Historical Data and Forecast of Kenya Low Fat Dairy Products Market Revenues & Volume By Low Fat Yoghurt for the Period 2022-2032F
- Historical Data and Forecast of Kenya Low Fat Dairy Products Market Revenues & Volume By Low Fat Ice Cream for the Period 2022-2032F
- Historical Data and Forecast of Kenya Low Fat Dairy Products Market Revenues & Volume By Reduced Fat Margarine for the Period 2022-2032F
- Historical Data and Forecast of Kenya Low Fat Dairy Products Market Revenues & Volume By Fat Free Condensed Milk for the Period 2022-2032F
- Historical Data and Forecast of Kenya Low Fat Dairy Products Market Revenues & Volume By Skimmed Milk for the Period 2022-2032F
- Historical Data and Forecast of Kenya Low Fat Dairy Products Market Revenues & Volume By Others for the Period 2022-2032F
- Historical Data and Forecast of Kenya Low Fat Dairy Products Market Revenues & Volume By Distribution Channel for the Period 2022-2032F
- Historical Data and Forecast of Kenya Low Fat Dairy Products Market Revenues & Volume By Supermarkets and Hypermarkets for the Period 2022-2032F
- Historical Data and Forecast of Kenya Low Fat Dairy Products Market Revenues & Volume By Convenience Stores for the Period 2022-2032F
- Historical Data and Forecast of Kenya Low Fat Dairy Products Market Revenues & Volume By Dairy Stores for the Period 2022-2032F
- Historical Data and Forecast of Kenya Low Fat Dairy Products Market Revenues & Volume By Online for the Period 2022-2032F
- Historical Data and Forecast of Kenya Low Fat Dairy Products Market Revenues & Volume By Others for the Period 2022-2032F
- Kenya Low Fat Dairy Products Import Export Trade Statistics
- Market Opportunity Assessment By Nature
- Market Opportunity Assessment By Type
- Market Opportunity Assessment By Distribution Channel
- Kenya Low Fat Dairy Products Top Companies Market Share
- Kenya Low Fat Dairy Products Competitive Benchmarking By Technical and Operational Parameters
- Kenya Low Fat Dairy Products Company Profiles
- Kenya Low Fat Dairy Products Key Strategic Recommendations
Kenya Low Fat Dairy Products Market - Frequently Asked Questions
The primary drivers include heightened health awareness among consumers, urbanization, and the influence of Western dietary practices, all of which favor lower-calorie and lower-fat food options.
The market was estimated at USD 1495 Million in 2025 and is projected to reach USD 2721 Million by 2032, growing at a CAGR of 8.9% from 2026 to 2032, indicating substantial growth potential.
Popular products include low-fat milk, yogurt, cheese, and butter, with particular interest in those that offer additional health benefits, such as probiotics and fortification with vitamins.
Yes, the government is implementing policies that promote healthy dietary choices and improve the quality of dairy products through public health campaigns and nutritional guidelines.
Manufacturers must navigate challenges related to maintaining flavor and texture in reduced-fat products while also contending with stiff market competition and consumer preferences leaning towards traditional dairy products.
6Wresearch actively monitors the Kenya Low Fat Dairy Products Market and publishes its comprehensive annual report, highlighting emerging trends, growth drivers, revenue analysis, and forecast outlook. Our insights help businesses to make data-backed strategic decisions with ongoing market dynamics. Our analysts track relevent industries related to the Kenya Low Fat Dairy Products Market, allowing our clients with actionable intelligence and reliable forecasts tailored to emerging regional needs.
Yes, we provide customisation as per your requirements. To learn more, feel free to contact us on sales@6wresearch.com
1 Executive Summary |
2 Introduction |
2.1 Key Highlights of the Report |
2.2 Report Description |
2.3 Market Scope & Segmentation |
2.4 Research Methodology |
2.5 Assumptions |
3 Kenya Low Fat Dairy Products Market Overview |
3.1 Kenya Country Macro Economic Indicators |
3.2 Kenya Low Fat Dairy Products Market Revenues & Volume, 2022 & 2032F |
3.3 Kenya Low Fat Dairy Products Market - Industry Life Cycle |
3.4 Kenya Low Fat Dairy Products Market - Porter's Five Forces |
3.5 Kenya Low Fat Dairy Products Market Revenues & Volume Share, By Nature, 2022 & 2032F |
3.6 Kenya Low Fat Dairy Products Market Revenues & Volume Share, By Type, 2022 & 2032F |
3.7 Kenya Low Fat Dairy Products Market Revenues & Volume Share, By Distribution Channel, 2022 & 2032F |
4 Kenya Low Fat Dairy Products Market Dynamics |
4.1 Impact Analysis |
4.2 Market Drivers |
4.2.1 Increasing health consciousness and awareness about the benefits of low-fat dairy products among consumers in Kenya |
4.2.2 Growing disposable income leading to higher spending on premium and healthier food options |
4.2.3 Government initiatives promoting a healthy lifestyle and encouraging the consumption of low-fat dairy products |
4.3 Market Restraints |
4.3.1 Price sensitivity among consumers due to the perceived higher cost of low-fat dairy products compared to regular dairy products |
4.3.2 Limited availability and distribution of low-fat dairy products in certain regions of Kenya |
4.3.3 Consumer preferences for traditional full-fat dairy products over low-fat alternatives |
5 Kenya Low Fat Dairy Products Market Trends |
6 Kenya Low Fat Dairy Products Market, By Types |
6.1 Kenya Low Fat Dairy Products Market, By Nature |
6.1.1 Overview and Analysis |
6.1.2 Kenya Low Fat Dairy Products Market Revenues & Volume, By Nature, 2022-2032F |
6.1.3 Kenya Low Fat Dairy Products Market Revenues & Volume, By Organic, 2022-2032F |
6.1.4 Kenya Low Fat Dairy Products Market Revenues & Volume, By Conventional, 2022-2032F |
6.2 Kenya Low Fat Dairy Products Market, By Type |
6.2.1 Overview and Analysis |
6.2.2 Kenya Low Fat Dairy Products Market Revenues & Volume, By Low Fat Butter, 2022-2032F |
6.2.3 Kenya Low Fat Dairy Products Market Revenues & Volume, By Low Fat Cheese, 2022-2032F |
6.2.4 Kenya Low Fat Dairy Products Market Revenues & Volume, By Low Fat Yoghurt, 2022-2032F |
6.2.5 Kenya Low Fat Dairy Products Market Revenues & Volume, By Low Fat Ice Cream, 2022-2032F |
6.2.6 Kenya Low Fat Dairy Products Market Revenues & Volume, By Reduced Fat Margarine, 2022-2032F |
6.2.7 Kenya Low Fat Dairy Products Market Revenues & Volume, By Fat Free Condensed Milk, 2022-2032F |
6.2.8 Kenya Low Fat Dairy Products Market Revenues & Volume, By Others, 2022-2032F |
6.2.9 Kenya Low Fat Dairy Products Market Revenues & Volume, By Others, 2022-2032F |
6.3 Kenya Low Fat Dairy Products Market, By Distribution Channel |
6.3.1 Overview and Analysis |
6.3.2 Kenya Low Fat Dairy Products Market Revenues & Volume, By Supermarkets and Hypermarkets, 2022-2032F |
6.3.3 Kenya Low Fat Dairy Products Market Revenues & Volume, By Convenience Stores, 2022-2032F |
6.3.4 Kenya Low Fat Dairy Products Market Revenues & Volume, By Dairy Stores, 2022-2032F |
6.3.5 Kenya Low Fat Dairy Products Market Revenues & Volume, By Online, 2022-2032F |
6.3.6 Kenya Low Fat Dairy Products Market Revenues & Volume, By Others, 2022-2032F |
7 Kenya Low Fat Dairy Products Market Import-Export Trade Statistics |
7.1 Kenya Low Fat Dairy Products Market Export to Major Countries |
7.2 Kenya Low Fat Dairy Products Market Imports from Major Countries |
8 Kenya Low Fat Dairy Products Market Key Performance Indicators |
8.1 Percentage increase in the number of health and wellness campaigns promoting low-fat dairy products |
8.2 Growth in the number of retail outlets stocking a wider variety of low-fat dairy products |
8.3 Percentage of consumers shifting from full-fat to low-fat dairy products |
8.4 Adoption rate of low-fat dairy products among different age demographics |
8.5 Increase in online searches and social media mentions related to low-fat dairy products in Kenya |
9 Kenya Low Fat Dairy Products Market - Opportunity Assessment |
9.1 Kenya Low Fat Dairy Products Market Opportunity Assessment, By Nature, 2022 & 2032F |
9.2 Kenya Low Fat Dairy Products Market Opportunity Assessment, By Type, 2022 & 2032F |
9.3 Kenya Low Fat Dairy Products Market Opportunity Assessment, By Distribution Channel, 2022 & 2032F |
10 Kenya Low Fat Dairy Products Market - Competitive Landscape |
10.1 Kenya Low Fat Dairy Products Market Revenue Share, By Companies, 2025 |
10.2 Kenya Low Fat Dairy Products Market Competitive Benchmarking, By Operating and Technical Parameters |
11 Company Profiles |
12 Recommendations |
13 Disclaimer |
Global Go To Market Strategy - 2030
Export potential enables firms to identify high-growth global markets with greater confidence by combining advanced trade intelligence with a structured quantitative methodology. The framework analyzes emerging demand trends and country-level import patterns while integrating macroeconomic and trade datasets such as GDP and population forecasts, bilateral import–export flows, tariff structures, elasticity differentials between developed and developing economies, geographic distance, and import demand projections. Using weighted trade values from 2020–2024 as the base period to project country-to-country export potential for 2030, these inputs are operationalized through calculated drivers such as gravity model parameters, tariff impact factors, and projected GDP per-capita growth. Through an analysis of hidden potentials, demand hotspots, and market conditions that are most favorable to success, this method enables firms to focus on target countries, maximize returns, and global expansion with data, backed by accuracy.
By factoring in the projected importer demand gap that is currently unmet and could be potential opportunity, it identifies the potential for the Exporter (Country) among 190 countries, against the general trade analysis, which identifies the biggest importer or exporter.
To discover high-growth global markets and optimize your business strategy:
Click Here
Pricing
- Single User License$ 1,995
- Department License$ 2,400
- Site License$ 3,120
- Global License$ 3,795

Leadership Perspectives from Industry Events
Search
Thought Leadership and Analyst Meet


Our Clients
6WResearch In News
- India Air Conditioner Market Set for Strong Rebound in 2026 After Weather-Led Correction and GST-Driven Recovery: 6Wresearch
- ADAS in India: How Automatic Emergency Braking, Blind Spot Detection & Driver Monitoring are Transforming Road Safety
- Doha a strategic location for EV manufacturing hub: IPA Qatar
- Demand for luxury TVs surging in the GCC, says Samsung
- Empowering Growth: The Thriving Journey of Bangladesh’s Cable Industry
- Demand for luxury TVs surging in the GCC, says Samsung
Latest Reports
- Nicaragua RPG Gaming Market (2026-2032)
- New Zealand RPG Gaming Market (2026-2032)
- Netherlands RPG Gaming Market (2026-2032)
- Nauru RPG Gaming Market (2026-2032)
- Namibia RPG Gaming Market (2026-2032)
- Mozambique RPG Gaming Market (2026-2032)
- Montenegro RPG Gaming Market (2026-2032)
- Mongolia RPG Gaming Market (2026-2032)
- Monaco RPG Gaming Market (2026-2032)
- Micronesia RPG Gaming Market (2026-2032)
Industry Events and Analyst Meet

EV India Expo 2026

HIMTEX 2026

India Refining Summit 2026

India EV Show 2026

EV tech India Expo 2026
Whitepaper
- Middle East & Africa Commercial Security Market Click here to view more.
- Middle East & Africa Fire Safety Systems & Equipment Market Click here to view more.
- GCC Drone Market Click here to view more.
- Middle East Lighting Fixture Market Click here to view more.
- GCC Physical & Perimeter Security Market Click here to view more.