Kenya Mercury Market Outlook | Forecast, Value, COVID-19 IMPACT, Growth, Revenue, Companies, Share, Trends, Analysis, Size & Industry
Market Forecast By Application (Chemical manufacturing, Artisanal gold mining, Batteries, Dentistry, Measurement And Control Devices, Electrical and lighting, Others) And Competitive Landscape
| Product Code: ETC194282 | Publication Date: May 2022 | Updated Date: Aug 2025 | Product Type: Market Research Report | |
| Publisher: 6Wresearch | Author: Ravi Bhandari | No. of Pages: 60 | No. of Figures: 40 | No. of Tables: 7 |
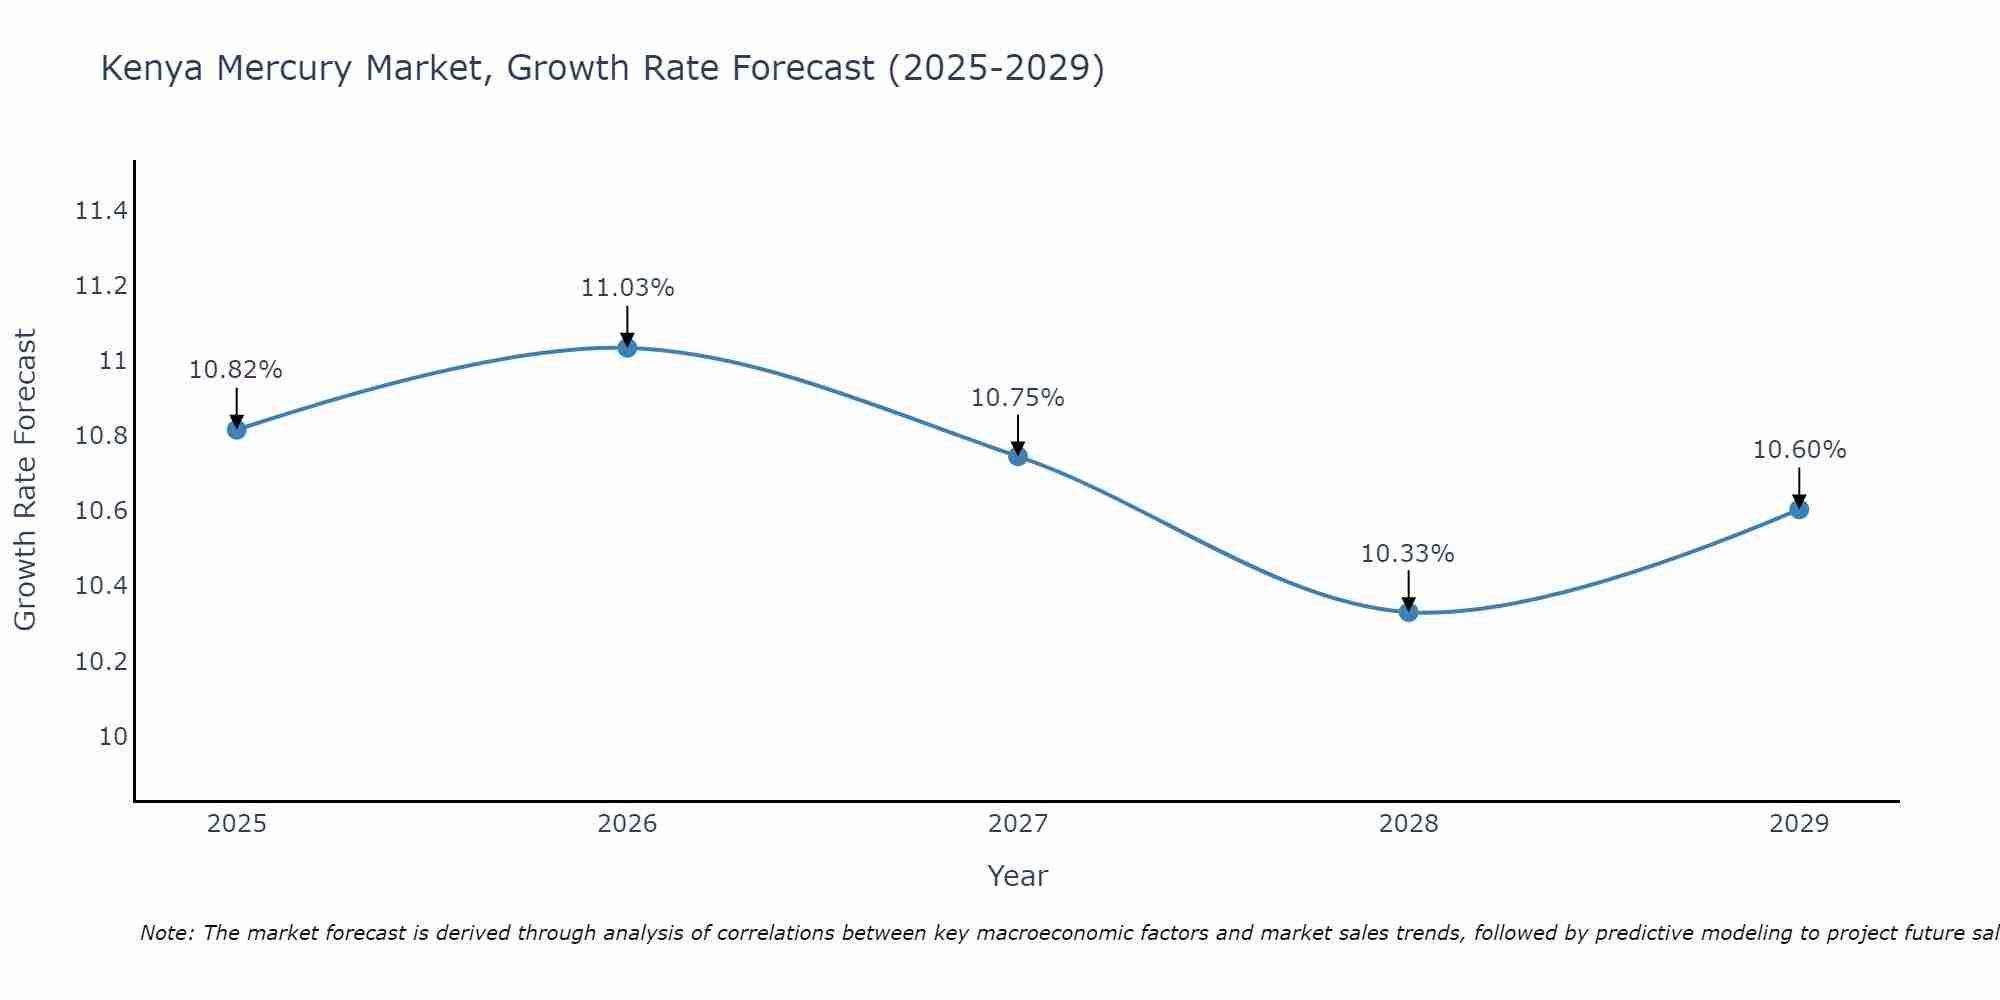
Kenya Mercury Market Size Growth Rate
The Kenya Mercury Market is projected to witness mixed growth rate patterns during 2025 to 2029. Growth accelerates to 11.03% in 2026, following an initial rate of 10.82%, before easing to 10.60% at the end of the period.
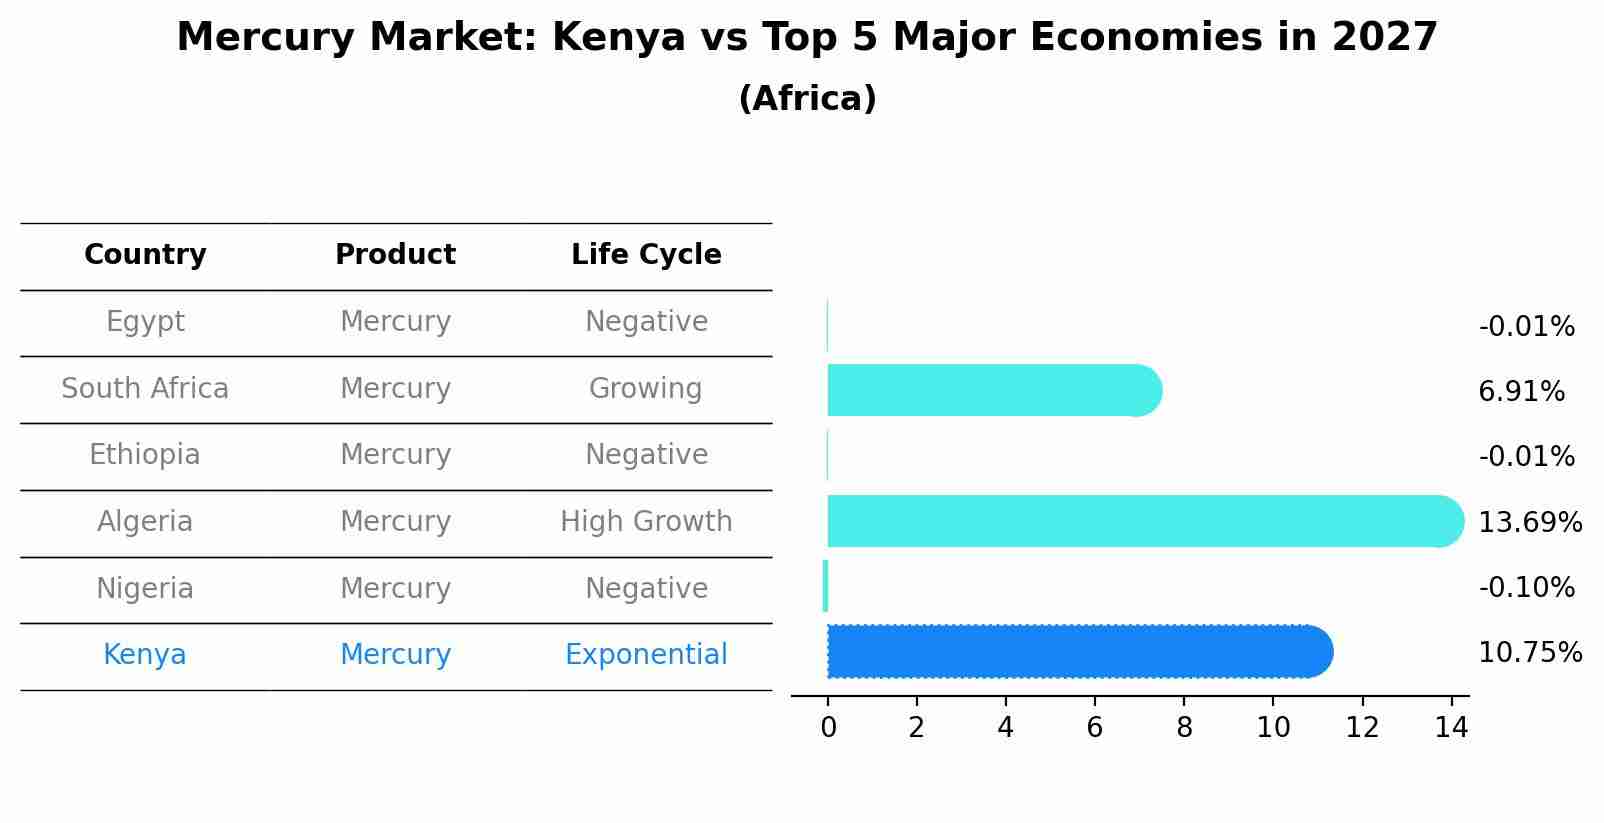
Mercury Market: Kenya vs Top 5 Major Economies in 2027 (Africa)
The Mercury market in Kenya is projected to grow at a high growth rate of 10.75% by 2027, within the Africa region led by Egypt, along with other countries like South Africa, Ethiopia, Algeria and Nigeria, collectively shaping a dynamic and evolving market environment driven by innovation and increasing adoption of emerging technologies.
Kenya Mercury Market Overview
The mercury market in Kenya faces regulatory challenges due to concerns regarding its environmental and health impacts. While mercury finds applications in various industries such as healthcare, electronics, and mining, efforts to phase out its use and promote safer alternatives are influencing market dynamics. Regulatory compliance and sustainability considerations are key factors shaping the future of the mercury market in Kenya.
Drivers of the market
The mercury market in Kenya is driven by its use in industrial processes, artisanal gold mining, and small-scale gold extraction, despite efforts to regulate and phase out mercury use due to environmental and health concerns.
Challenges of the market
The Mercury Market faces challenges related to the high cost of raw materials and the complexities associated with extraction and processing. There is significant competition from alternative materials and international suppliers, which affects pricing and market share. Regulatory compliance with environmental and safety standards adds to the operational burden. The market requires substantial investment in research and development to improve production efficiency and develop new applications for mercury. Additionally, there is a need for increased awareness and education among potential users about the benefits and applications of mercury in various industries.
Government Policy of the market
The Kenya mercury market faces challenges related to environmental conservation and regulatory compliance. Market players encounter difficulties in addressing concerns about mercury pollution and implementing sustainable extraction and disposal practices. Additionally, managing mercury trade restrictions and exploring alternative uses pose hurdles for market expansion.
Key Highlights of the Report:
- Kenya Mercury Market Outlook
- Market Size of Kenya Mercury Market, 2021
- Forecast of Kenya Mercury Market, 2028
- Historical Data and Forecast of Kenya Mercury Revenues & Volume for the Period 2018 - 2028
- Kenya Mercury Market Trend Evolution
- Kenya Mercury Market Drivers and Challenges
- Kenya Mercury Price Trends
- Kenya Mercury Porter's Five Forces
- Kenya Mercury Industry Life Cycle
- Historical Data and Forecast of Kenya Mercury Market Revenues & Volume By Application for the Period 2018 - 2028
- Historical Data and Forecast of Kenya Mercury Market Revenues & Volume By Chemical manufacturing for the Period 2018 - 2028
- Historical Data and Forecast of Kenya Mercury Market Revenues & Volume By Artisanal gold mining for the Period 2018 - 2028
- Historical Data and Forecast of Kenya Mercury Market Revenues & Volume By Batteries for the Period 2018 - 2028
- Historical Data and Forecast of Kenya Mercury Market Revenues & Volume By Dentistry for the Period 2018 - 2028
- Historical Data and Forecast of Kenya Mercury Market Revenues & Volume By Measurement And Control Devices for the Period 2018 - 2028
- Historical Data and Forecast of Kenya Mercury Market Revenues & Volume By Electrical and lighting for the Period 2018 - 2028
- Historical Data and Forecast of Kenya Mercury Market Revenues & Volume By Others for the Period 2018 - 2028
- Kenya Mercury Import Export Trade Statistics
- Market Opportunity Assessment By Application
- Kenya Mercury Top Companies Market Share
- Kenya Mercury Competitive Benchmarking By Technical and Operational Parameters
- Kenya Mercury Company Profiles
- Kenya Mercury Key Strategic Recommendations
Frequently Asked Questions About the Market Study (FAQs):
6Wresearch actively monitors the Kenya Mercury Market and publishes its comprehensive annual report, highlighting emerging trends, growth drivers, revenue analysis, and forecast outlook. Our insights help businesses to make data-backed strategic decisions with ongoing market dynamics. Our analysts track relevent industries related to the Kenya Mercury Market, allowing our clients with actionable intelligence and reliable forecasts tailored to emerging regional needs.
Yes, we provide customisation as per your requirements. To learn more, feel free to contact us on sales@6wresearch.com
1 Executive Summary |
2 Introduction |
2.1 Key Highlights of the Report |
2.2 Report Description |
2.3 Market Scope & Segmentation |
2.4 Research Methodology |
2.5 Assumptions |
3 Kenya Mercury Market Overview |
3.1 Kenya Country Macro Economic Indicators |
3.2 Kenya Mercury Market Revenues & Volume, 2021 & 2028F |
3.3 Kenya Mercury Market - Industry Life Cycle |
3.4 Kenya Mercury Market - Porter's Five Forces |
3.5 Kenya Mercury Market Revenues & Volume Share, By Application, 2021 & 2028F |
4 Kenya Mercury Market Dynamics |
4.1 Impact Analysis |
4.2 Market Drivers |
4.2.1 Increasing demand for mercury in various industries such as mining, healthcare, and agriculture. |
4.2.2 Growth in the manufacturing sector leading to higher usage of mercury in industrial processes. |
4.2.3 Rising population and urbanization in Kenya driving the demand for products requiring mercury, such as electronics and healthcare equipment. |
4.3 Market Restraints |
4.3.1 Stringent environmental regulations and bans on mercury use impacting the market growth. |
4.3.2 Health concerns and awareness about the toxic effects of mercury leading to reduced consumption. |
4.3.3 Availability of safer alternatives to mercury affecting its market demand. |
5 Kenya Mercury Market Trends |
6 Kenya Mercury Market, By Types |
6.1 Kenya Mercury Market, By Application |
6.1.1 Overview and Analysis |
6.1.2 Kenya Mercury Market Revenues & Volume, By Application, 2018 - 2028F |
6.1.3 Kenya Mercury Market Revenues & Volume, By Chemical manufacturing, 2018 - 2028F |
6.1.4 Kenya Mercury Market Revenues & Volume, By Artisanal gold mining, 2018 - 2028F |
6.1.5 Kenya Mercury Market Revenues & Volume, By Batteries, 2018 - 2028F |
6.1.6 Kenya Mercury Market Revenues & Volume, By Dentistry, 2018 - 2028F |
6.1.7 Kenya Mercury Market Revenues & Volume, By Measurement And Control Devices, 2018 - 2028F |
6.1.8 Kenya Mercury Market Revenues & Volume, By Electrical and lighting, 2018 - 2028F |
7 Kenya Mercury Market Import-Export Trade Statistics |
7.1 Kenya Mercury Market Export to Major Countries |
7.2 Kenya Mercury Market Imports from Major Countries |
8 Kenya Mercury Market Key Performance Indicators |
8.1 Number of new applications or industries utilizing mercury. |
8.2 Government regulations compliance rate in the use of mercury. |
8.3 Investment in research and development for mercury alternatives. |
8.4 Adoption rate of eco-friendly practices in industries using mercury. |
8.5 Percentage of recycled mercury in the market. |
9 Kenya Mercury Market - Opportunity Assessment |
9.1 Kenya Mercury Market Opportunity Assessment, By Application, 2021 & 2028F |
10 Kenya Mercury Market - Competitive Landscape |
10.1 Kenya Mercury Market Revenue Share, By Companies, 2021 |
10.2 Kenya Mercury Market Competitive Benchmarking, By Operating and Technical Parameters |
11 Company Profiles |
12 Recommendations |
13 Disclaimer |
Global Go To Market Strategy - 2030
Export potential enables firms to identify high-growth global markets with greater confidence by combining advanced trade intelligence with a structured quantitative methodology. The framework analyzes emerging demand trends and country-level import patterns while integrating macroeconomic and trade datasets such as GDP and population forecasts, bilateral import–export flows, tariff structures, elasticity differentials between developed and developing economies, geographic distance, and import demand projections. Using weighted trade values from 2020–2024 as the base period to project country-to-country export potential for 2030, these inputs are operationalized through calculated drivers such as gravity model parameters, tariff impact factors, and projected GDP per-capita growth. Through an analysis of hidden potentials, demand hotspots, and market conditions that are most favorable to success, this method enables firms to focus on target countries, maximize returns, and global expansion with data, backed by accuracy.
By factoring in the projected importer demand gap that is currently unmet and could be potential opportunity, it identifies the potential for the Exporter (Country) among 190 countries, against the general trade analysis, which identifies the biggest importer or exporter.
To discover high-growth global markets and optimize your business strategy:
Click Here
Pricing
- Single User License$ 1,995
- Department License$ 2,400
- Site License$ 3,120
- Global License$ 3,795

Leadership Perspectives from Industry Events
Search
Thought Leadership and Analyst Meet


Our Clients
6WResearch In News
- India Air Conditioner Market Set for Strong Rebound in 2026 After Weather-Led Correction and GST-Driven Recovery: 6Wresearch
- ADAS in India: How Automatic Emergency Braking, Blind Spot Detection & Driver Monitoring are Transforming Road Safety
- Doha a strategic location for EV manufacturing hub: IPA Qatar
- Demand for luxury TVs surging in the GCC, says Samsung
- Empowering Growth: The Thriving Journey of Bangladesh’s Cable Industry
- Demand for luxury TVs surging in the GCC, says Samsung
Latest Reports
- Poland Fire Protection Systems Market (2026-2032)
- Cape Verde Portable Hand-Thrown Extinguisher Market (2026-2032)
- Canada Portable Hand-Thrown Extinguisher Market (2026-2032)
- Cameroon Portable Hand-Thrown Extinguisher Market (2026-2032)
- Burundi Portable Hand-Thrown Extinguisher Market (2026-2032)
- Burkina Faso Portable Hand-Thrown Extinguisher Market (2026-2032)
- Bulgaria Portable Hand-Thrown Extinguisher Market (2026-2032)
- Brunei Portable Hand-Thrown Extinguisher Market (2026-2032)
- Botswana Portable Hand-Thrown Extinguisher Market (2026-2032)
- Bosnia and Herzegovina Portable Hand-Thrown Extinguisher Market (2026-2032)
Industry Events and Analyst Meet

HIMTEX 2026

India Refining Summit 2026

India EV Show 2026

EV tech India Expo 2026

Auto Tech Asia 2026
Whitepaper
- Middle East & Africa Commercial Security Market Click here to view more.
- Middle East & Africa Fire Safety Systems & Equipment Market Click here to view more.
- GCC Drone Market Click here to view more.
- Middle East Lighting Fixture Market Click here to view more.
- GCC Physical & Perimeter Security Market Click here to view more.