Kenya N-propanol Market Outlook | Growth, Forecast, Share, Size, Companies, COVID-19 IMPACT, Trends, Value, Analysis, Revenue & Industry
Market Forecast By Type (Ethylene Hydrogenation Method, Allyl Alcohol Hydrogenation Method, Other Compounds Byproduct Method), By Application (Coatings, Food Additive, Pharmaceutical, Cosmetics, Others) And Competitive Landscape
| Product Code: ETC335090 | Publication Date: Aug 2022 | Updated Date: Sep 2025 | Product Type: Market Research Report | |
| Publisher: 6Wresearch | Author: Ravi Bhandari | No. of Pages: 75 | No. of Figures: 35 | No. of Tables: 20 |
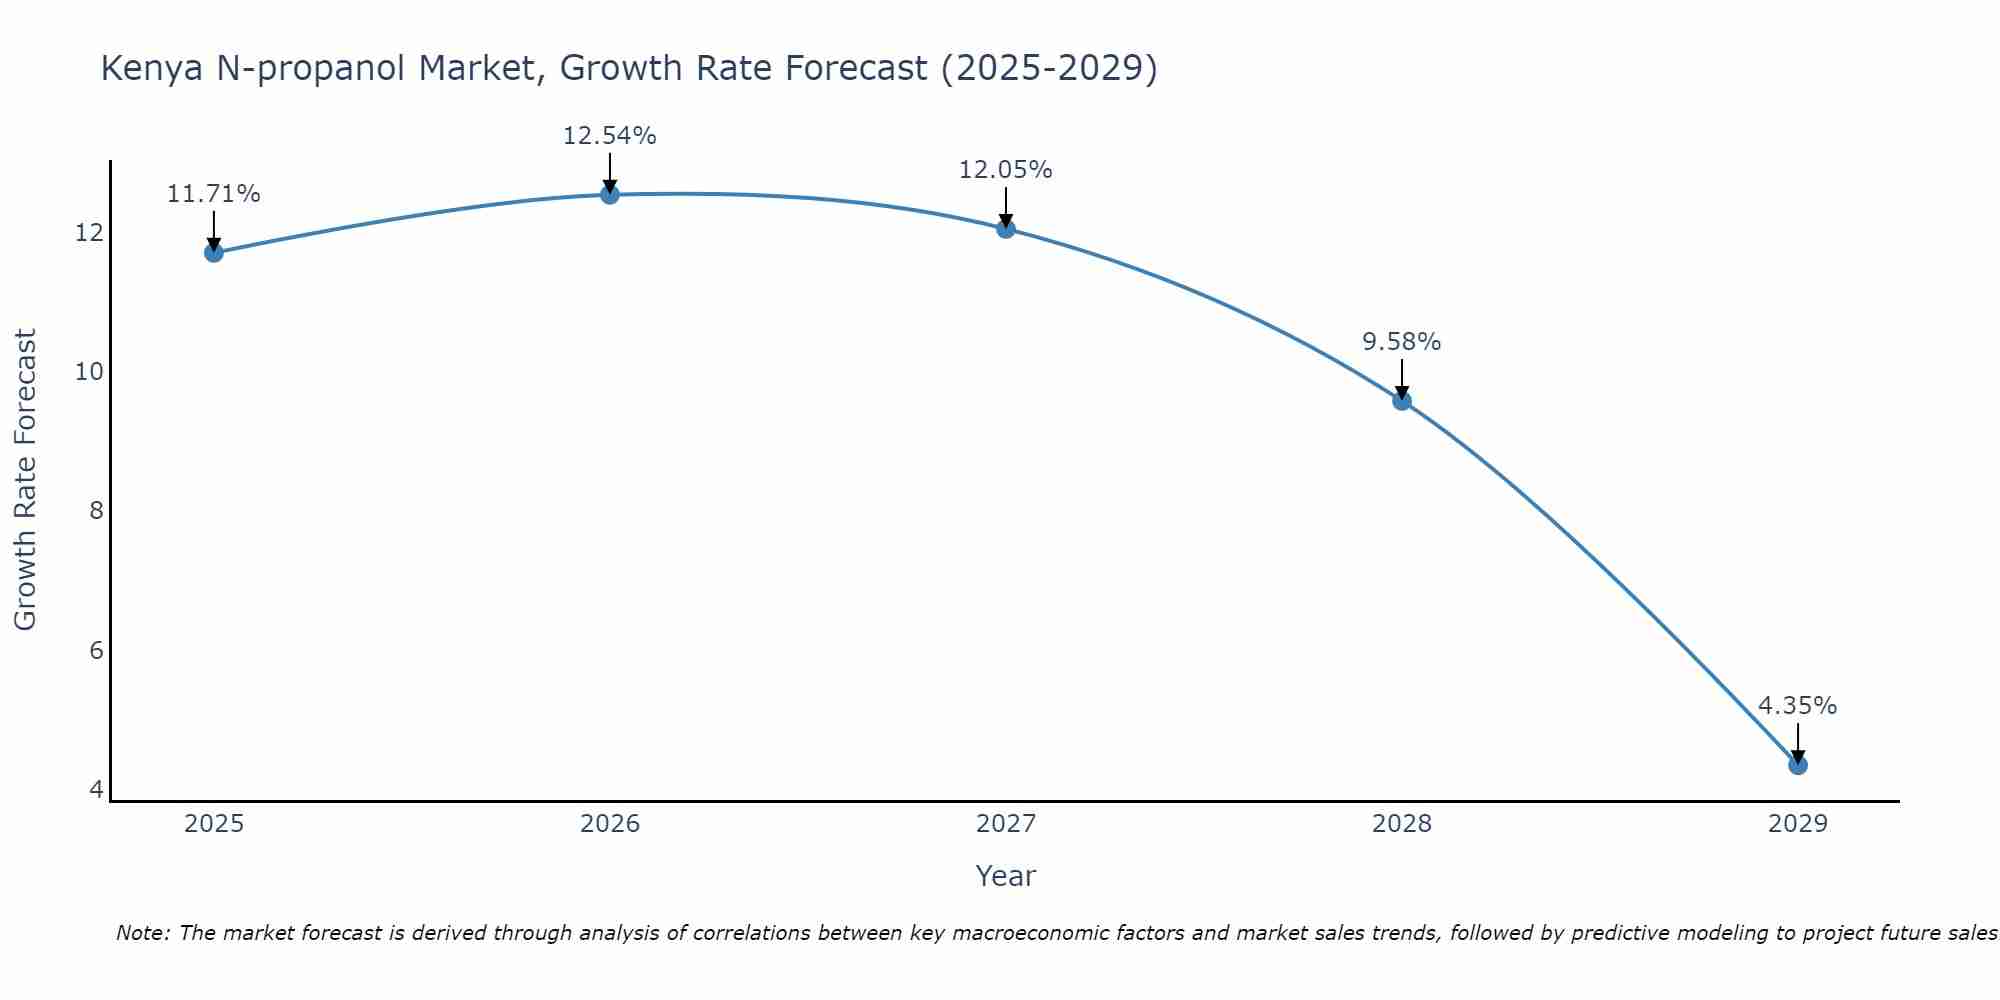
Kenya N-propanol Market Size Growth Rate
The Kenya N-propanol Market is projected to witness mixed growth rate patterns during 2025 to 2029. Growth accelerates to 12.54% in 2026, following an initial rate of 11.71%, before easing to 4.35% at the end of the period.
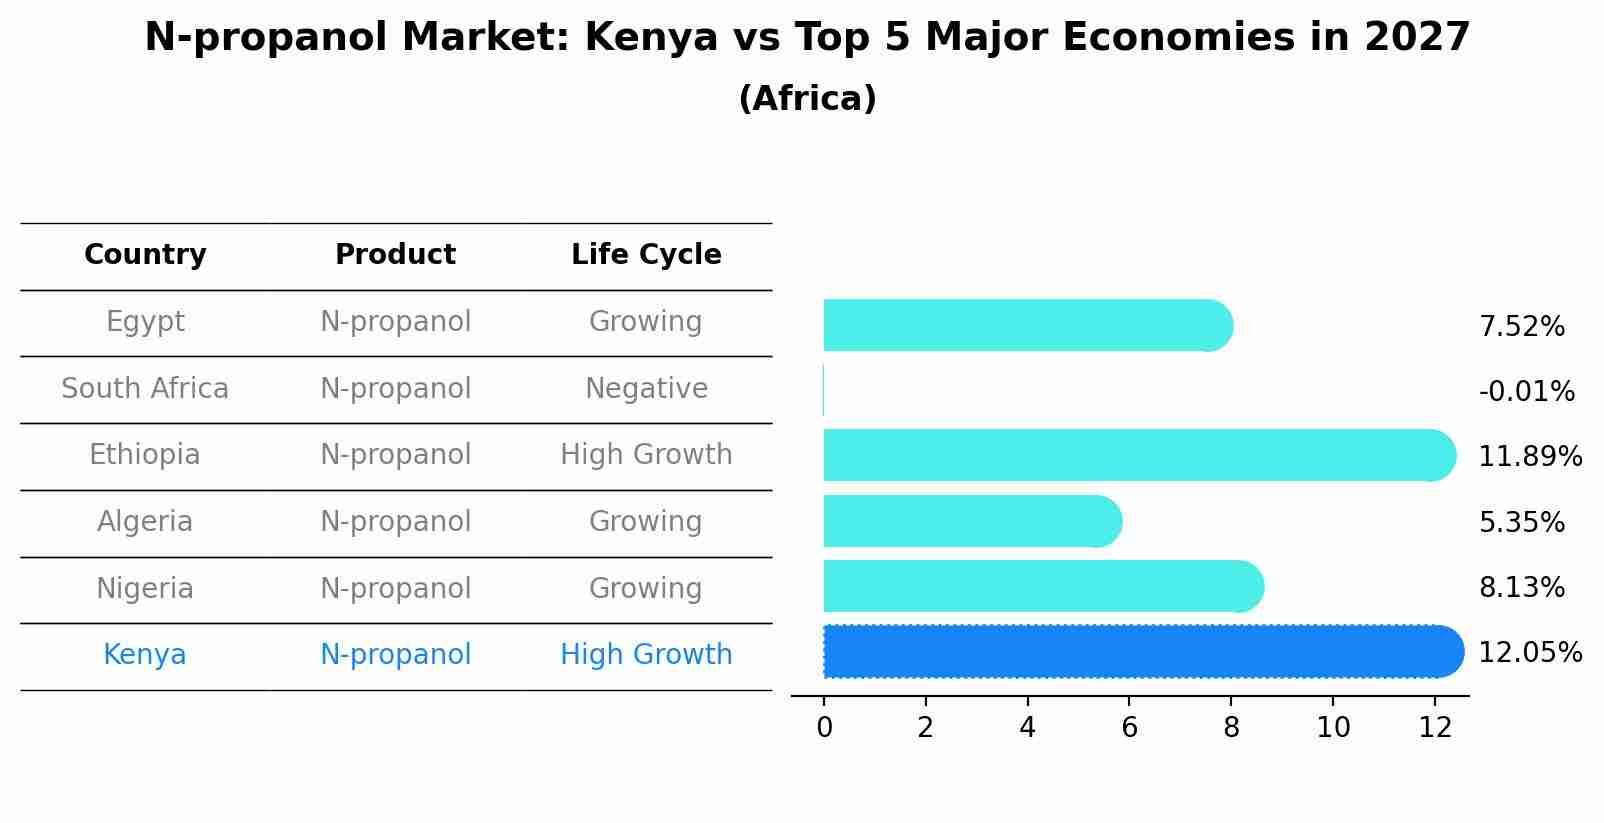
N-propanol Market: Kenya vs Top 5 Major Economies in 2027 (Africa)
The N-propanol market in Kenya is projected to grow at a high growth rate of 12.05% by 2027, highlighting the country's increasing focus on advanced technologies within the Africa region, where Egypt holds the dominant position, followed closely by South Africa, Ethiopia, Algeria and Nigeria, shaping overall regional demand.
Kenya N-propanol Market Overview
The N-propanol market in Kenya focuses on the production and distribution of this solvent used in various industrial applications, including pharmaceuticals, coatings, and cleaning products. The market is driven by industrial growth and the demand for high-quality solvents. However, challenges such as volatile raw material prices and competition from alternative solvents need to be addressed.
Drivers of the market
The N-propanol market in Kenya is influenced by the expanding industrial sector and the versatile applications of N-propanol as a solvent, intermediate, and chemical feedstock, driven by factors such as manufacturing activities, chemical production, and pharmaceutical formulations.
Challenges of the market
The Kenya N-propanol Market is confronted with several challenges that impact its growth and sustainability. One of the primary issues is the reliance on imports to meet the demand for N-propanol, making the market vulnerable to international supply chain disruptions and price fluctuations. The high cost of importation, coupled with tariffs and taxes, further escalates the price of N-propanol, affecting its affordability for local industries. Additionally, there is limited local production capacity and technological capability to produce N-propanol, necessitating substantial investments in infrastructure and technology. Environmental regulations and compliance requirements also pose challenges, as the production and use of N-propanol must adhere to stringent safety and environmental standards.
Government Policy of the market
The N-propanol market in Kenya encounters several obstacles. One major challenge is the high cost of production and importation of N-propanol, which can be prohibitive for many industries. There is also limited awareness and understanding of the applications and benefits of N-propanol among potential users. The market is constrained by inadequate local manufacturing capabilities and a reliance on imports, exposing it to global supply chain disruptions. Additionally, regulatory hurdles and the need for compliance with international safety and environmental standards pose challenges for manufacturers and distributors.
Key Highlights of the Report:
- Kenya N-propanol Market Outlook
- Market Size of Kenya N-propanol Market, 2021
- Forecast of Kenya N-propanol Market, 2028
- Historical Data and Forecast of Kenya N-propanol Revenues & Volume for the Period 2018 - 2028
- Kenya N-propanol Market Trend Evolution
- Kenya N-propanol Market Drivers and Challenges
- Kenya N-propanol Price Trends
- Kenya N-propanol Porter's Five Forces
- Kenya N-propanol Industry Life Cycle
- Historical Data and Forecast of Kenya N-propanol Market Revenues & Volume By Type for the Period 2018 - 2028
- Historical Data and Forecast of Kenya N-propanol Market Revenues & Volume By Ethylene Hydrogenation Method for the Period 2018 - 2028
- Historical Data and Forecast of Kenya N-propanol Market Revenues & Volume By Allyl Alcohol Hydrogenation Method for the Period 2018 - 2028
- Historical Data and Forecast of Kenya N-propanol Market Revenues & Volume By Other Compounds Byproduct Method for the Period 2018 - 2028
- Historical Data and Forecast of Kenya N-propanol Market Revenues & Volume By Application for the Period 2018 - 2028
- Historical Data and Forecast of Kenya N-propanol Market Revenues & Volume By Coatings for the Period 2018 - 2028
- Historical Data and Forecast of Kenya N-propanol Market Revenues & Volume By Food Additive for the Period 2018 - 2028
- Historical Data and Forecast of Kenya N-propanol Market Revenues & Volume By Pharmaceutical for the Period 2018 - 2028
- Historical Data and Forecast of Kenya N-propanol Market Revenues & Volume By Cosmetics for the Period 2018 - 2028
- Historical Data and Forecast of Kenya N-propanol Market Revenues & Volume By Others for the Period 2018 - 2028
- Kenya N-propanol Import Export Trade Statistics
- Market Opportunity Assessment By Type
- Market Opportunity Assessment By Application
- Kenya N-propanol Top Companies Market Share
- Kenya N-propanol Competitive Benchmarking By Technical and Operational Parameters
- Kenya N-propanol Company Profiles
- Kenya N-propanol Key Strategic Recommendations
Frequently Asked Questions About the Market Study (FAQs):
6Wresearch actively monitors the Kenya N-propanol Market and publishes its comprehensive annual report, highlighting emerging trends, growth drivers, revenue analysis, and forecast outlook. Our insights help businesses to make data-backed strategic decisions with ongoing market dynamics. Our analysts track relevent industries related to the Kenya N-propanol Market, allowing our clients with actionable intelligence and reliable forecasts tailored to emerging regional needs.
Yes, we provide customisation as per your requirements. To learn more, feel free to contact us on sales@6wresearch.com
1 Executive Summary |
2 Introduction |
2.1 Key Highlights of the Report |
2.2 Report Description |
2.3 Market Scope & Segmentation |
2.4 Research Methodology |
2.5 Assumptions |
3 Kenya N-propanol Market Overview |
3.1 Kenya Country Macro Economic Indicators |
3.2 Kenya N-propanol Market Revenues & Volume, 2021 & 2028F |
3.3 Kenya N-propanol Market - Industry Life Cycle |
3.4 Kenya N-propanol Market - Porter's Five Forces |
3.5 Kenya N-propanol Market Revenues & Volume Share, By Type, 2021 & 2028F |
3.6 Kenya N-propanol Market Revenues & Volume Share, By Application, 2021 & 2028F |
4 Kenya N-propanol Market Dynamics |
4.1 Impact Analysis |
4.2 Market Drivers |
4.2.1 Growing demand for n-propanol in various industries such as pharmaceuticals, chemicals, and cosmetics in Kenya. |
4.2.2 Increasing investments in industrial infrastructure and manufacturing sector driving the consumption of n-propanol. |
4.2.3 Rising awareness about the benefits and applications of n-propanol leading to higher adoption in the market. |
4.3 Market Restraints |
4.3.1 Fluctuating prices of raw materials impacting the production cost of n-propanol. |
4.3.2 Stringent regulations and compliance standards related to the manufacturing and usage of n-propanol. |
4.3.3 Competition from alternative solvents and chemicals affecting the market growth. |
5 Kenya N-propanol Market Trends |
6 Kenya N-propanol Market, By Types |
6.1 Kenya N-propanol Market, By Type |
6.1.1 Overview and Analysis |
6.1.2 Kenya N-propanol Market Revenues & Volume, By Type, 2018 - 2028F |
6.1.3 Kenya N-propanol Market Revenues & Volume, By Ethylene Hydrogenation Method, 2018 - 2028F |
6.1.4 Kenya N-propanol Market Revenues & Volume, By Allyl Alcohol Hydrogenation Method, 2018 - 2028F |
6.1.5 Kenya N-propanol Market Revenues & Volume, By Other Compounds Byproduct Method, 2018 - 2028F |
6.2 Kenya N-propanol Market, By Application |
6.2.1 Overview and Analysis |
6.2.2 Kenya N-propanol Market Revenues & Volume, By Coatings, 2018 - 2028F |
6.2.3 Kenya N-propanol Market Revenues & Volume, By Food Additive, 2018 - 2028F |
6.2.4 Kenya N-propanol Market Revenues & Volume, By Pharmaceutical, 2018 - 2028F |
6.2.5 Kenya N-propanol Market Revenues & Volume, By Cosmetics, 2018 - 2028F |
6.2.6 Kenya N-propanol Market Revenues & Volume, By Others, 2018 - 2028F |
7 Kenya N-propanol Market Import-Export Trade Statistics |
7.1 Kenya N-propanol Market Export to Major Countries |
7.2 Kenya N-propanol Market Imports from Major Countries |
8 Kenya N-propanol Market Key Performance Indicators |
8.1 Number of new product launches incorporating n-propanol. |
8.2 Percentage increase in the adoption of n-propanol in key industries. |
8.3 Research and development investment in n-propanol-based innovations. |
8.4 Sustainability initiatives and certifications related to n-propanol production. |
8.5 Market penetration in untapped regions or sectors. |
9 Kenya N-propanol Market - Opportunity Assessment |
9.1 Kenya N-propanol Market Opportunity Assessment, By Type, 2021 & 2028F |
9.2 Kenya N-propanol Market Opportunity Assessment, By Application, 2021 & 2028F |
10 Kenya N-propanol Market - Competitive Landscape |
10.1 Kenya N-propanol Market Revenue Share, By Companies, 2021 |
10.2 Kenya N-propanol Market Competitive Benchmarking, By Operating and Technical Parameters |
11 Company Profiles |
12 Recommendations |
13 Disclaimer |
Global Go To Market Strategy - 2030
Export potential enables firms to identify high-growth global markets with greater confidence by combining advanced trade intelligence with a structured quantitative methodology. The framework analyzes emerging demand trends and country-level import patterns while integrating macroeconomic and trade datasets such as GDP and population forecasts, bilateral import–export flows, tariff structures, elasticity differentials between developed and developing economies, geographic distance, and import demand projections. Using weighted trade values from 2020–2024 as the base period to project country-to-country export potential for 2030, these inputs are operationalized through calculated drivers such as gravity model parameters, tariff impact factors, and projected GDP per-capita growth. Through an analysis of hidden potentials, demand hotspots, and market conditions that are most favorable to success, this method enables firms to focus on target countries, maximize returns, and global expansion with data, backed by accuracy.
By factoring in the projected importer demand gap that is currently unmet and could be potential opportunity, it identifies the potential for the Exporter (Country) among 190 countries, against the general trade analysis, which identifies the biggest importer or exporter.
To discover high-growth global markets and optimize your business strategy:
Click Here
Pricing
- Single User License$ 1,995
- Department License$ 2,400
- Site License$ 3,120
- Global License$ 3,795

Leadership Perspectives from Industry Events
Search
Thought Leadership and Analyst Meet


Our Clients
6WResearch In News
- Doha a strategic location for EV manufacturing hub: IPA Qatar
- Demand for luxury TVs surging in the GCC, says Samsung
- Empowering Growth: The Thriving Journey of Bangladesh’s Cable Industry
- Demand for luxury TVs surging in the GCC, says Samsung
- Video call with a traditional healer? Once unthinkable, it’s now common in South Africa
- Intelligent Buildings To Smooth GCC’s Path To Net Zero
Latest Reports
- Taiwan Airport Wireless Infrastructure Market (2026-2032)
- Vietnam Airport Wireless Infrastructure Market (2026-2032)
- Thailand Airport Wireless Infrastructure Market (2026-2032)
- South Korea Airport Wireless Infrastructure Market (2026-2032)
- Romania Airport Wireless Infrastructure Market (2026-2032)
- Qatar Airport Wireless Infrastructure Market (2026-2032)
- Philippines Airport Wireless Infrastructure Market (2026-2032)
- Japan Airport Wireless Infrastructure Market (2026-2032)
- Taiwan Airport Winter Services Market (2026-2032)
- Vietnam Airport Winter Services Market (2026-2032)
Industry Events and Analyst Meet

HIMTEX 2026

India Refining Summit 2026

India EV Show 2026

EV tech India Expo 2026

Auto Tech Asia 2026
Whitepaper
- Middle East & Africa Commercial Security Market Click here to view more.
- Middle East & Africa Fire Safety Systems & Equipment Market Click here to view more.
- GCC Drone Market Click here to view more.
- Middle East Lighting Fixture Market Click here to view more.
- GCC Physical & Perimeter Security Market Click here to view more.