Kenya Personal Care Active Ingredients Market (2026-2032) Outlook | Share, Growth, Companies, Forecast, Revenue, Trends, Size, Analysis, Industry & Value
Market Forecast By Products (Hair Care, Skin Care, Bath and Shower, Oral Care, Men™s Grooming, Other Personal Care Products), By Gender (Women, Men), By Distribution Channel (Direct Selling, Hypermarkets and Retail Chains, E-Commerce, Specialty Stores, Other Distribution Channels) And Competitive Landscape
| Product Code: ETC069669 | Publication Date: Jun 2021 | Updated Date: Jun 2026 | Product Type: Report | |
| Publisher: 6Wresearch | Author: Summon Dutta | No. of Pages: 70 | No. of Figures: 35 | No. of Tables: 5 |
Kenya Personal Care Active Ingredients Market Size, Share & Growth Rate
The Kenya Personal Care Active Ingredients Market was estimated at USD 281 Million in 2025 and is projected to reach USD 372 Million by 2032, growing at a CAGR of 4.1% from 2026 to 2032. This growth trajectory is primarily fueled by a surge in consumer awareness surrounding personal grooming and wellness, coupled with an increasing preference for natural and organic ingredients. Urbanization and rising disposable incomes further amplify this demand, allowing consumers to invest in premium personal care products that prioritize quality and efficacy.
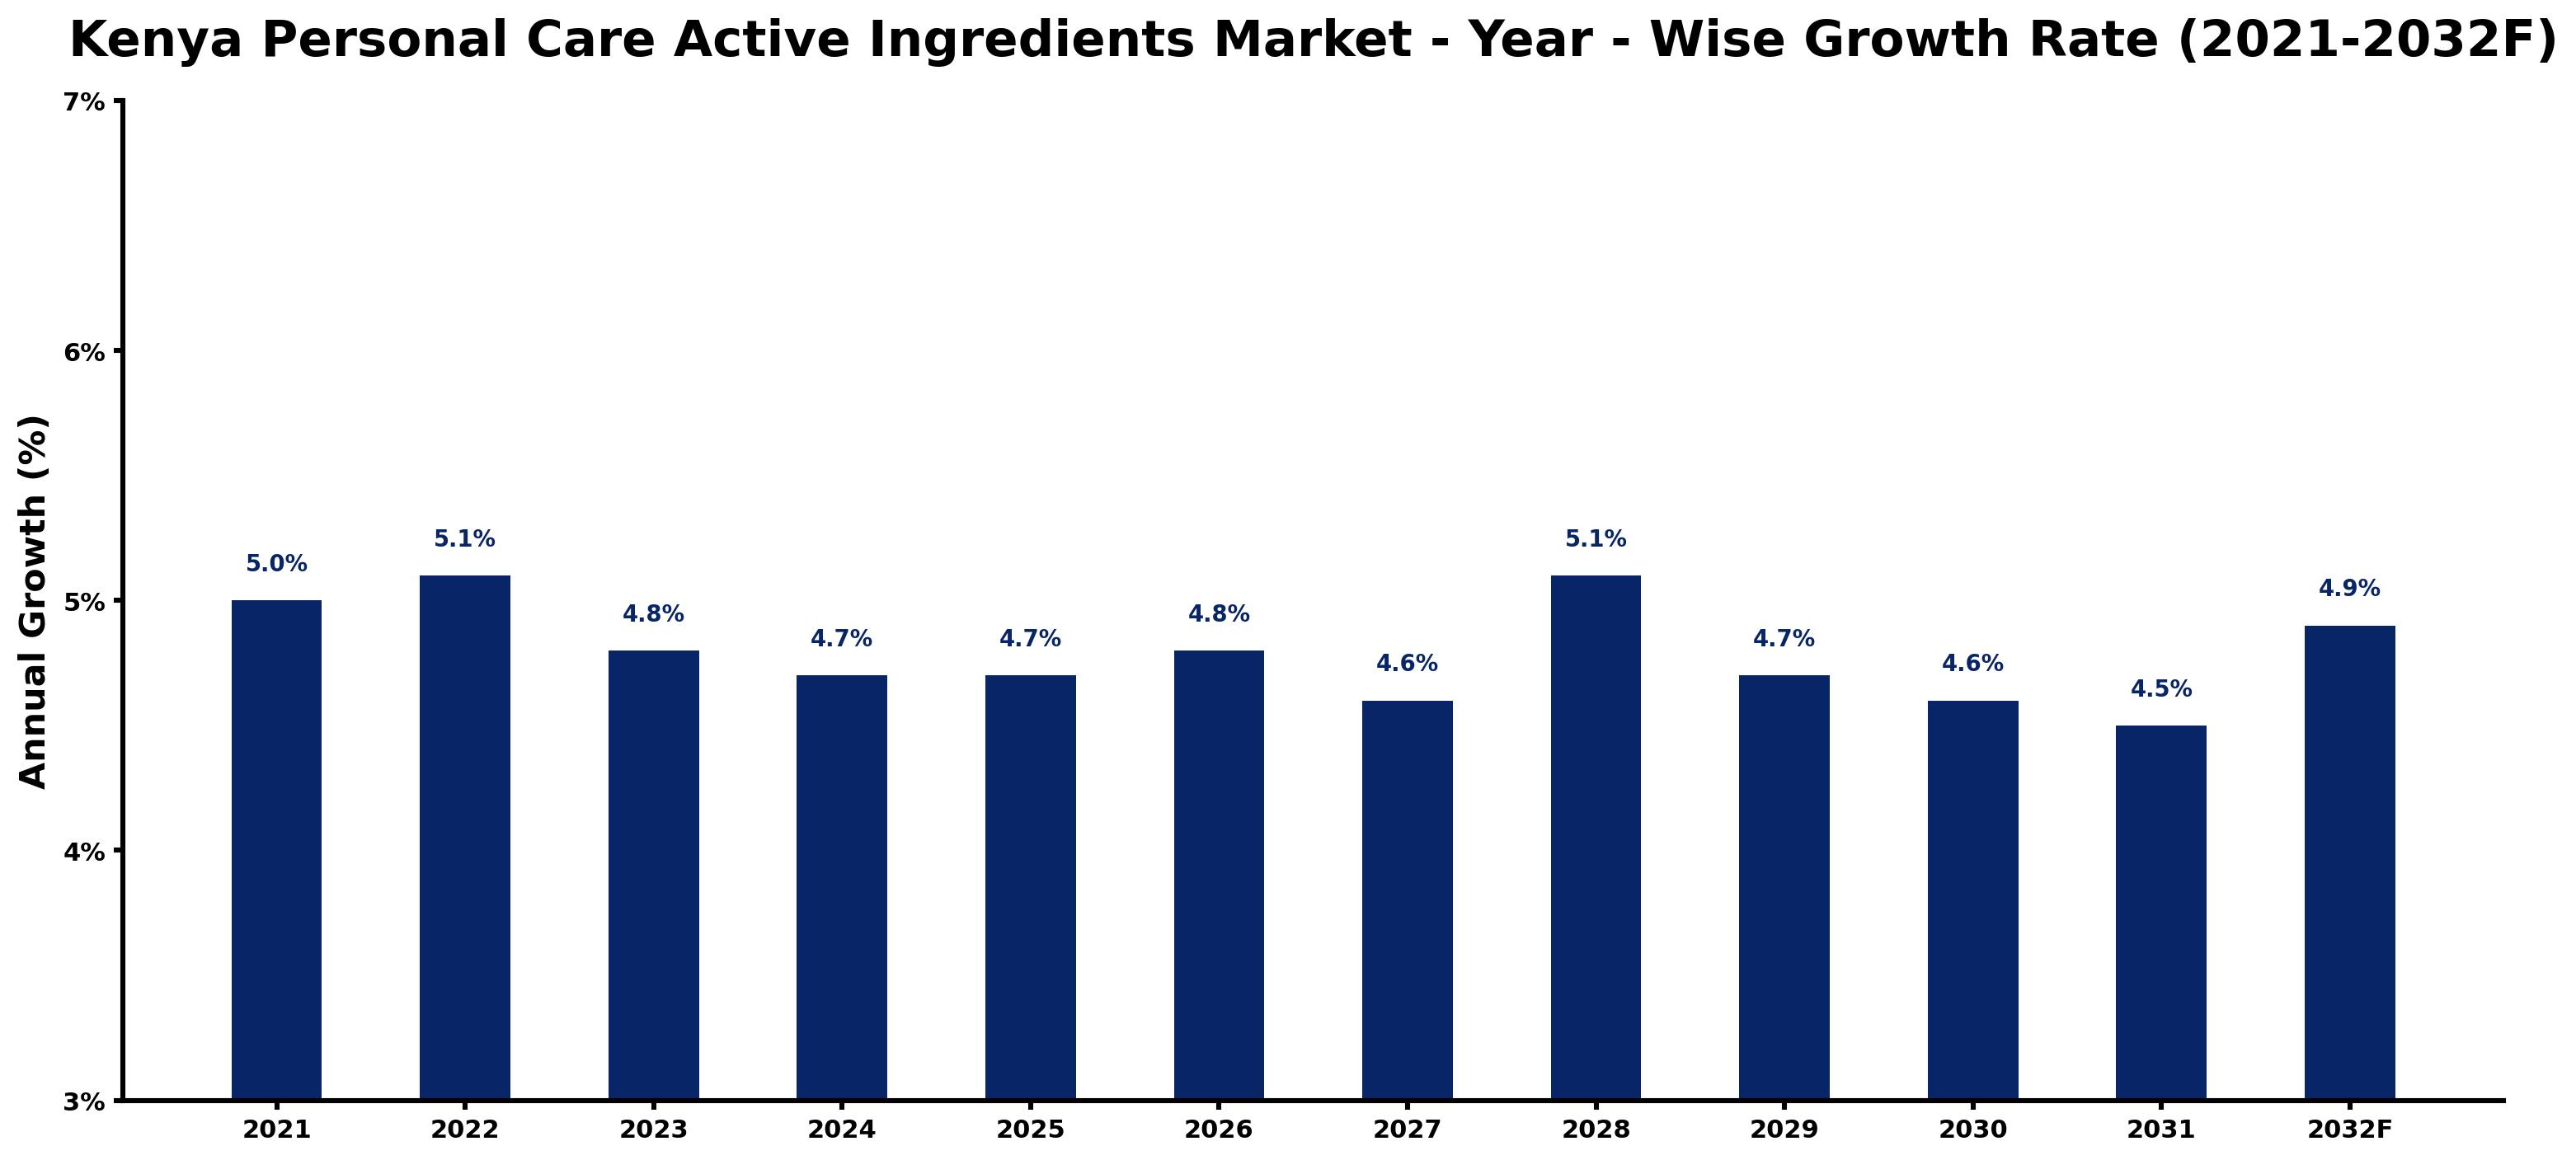
Kenya Personal Care Active Ingredients Market Growth Rate Analysis (2021-2032)
The Kenya Personal Care Active Ingredients Market displays a stable growth trend, with yearly increases mostly ranging from 4.5% to 5.1% over the past few years. Growth rates peaked at 5.1% in 2022, driven by rising consumer demand for natural and sustainable personal care products. However, the market observed a slight dip to 4.8% in 2023, influenced by fluctuating raw material costs and supply chain challenges. Looking ahead, the market is expected to maintain a steady pace, stabilizing around 4.7% to 4.9% through 2032. This growth will be supported by ongoing investments in technology and infrastructure, particularly in digitalization, as brands adapt to evolving consumer preferences.
Kenya Personal Care Active Ingredients Market Year-wise Growth Rate and Key Drivers
This graph highlights how the Kenya Personal Care Active Ingredients Market has steadily grown over the past five years, supported by major growth factors.
The table below presents the year‑wise growth rates along with the key drivers influencing the market
| Year | Growth Rate | Major Drivers |
| 2021 | 5.0% | Government infrastructure modernization initiatives |
| 2022 | 5.1% | Government infrastructure modernization initiatives |
| 2023 | 4.8% | Expansion of commercial construction activities |
| 2024 | 4.7% | Expansion of manufacturing activities |
| 2025 | 4.7% | Expansion of manufacturing activities |
| 2026 | 4.8% | Growing renewable energy integration projects |
| 2027 | 4.6% | Expansion of manufacturing activities |
| 2028 | 5.1% | Growing urbanization and commercial development |
| 2029 | 4.7% | Expansion of transportation and logistics networks |
| 2030 | 4.6% | Expansion of commercial construction activities |
| 2031 | 4.5% | Expansion of transportation and logistics networks |
| 2032 | 4.9% | Rapid growth in telecom and data center sectors |
Note - Market size estimations and growth projections presented in this report are based on 6Wresearch’s advanced forecasting approach, validated with industry datasets as of June 2026.
Kenya Personal Care Active Ingredients Market Synopsis
The Kenya Personal Care Active Ingredients Market is witnessing dynamic changes as consumers shift towards products that emphasize safety, effectiveness, and sustainability. The growing demand for natural and organic ingredients reflects a broader trend in the personal care sector, where ethical sourcing and environmental concerns are becoming paramount.
As the market evolves, there is a noticeable inclination towards botanical extracts and essential oils, which are increasingly integrated into skincare and hair care formulations. This shift not only caters to consumer desires for gentle and effective solutions but also aligns with a global movement towards cleaner beauty standards.
Kenya Personal Care Active Ingredients Market Key Takeaways
- The market is driven by increased consumer awareness regarding personal care and wellness.
- Natural and organic ingredients are gaining traction due to their perceived health benefits.
- Urbanization and a growing middle class are contributing to rising disposable incomes.
- Investment in R&D for innovative ingredient formulations is crucial for market players.
- Government support for local manufacturing and sustainable practices is shaping industry dynamics.
Evaluation of Restraints in Kenya Personal Care Active Ingredients Market
Despite the promising growth, the Kenya Personal Care Active Ingredients Market faces notable constraints. Sourcing high-quality raw materials often proves challenging due to seasonal variations and supply chain issues. Additionally, navigating the complex regulatory landscape related to ingredient safety and efficacy can hinder the introduction of new products. Competitive pricing from international suppliers further complicates market dynamics, necessitating local producers to innovate and differentiate their offerings to maintain a competitive edge.
Kenya Personal Care Active Ingredients Market Trends
The market is increasingly defined by a trend towards plant-based and organic active ingredients. Consumers are seeking products that not only enhance their beauty but also contribute positively to their well-being and the environment. Innovations in formulations that target specific skin issues, such as anti-aging and hydration, are gaining popularity. Moreover, an emphasis on transparency in ingredient sourcing is reshaping brand-consumer relationships.
Kenya Personal Care Active Ingredients Market Opportunities
With the rise of eco-conscious consumerism, there are significant opportunities for investment in natural and organic active ingredients. Companies focusing on research and development to harness local botanical resources can create unique offerings tailored to Kenyan consumer preferences. Additionally, the premiumization of personal care products presents avenues for collaboration with local manufacturers to produce high-quality active ingredients that resonate with the market's evolving demands.
Government Initiatives in the Kenya Personal Care Active Ingredients Market
The Kenyan government is actively promoting local manufacturing of personal care products, emphasizing the importance of using natural ingredients. Policies encouraging research and development provide a supportive environment for innovation in the cosmetics industry. Furthermore, initiatives aimed at empowering local farmers to sustainably source natural ingredients align with global trends towards eco-friendly and ethical beauty products, thereby enhancing the market's growth potential.
Future Insights of the Kenya Personal Care Active Ingredients Market
Looking ahead to 2026-2032, the Kenya Personal Care Active Ingredients Market is poised for substantial expansion. The increasing demand for personal hygiene and grooming products, alongside the preference for natural ingredients, will continue to drive market growth. The sector's evolution, characterized by innovation and responsiveness to consumer trends, suggests that companies focusing on quality and sustainability will have significant opportunities for success. This trajectory reflects a broader global shift toward wellness-oriented and environmentally-conscious personal care solutions.
Kenya Personal Care Active Ingredients Market Latest Developments (May 2025 - June 2026)
Recent developments in the Kenya Personal Care Active Ingredients Market indicate a continued focus on natural ingredients, with several local manufacturers adapting their formulations to meet evolving consumer preferences. Additionally, the emergence of collaborations aimed at enhancing product efficacy through innovative ingredient combinations suggests a proactive approach to market demands. Sustainability remains a priority, with various brands launching initiatives focused on eco-friendly packaging and sourcing practices.
Kenya Personal Care Active Ingredients Market - Key Attractiveness of the Report
- 10 Years of Market Numbers
- Historical Data Starting from 2022 to 2025
- Base Year: 2025
- Forecast Data until 2032
- Key Performance Indicators Impacting the Market
- Major Upcoming Developments and Projects
Key Highlights of the Report:
- Kenya Personal Care Active Ingredients Market Outlook
- Market Size of Kenya Personal Care Active Ingredients Market, 2025
- Forecast of Kenya Personal Care Active Ingredients Market, 2032
- Historical Data and Forecast of Kenya Personal Care Active Ingredients Revenues & Volume for the Period 2022-2032F
- Kenya Personal Care Active Ingredients Market Trend Evolution
- Kenya Personal Care Active Ingredients Market Drivers and Challenges
- Kenya Personal Care Active Ingredients Price Trends
- Kenya Personal Care Active Ingredients Porter's Five Forces
- Kenya Personal Care Active Ingredients Industry Life Cycle
- Historical Data and Forecast of Kenya Personal Care Active Ingredients Market Revenues & Volume By Products for the Period 2022-2032F
- Historical Data and Forecast of Kenya Personal Care Active Ingredients Market Revenues & Volume By Hair Care for the Period 2022-2032F
- Historical Data and Forecast of Kenya Personal Care Active Ingredients Market Revenues & Volume By Skin Care for the Period 2022-2032F
- Historical Data and Forecast of Kenya Personal Care Active Ingredients Market Revenues & Volume By Bath and Shower for the Period 2022-2032F
- Historical Data and Forecast of Kenya Personal Care Active Ingredients Market Revenues & Volume By Oral Care for the Period 2022-2032F
- Historical Data and Forecast of Kenya Personal Care Active Ingredients Market Revenues & Volume By Men??s Grooming for the Period 2022-2032F
- Historical Data and Forecast of Kenya Personal Care Active Ingredients Market Revenues & Volume By Other Personal Care Products for the Period 2022-2032F
- Historical Data and Forecast of Kenya Personal Care Active Ingredients Market Revenues & Volume By Gender for the Period 2022-2032F
- Historical Data and Forecast of Kenya Personal Care Active Ingredients Market Revenues & Volume By Women for the Period 2022-2032F
- Historical Data and Forecast of Kenya Personal Care Active Ingredients Market Revenues & Volume By Men for the Period 2022-2032F
- Historical Data and Forecast of Kenya Personal Care Active Ingredients Market Revenues & Volume By Distribution Channel for the Period 2022-2032F
- Historical Data and Forecast of Kenya Personal Care Active Ingredients Market Revenues & Volume By Direct Selling for the Period 2022-2032F
- Historical Data and Forecast of Kenya Personal Care Active Ingredients Market Revenues & Volume By Hypermarkets and Retail Chains for the Period 2022-2032F
- Historical Data and Forecast of Kenya Personal Care Active Ingredients Market Revenues & Volume By E-Commerce for the Period 2022-2032F
- Historical Data and Forecast of Kenya Personal Care Active Ingredients Market Revenues & Volume By Specialty Stores for the Period 2022-2032F
- Historical Data and Forecast of Kenya Personal Care Active Ingredients Market Revenues & Volume By Other Distribution Channels for the Period 2022-2032F
- Kenya Personal Care Active Ingredients Import Export Trade Statistics
- Market Opportunity Assessment By Products
- Market Opportunity Assessment By Gender
- Market Opportunity Assessment By Distribution Channel
- Kenya Personal Care Active Ingredients Top Companies Market Share
- Kenya Personal Care Active Ingredients Competitive Benchmarking By Technical and Operational Parameters
- Kenya Personal Care Active Ingredients Company Profiles
- Kenya Personal Care Active Ingredients Key Strategic Recommendations
Kenya Personal Care Active Ingredients Market - Frequently Asked Questions
The growth is primarily driven by rising consumer awareness about personal grooming, a shift towards natural ingredients, and an expanding middle-class population that prioritizes quality in personal care products.
The Kenya Personal Care Active Ingredients Market was estimated at USD 281 Million in 2025 and is projected to reach USD 372 Million by 2032, growing at a CAGR of 4.1% from 2026 to 2032.
Key trends include a growing demand for plant-based and organic ingredients, increasing focus on sustainability, and innovation in formulations targeting specific skin and hair benefits.
Investors have opportunities in developing natural active ingredients sourced from local botanicals, as well as collaborating with manufacturers to create tailored products for the Kenyan consumer market.
The government promotes local manufacturing and sustainable practices through policies and incentives that support innovation and quality control within the personal care industry.
6Wresearch actively monitors the Kenya Personal Care Active Ingredients Market and publishes its comprehensive annual report, highlighting emerging trends, growth drivers, revenue analysis, and forecast outlook. Our insights help businesses to make data-backed strategic decisions with ongoing market dynamics. Our analysts track relevent industries related to the Kenya Personal Care Active Ingredients Market, allowing our clients with actionable intelligence and reliable forecasts tailored to emerging regional needs.
Yes, we provide customisation as per your requirements. To learn more, feel free to contact us on sales@6wresearch.com
1 Executive Summary |
2 Introduction |
2.1 Key Highlights of the Report |
2.2 Report Description |
2.3 Market Scope & Segmentation |
2.4 Research Methodology |
2.5 Assumptions |
3 Kenya Personal Care Active Ingredients Market Overview |
3.1 Kenya Country Macro Economic Indicators |
3.2 Kenya Personal Care Active Ingredients Market Revenues & Volume, 2022 & 2032F |
3.3 Kenya Personal Care Active Ingredients Market - Industry Life Cycle |
3.4 Kenya Personal Care Active Ingredients Market - Porter's Five Forces |
3.5 Kenya Personal Care Active Ingredients Market Revenues & Volume Share, By Products, 2022 & 2032F |
3.6 Kenya Personal Care Active Ingredients Market Revenues & Volume Share, By Gender, 2022 & 2032F |
3.7 Kenya Personal Care Active Ingredients Market Revenues & Volume Share, By Distribution Channel, 2022 & 2032F |
4 Kenya Personal Care Active Ingredients Market Dynamics |
4.1 Impact Analysis |
4.2 Market Drivers |
4.3 Market Restraints |
5 Kenya Personal Care Active Ingredients Market Trends |
6 Kenya Personal Care Active Ingredients Market, By Types |
6.1 Kenya Personal Care Active Ingredients Market, By Products |
6.1.1 Overview and Analysis |
6.1.2 Kenya Personal Care Active Ingredients Market Revenues & Volume, By Products, 2022-2032F |
6.1.3 Kenya Personal Care Active Ingredients Market Revenues & Volume, By Hair Care, 2022-2032F |
6.1.4 Kenya Personal Care Active Ingredients Market Revenues & Volume, By Skin Care, 2022-2032F |
6.1.5 Kenya Personal Care Active Ingredients Market Revenues & Volume, By Bath and Shower, 2022-2032F |
6.1.6 Kenya Personal Care Active Ingredients Market Revenues & Volume, By Oral Care, 2022-2032F |
6.1.7 Kenya Personal Care Active Ingredients Market Revenues & Volume, By Men??s Grooming, 2022-2032F |
6.1.8 Kenya Personal Care Active Ingredients Market Revenues & Volume, By Other Personal Care Products, 2022-2032F |
6.2 Kenya Personal Care Active Ingredients Market, By Gender |
6.2.1 Overview and Analysis |
6.2.2 Kenya Personal Care Active Ingredients Market Revenues & Volume, By Women, 2022-2032F |
6.2.3 Kenya Personal Care Active Ingredients Market Revenues & Volume, By Men, 2022-2032F |
6.3 Kenya Personal Care Active Ingredients Market, By Distribution Channel |
6.3.1 Overview and Analysis |
6.3.2 Kenya Personal Care Active Ingredients Market Revenues & Volume, By Direct Selling, 2022-2032F |
6.3.3 Kenya Personal Care Active Ingredients Market Revenues & Volume, By Hypermarkets and Retail Chains, 2022-2032F |
6.3.4 Kenya Personal Care Active Ingredients Market Revenues & Volume, By E-Commerce, 2022-2032F |
6.3.5 Kenya Personal Care Active Ingredients Market Revenues & Volume, By Specialty Stores, 2022-2032F |
6.3.6 Kenya Personal Care Active Ingredients Market Revenues & Volume, By Other Distribution Channels, 2022-2032F |
7 Kenya Personal Care Active Ingredients Market Import-Export Trade Statistics |
7.1 Kenya Personal Care Active Ingredients Market Export to Major Countries |
7.2 Kenya Personal Care Active Ingredients Market Imports from Major Countries |
8 Kenya Personal Care Active Ingredients Market Key Performance Indicators |
9 Kenya Personal Care Active Ingredients Market - Opportunity Assessment |
9.1 Kenya Personal Care Active Ingredients Market Opportunity Assessment, By Products, 2022 & 2032F |
9.2 Kenya Personal Care Active Ingredients Market Opportunity Assessment, By Gender, 2022 & 2032F |
9.3 Kenya Personal Care Active Ingredients Market Opportunity Assessment, By Distribution Channel, 2022 & 2032F |
10 Kenya Personal Care Active Ingredients Market - Competitive Landscape |
10.1 Kenya Personal Care Active Ingredients Market Revenue Share, By Companies, 2025 |
10.2 Kenya Personal Care Active Ingredients Market Competitive Benchmarking, By Operating and Technical Parameters |
11 Company Profiles |
12 Recommendations |
13 Disclaimer |
Global Go To Market Strategy - 2030
Export potential enables firms to identify high-growth global markets with greater confidence by combining advanced trade intelligence with a structured quantitative methodology. The framework analyzes emerging demand trends and country-level import patterns while integrating macroeconomic and trade datasets such as GDP and population forecasts, bilateral import–export flows, tariff structures, elasticity differentials between developed and developing economies, geographic distance, and import demand projections. Using weighted trade values from 2020–2024 as the base period to project country-to-country export potential for 2030, these inputs are operationalized through calculated drivers such as gravity model parameters, tariff impact factors, and projected GDP per-capita growth. Through an analysis of hidden potentials, demand hotspots, and market conditions that are most favorable to success, this method enables firms to focus on target countries, maximize returns, and global expansion with data, backed by accuracy.
By factoring in the projected importer demand gap that is currently unmet and could be potential opportunity, it identifies the potential for the Exporter (Country) among 190 countries, against the general trade analysis, which identifies the biggest importer or exporter.
To discover high-growth global markets and optimize your business strategy:
Click Here
Pricing
- Single User License$ 1,995
- Department License$ 2,400
- Site License$ 3,120
- Global License$ 3,795

Leadership Perspectives from Industry Events
Search
Thought Leadership and Analyst Meet


Our Clients
6WResearch In News
- India Air Conditioner Market Set for Strong Rebound in 2026 After Weather-Led Correction and GST-Driven Recovery: 6Wresearch
- ADAS in India: How Automatic Emergency Braking, Blind Spot Detection & Driver Monitoring are Transforming Road Safety
- Doha a strategic location for EV manufacturing hub: IPA Qatar
- Demand for luxury TVs surging in the GCC, says Samsung
- Empowering Growth: The Thriving Journey of Bangladesh’s Cable Industry
- Demand for luxury TVs surging in the GCC, says Samsung
Latest Reports
- Poland Fire Protection Systems Market (2026-2032)
- Cape Verde Portable Hand-Thrown Extinguisher Market (2026-2032)
- Canada Portable Hand-Thrown Extinguisher Market (2026-2032)
- Cameroon Portable Hand-Thrown Extinguisher Market (2026-2032)
- Burundi Portable Hand-Thrown Extinguisher Market (2026-2032)
- Burkina Faso Portable Hand-Thrown Extinguisher Market (2026-2032)
- Bulgaria Portable Hand-Thrown Extinguisher Market (2026-2032)
- Brunei Portable Hand-Thrown Extinguisher Market (2026-2032)
- Botswana Portable Hand-Thrown Extinguisher Market (2026-2032)
- Bosnia and Herzegovina Portable Hand-Thrown Extinguisher Market (2026-2032)
Industry Events and Analyst Meet

HIMTEX 2026

India Refining Summit 2026

India EV Show 2026

EV tech India Expo 2026

Auto Tech Asia 2026
Whitepaper
- Middle East & Africa Commercial Security Market Click here to view more.
- Middle East & Africa Fire Safety Systems & Equipment Market Click here to view more.
- GCC Drone Market Click here to view more.
- Middle East Lighting Fixture Market Click here to view more.
- GCC Physical & Perimeter Security Market Click here to view more.