Kenya Plastics Materials and Resins Market (2026-2032) | Companies, Outlook, Revenue, Analysis, Growth, Share, Size, Industry, Forecast, Value, Trends
Market Forecast By Type (Polypropylene (PP), High-density polyethylene (PE-HD), Polyvinyl chloride (PVC), Polyethylene terephthalate (PET)), By Applications (Chemical Industry, Coating & Printing Industry, Electronics Industry, Food & Pharmaceutical Industry, Others) And Competitive Landscape
| Product Code: ETC037531 | Publication Date: Jan 2021 | Updated Date: Jun 2026 | Product Type: Report | |
| Publisher: 6Wresearch | Author: Ravi Bhandari | No. of Pages: 70 | No. of Figures: 35 | No. of Tables: 5 |
Kenya Plastics Materials and Resins Market Summary
The kenya plastics materials and resins market was estimated at USD 273 Million in 2025 and is projected to reach USD 360 Million by 2032, growing at a CAGR of 5.0% from 2026 to 2032.
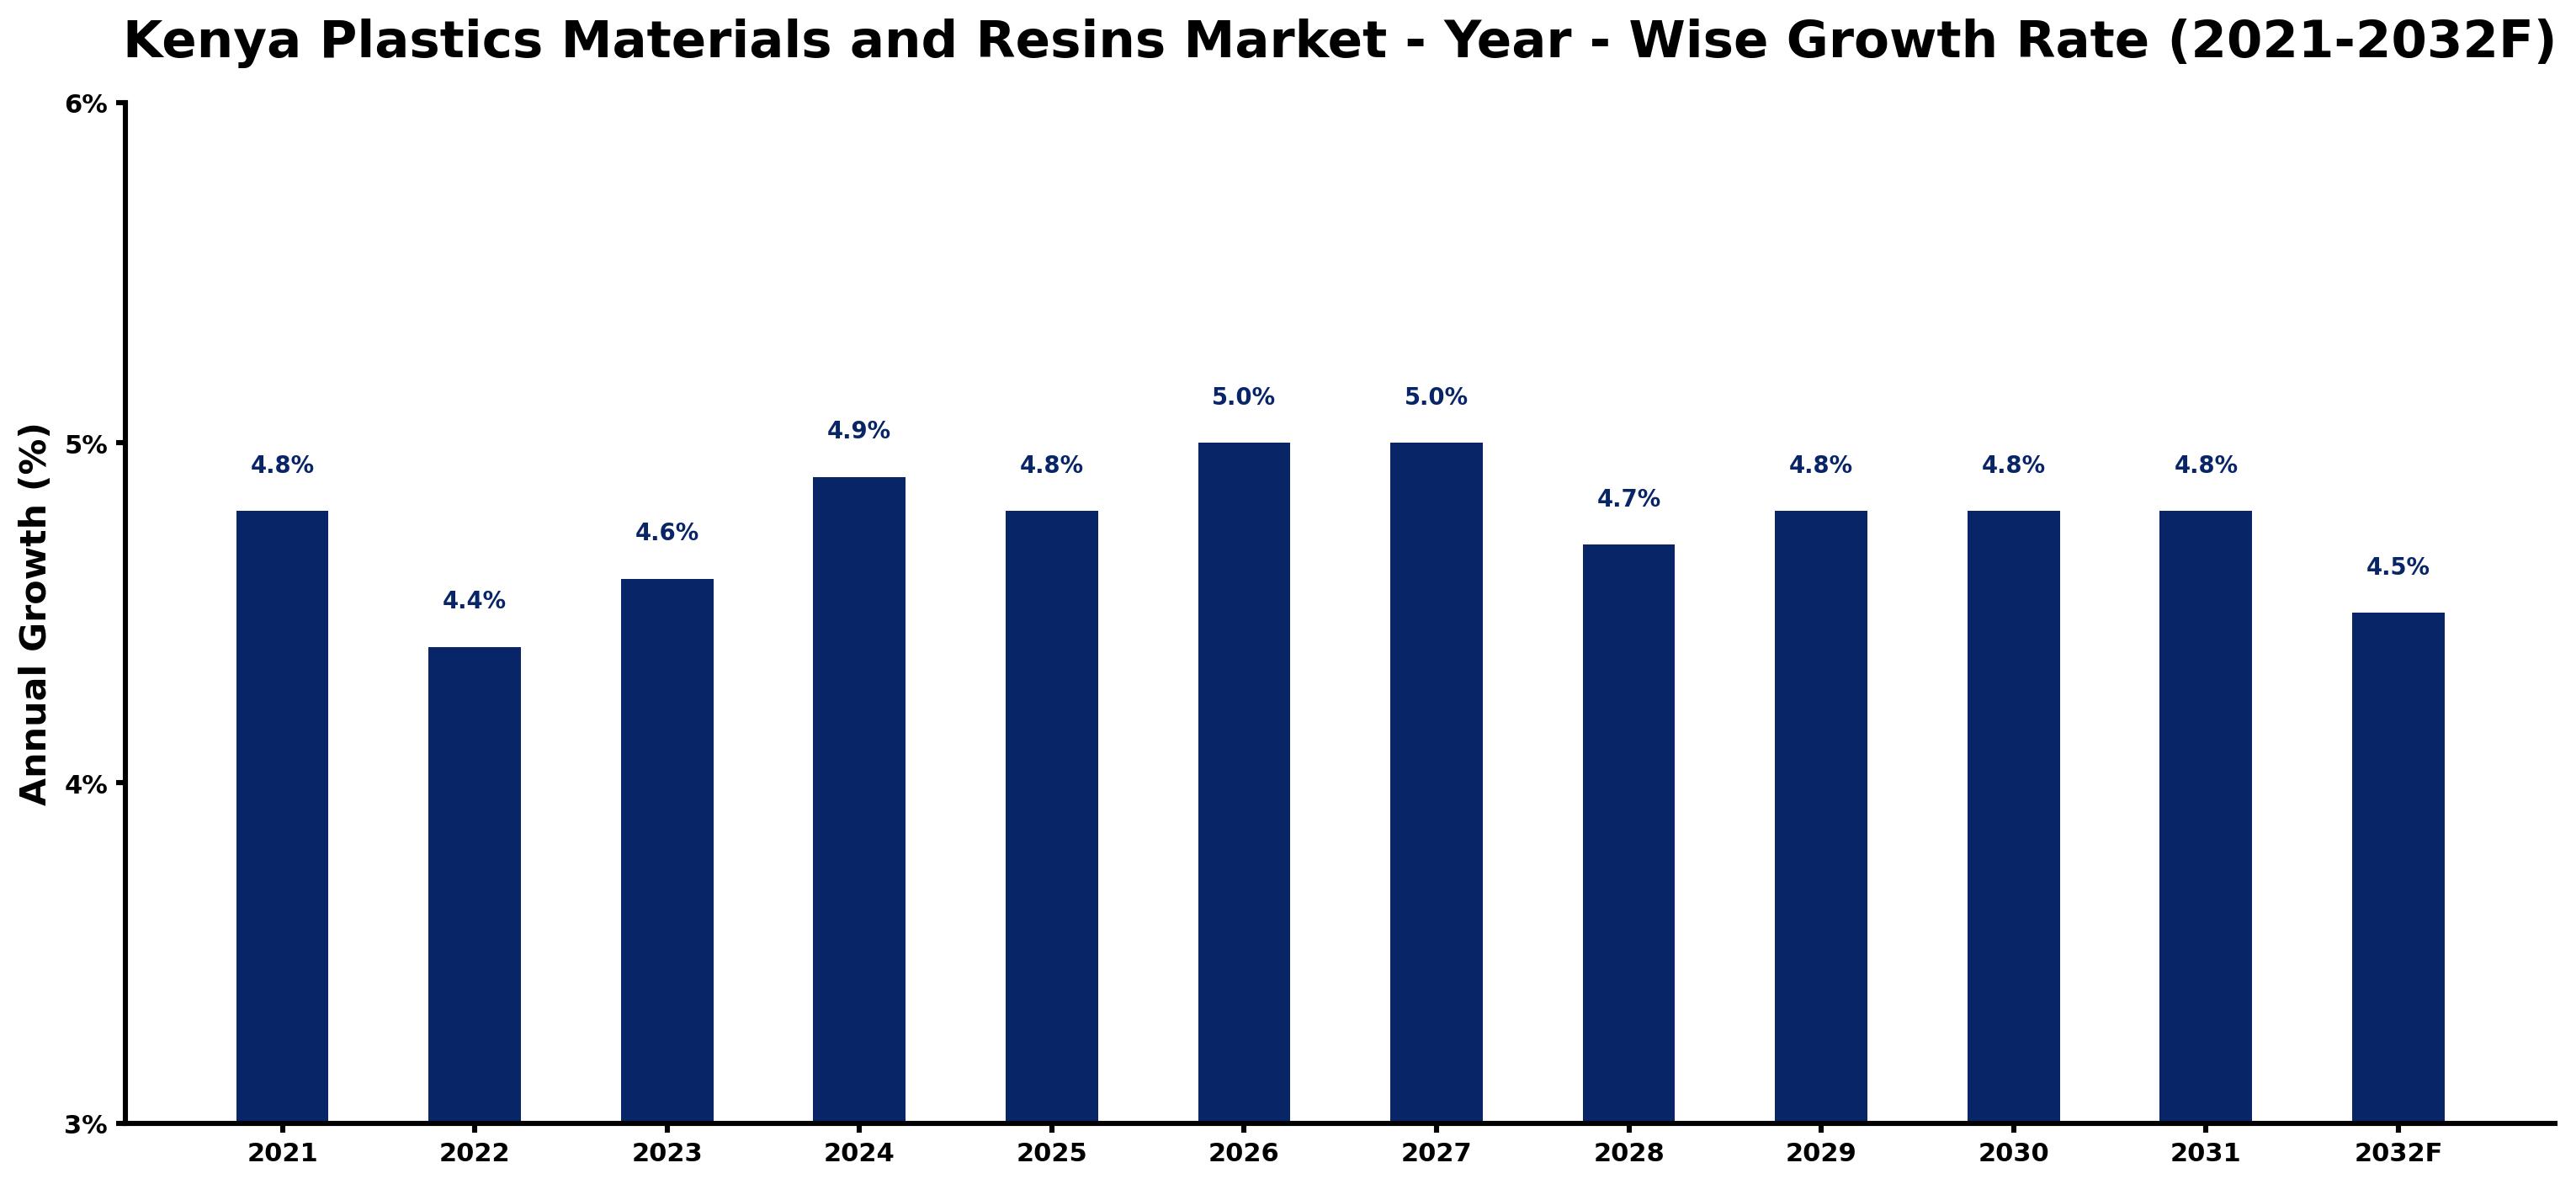
Kenya Plastics Materials and Resins Market Growth Rate Analysis (2021-2032)
The Kenya plastics materials and resins market is projected to maintain a stable growth pattern, with rates gradually increasing from 4.4% in 2022 to a peak of 5.0% in 2026. This growth can be attributed to rising consumer demand driven by urbanization and increasing infrastructure projects. Notably, the investment in renewable energy and sustainability initiatives has prompted a shift towards eco-friendly plastic alternatives, influencing market dynamics positively. However, anticipated fluctuations, such as the slight dip to 4.5% in 2032, may stem from regulatory pressures and evolving technological advancements that could challenge traditional plastic applications. Overall, the sector remains resilient, adapting to both market demands and policy changes.
Kenya Plastics Materials and Resins Market Year-wise Growth Rate and Key Drivers
This graph highlights how the Kenya Plastics Materials and Resins Market has steadily grown over the past five years, supported by major growth factors.
The table below presents the year wise growth rates along with the key drivers influencing the market
| Year | Growth Rate | Major Drivers |
| 2021 | 4.8% | Post-pandemic recovery encouraged investments in sustainable manufacturing practices throughout the country. |
| 2022 | 4.4% | Emerging technologies enhanced production efficiency, reducing costs and improving product quality. |
| 2023 | 4.6% | Increased urbanization created higher demand for packaging materials, impacting consumption patterns significantly. |
| 2024 | 4.9% | Collaboration among local firms fostered innovation, resulting in new product development and market entry. |
| 2025 | 4.8% | International companies are establishing operations, attracted by Kenya's strategic geographic positioning. |
| 2026 | 5.0% | E-commerce expansion propelled demand for lightweight, durable packaging solutions across multiple sectors. |
| 2027 | 5.0% | Educational programs focused on recycling and sustainability are influencing consumer behavior positively. |
| 2028 | 4.7% | Investment in renewable energy is lowering operational costs for plastic producers across the region. |
| 2029 | 4.8% | Technological advancements in bio-based plastics are diversifying product offerings and reducing environmental impact. |
| 2030 | 4.8% | Regulations targeting plastic waste management will shape product design and production processes significantly. |
| 2031 | 4.8% | Export opportunities to regional markets will drive production increases and foster economic growth. |
| 2032 | 4.5% | Research and development initiatives will focus on creating high-performance resins tailored for local needs. |
Note - Market size estimations and growth projections presented in this report are based on 6Wresearch's advanced forecasting approach, validated with industry datasets as of June 2026.
Kenya Plastics Materials and Resins Market Synopsis
The Kenya Plastics Materials and Resins Market is projected to reach 5.0% and witness significant growth during the forecast period (2026-2032). This expansion is primarily driven by increasing demand across diverse sectors, including packaging, automotive, and consumer goods. The market encompasses not only the production and distribution of fundamental plastic materials but also the advancement in technologies that enhance resin formulations, making them more efficient and sustainable.
Kenya Plastics Materials and Resins Market Growth Drivers
The growth of the Kenya Plastics Materials and Resins Market can be attributed to several key drivers:
- Increasing Demand: The plastics manufacturing sector is experiencing significant demand from industries such as packaging, automotive, and construction, contributing to overall market growth.
- Technological Advancements: Innovations in resin formulation and production techniques are enhancing the performance characteristics of plastic materials, making them more appealing to manufacturers.
- Diverse Applications: Plastics' versatility is leading to their adoption in new applications, expanding potential market growth areas.
- Urbanization and Economic Growth: As Kenya's economy continues to grow, urbanization drives demand for consumer goods packaged in plastics, fuelling further growth.
- Investment in Infrastructure: Government and private investments in infrastructure projects are bolstering the demand for durable plastic materials in construction applications.
Kenya Plastics Materials and Resins Market Challenges and Restraints
Despite its promising outlook, the Kenya Plastics Materials and Resins Market faces several challenges:
- High Raw Material Costs: Fluctuating prices of raw materials, exacerbated by global supply chain disruptions, can significantly increase production costs, impacting profit margins.
- Import Reliance: The market's dependency on imported raw materials leaves it vulnerable to international price volatility and supply chain risks.
- Environmental Regulations: Stricter regulations concerning plastic waste management are compelling manufacturers to innovate and adhere to sustainable practices.
- Limited Local Expertise: A deficiency in local technological expertise for advanced resin production restricts competitiveness and market growth.
- Competition from Alternatives: The rise of bioplastics and recycled plastic materials presents a competitive challenge, as manufacturers seek to meet consumer preferences for sustainable options.
Kenya Plastics Materials and Resins Market Trends and Opportunities
Emerging trends within the Kenya Plastics Materials and Resins Market indicate several opportunities:
- Shift Towards Sustainability: The growing awareness of environmental issues is steering demand towards sustainable and biodegradable plastics.
- Investment in Recycling Technologies: The implementation of advanced recycling technologies is likely to create new opportunities for manufacturers to repurpose plastic waste.
- Government Support for Local Manufacturing: Initiatives aimed at bolstering local production capabilities may foster innovation and reduce dependency on imports.
- Customization and Product Differentiation: Manufacturers are increasingly focusing on tailored products that meet specific industry requirements, enhancing market competitiveness.
- Collaboration for Research and Development: Partnerships between stakeholders in the plastics value chain can drive innovation in resin development and application.
Kenya Plastics Materials and Resins Market Government Investment and Initiatives
The Kenyan government is actively pursuing initiatives to support the plastics materials and resins market:
- Policy Frameworks: The government is implementing regulatory frameworks that aim to promote sustainable plastic use while addressing challenges related to plastic waste management.
- Public-Private Partnerships: By fostering public-private partnerships, the government encourages investments in the local manufacturing sector, helping to reduce import reliance.
- Incentives for Innovation: Financial incentives for companies investing in research and development of sustainable materials are being introduced to stimulate market creativity.
- Education and Awareness Programs: The government is initiating programs to raise awareness about the benefits of advanced plastics and their applications, targeting potential users in various industries.
- Sustainable Development Goals: The alignment of government policies with global sustainable development goals further emphasizes efforts to minimize plastic waste and promote recycling initiatives.
Kenya Plastics Materials and Resins Market Latest Developments (May 2025 - June 2026)
In recent months, the Kenya Plastics Materials and Resins Market has been characterized by notable developments that reflect its evolving landscape:
- Strengthening of Local Production: Efforts to bolster local production capabilities have intensified, with several initiatives aimed at reducing import dependency.
- Advancements in Bioplastics: A noticeable shift towards bioplastics has emerged as manufacturers seek eco-friendly alternatives in response to regulatory pressures.
- Increased Investment in Waste Management Solutions: There is a growing focus on innovative waste management solutions that enhance recycling capabilities across the industry.
- Emerging Startups: The rise of startups specializing in sustainable materials is contributing to a dynamic market landscape, fostering competition and innovation.
- Collaborative Research Initiatives: Joint research initiatives among stakeholders are leading to breakthroughs in resin technologies, aimed at improving product performance and sustainability.
Kenya Plastics Materials and Resins Market - Key Attractiveness of the Report
- 10 Years of Market Numbers
- Historical Data Starting from 2022 to 2025
- Base Year: 2025
- Forecast Data until 2032
- Key Performance Indicators Impacting the Market
- Major Upcoming Developments and Projects
Key Highlights of the Report:
- Kenya Plastics Materials and Resins Market Outlook
- Market Size of Kenya Plastics Materials and Resins Market, 2025
- Forecast of Kenya Plastics Materials and Resins Market, 2032
- Historical Data and Forecast of Kenya Plastics Materials and Resins Revenues & Volume for the Period 2022-2032F
- Kenya Plastics Materials and Resins Market Trend Evolution
- Kenya Plastics Materials and Resins Market Drivers and Challenges
- Kenya Plastics Materials and Resins Price Trends
- Kenya Plastics Materials and Resins Porter's Five Forces
- Kenya Plastics Materials and Resins Industry Life Cycle
- Historical Data and Forecast of Kenya Plastics Materials and Resins Market Revenues & Volume By Type for the Period 2022-2032F
- Historical Data and Forecast of Kenya Plastics Materials and Resins Market Revenues & Volume By Polypropylene (PP) for the Period 2022-2032F
- Historical Data and Forecast of Kenya Plastics Materials and Resins Market Revenues & Volume By High-density polyethylene (PE-HD) for the Period 2022-2032F
- Historical Data and Forecast of Kenya Plastics Materials and Resins Market Revenues & Volume By Polyvinyl chloride (PVC) for the Period 2022-2032F
- Historical Data and Forecast of Kenya Plastics Materials and Resins Market Revenues & Volume By Polyethylene terephthalate (PET) for the Period 2022-2032F
- Historical Data and Forecast of Kenya Plastics Materials and Resins Market Revenues & Volume By Applications for the Period 2022-2032F
- Historical Data and Forecast of Kenya Plastics Materials and Resins Market Revenues & Volume By Chemical Industry for the Period 2022-2032F
- Historical Data and Forecast of Kenya Plastics Materials and Resins Market Revenues & Volume By Coating & Printing Industry for the Period 2022-2032F
- Historical Data and Forecast of Kenya Plastics Materials and Resins Market Revenues & Volume By Electronics Industry for the Period 2022-2032F
- Historical Data and Forecast of Kenya Plastics Materials and Resins Market Revenues & Volume By Food & Pharmaceutical Industry for the Period 2022-2032F
- Historical Data and Forecast of Kenya Plastics Materials and Resins Market Revenues & Volume By Others for the Period 2022-2032F
- Kenya Plastics Materials and Resins Import Export Trade Statistics
- Market Opportunity Assessment By Type
- Market Opportunity Assessment By Applications
- Kenya Plastics Materials and Resins Top Companies Market Share
- Kenya Plastics Materials and Resins Competitive Benchmarking By Technical and Operational Parameters
- Kenya Plastics Materials and Resins Company Profiles
- Kenya Plastics Materials and Resins Key Strategic Recommendations
Frequently Asked Questions About the Market Study (FAQs):
The growth is primarily driven by increasing demand from various industries, advancements in technology, and the widespread application of plastics in numerous sectors.
Challenges include high raw material costs, reliance on imports, environmental regulations, and competition from alternative materials.
The government supports the market through policy frameworks, public-private partnerships, incentives for innovation, and educational programs aimed at promoting sustainable practices.
Future trends include a shift towards sustainability, increased investment in recycling technologies, and a growing emphasis on customization and differentiation in plastic products.
6Wresearch actively monitors the Kenya Plastics Materials and Resins Market and publishes its comprehensive annual report, highlighting emerging trends, growth drivers, revenue analysis, and forecast outlook. Our insights help businesses to make data-backed strategic decisions with ongoing market dynamics. Our analysts track relevent industries related to the Kenya Plastics Materials and Resins Market, allowing our clients with actionable intelligence and reliable forecasts tailored to emerging regional needs.
Yes, we provide customisation as per your requirements. To learn more, feel free to contact us on sales@6wresearch.com
1 Executive Summary |
2 Introduction |
2.1 Key Highlights of the Report |
2.2 Report Description |
2.3 Market Scope & Segmentation |
2.4 Research Methodology |
2.5 Assumptions |
3 Kenya Plastics Materials and Resins Market Overview |
3.1 Kenya Country Macro Economic Indicators |
3.2 Kenya Plastics Materials and Resins Market Revenues & Volume, 2022 & 2032F |
3.3 Kenya Plastics Materials and Resins Market - Industry Life Cycle |
3.4 Kenya Plastics Materials and Resins Market - Porter's Five Forces |
3.5 Kenya Plastics Materials and Resins Market Revenues & Volume Share, By Type, 2022 & 2032F |
3.6 Kenya Plastics Materials and Resins Market Revenues & Volume Share, By Applications, 2022 & 2032F |
4 Kenya Plastics Materials and Resins Market Dynamics |
4.1 Impact Analysis |
4.2 Market Drivers |
4.3 Market Restraints |
5 Kenya Plastics Materials and Resins Market Trends |
6 Kenya Plastics Materials and Resins Market, By Types |
6.1 Kenya Plastics Materials and Resins Market, By Type |
6.1.1 Overview and Analysis |
6.1.2 Kenya Plastics Materials and Resins Market Revenues & Volume, By Type, 2022-2032F |
6.1.3 Kenya Plastics Materials and Resins Market Revenues & Volume, By Polypropylene (PP), 2022-2032F |
6.1.4 Kenya Plastics Materials and Resins Market Revenues & Volume, By High-density polyethylene (PE-HD), 2022-2032F |
6.1.5 Kenya Plastics Materials and Resins Market Revenues & Volume, By Polyvinyl chloride (PVC), 2022-2032F |
6.1.6 Kenya Plastics Materials and Resins Market Revenues & Volume, By Polyethylene terephthalate (PET), 2022-2032F |
6.2 Kenya Plastics Materials and Resins Market, By Applications |
6.2.1 Overview and Analysis |
6.2.2 Kenya Plastics Materials and Resins Market Revenues & Volume, By Chemical Industry, 2022-2032F |
6.2.3 Kenya Plastics Materials and Resins Market Revenues & Volume, By Coating & Printing Industry, 2022-2032F |
6.2.4 Kenya Plastics Materials and Resins Market Revenues & Volume, By Electronics Industry, 2022-2032F |
6.2.5 Kenya Plastics Materials and Resins Market Revenues & Volume, By Food & Pharmaceutical Industry, 2022-2032F |
6.2.6 Kenya Plastics Materials and Resins Market Revenues & Volume, By Others, 2022-2032F |
7 Kenya Plastics Materials and Resins Market Import-Export Trade Statistics |
7.1 Kenya Plastics Materials and Resins Market Export to Major Countries |
7.2 Kenya Plastics Materials and Resins Market Imports from Major Countries |
8 Kenya Plastics Materials and Resins Market Key Performance Indicators |
9 Kenya Plastics Materials and Resins Market - Opportunity Assessment |
9.1 Kenya Plastics Materials and Resins Market Opportunity Assessment, By Type, 2022 & 2032F |
9.2 Kenya Plastics Materials and Resins Market Opportunity Assessment, By Applications, 2022 & 2032F |
10 Kenya Plastics Materials and Resins Market - Competitive Landscape |
10.1 Kenya Plastics Materials and Resins Market Revenue Share, By Companies, 2025 |
10.2 Kenya Plastics Materials and Resins Market Competitive Benchmarking, By Operating and Technical Parameters |
11 Company Profiles |
12 Recommendations |
13 Disclaimer |
Global Go To Market Strategy - 2030
Export potential enables firms to identify high-growth global markets with greater confidence by combining advanced trade intelligence with a structured quantitative methodology. The framework analyzes emerging demand trends and country-level import patterns while integrating macroeconomic and trade datasets such as GDP and population forecasts, bilateral import–export flows, tariff structures, elasticity differentials between developed and developing economies, geographic distance, and import demand projections. Using weighted trade values from 2020–2024 as the base period to project country-to-country export potential for 2030, these inputs are operationalized through calculated drivers such as gravity model parameters, tariff impact factors, and projected GDP per-capita growth. Through an analysis of hidden potentials, demand hotspots, and market conditions that are most favorable to success, this method enables firms to focus on target countries, maximize returns, and global expansion with data, backed by accuracy.
By factoring in the projected importer demand gap that is currently unmet and could be potential opportunity, it identifies the potential for the Exporter (Country) among 190 countries, against the general trade analysis, which identifies the biggest importer or exporter.
To discover high-growth global markets and optimize your business strategy:
Click Here
Pricing
- Single User License$ 1,995
- Department License$ 2,400
- Site License$ 3,120
- Global License$ 3,795

Leadership Perspectives from Industry Events
Search
Thought Leadership and Analyst Meet


Our Clients
6WResearch In News
- India Air Conditioner Market Set for Strong Rebound in 2026 After Weather-Led Correction and GST-Driven Recovery: 6Wresearch
- ADAS in India: How Automatic Emergency Braking, Blind Spot Detection & Driver Monitoring are Transforming Road Safety
- Doha a strategic location for EV manufacturing hub: IPA Qatar
- Demand for luxury TVs surging in the GCC, says Samsung
- Empowering Growth: The Thriving Journey of Bangladesh’s Cable Industry
- Demand for luxury TVs surging in the GCC, says Samsung
Latest Reports
- Nicaragua RPG Gaming Market (2026-2032)
- New Zealand RPG Gaming Market (2026-2032)
- Netherlands RPG Gaming Market (2026-2032)
- Nauru RPG Gaming Market (2026-2032)
- Namibia RPG Gaming Market (2026-2032)
- Mozambique RPG Gaming Market (2026-2032)
- Montenegro RPG Gaming Market (2026-2032)
- Mongolia RPG Gaming Market (2026-2032)
- Monaco RPG Gaming Market (2026-2032)
- Micronesia RPG Gaming Market (2026-2032)
Industry Events and Analyst Meet

HIMTEX 2026

India Refining Summit 2026

India EV Show 2026

EV tech India Expo 2026

Auto Tech Asia 2026
Whitepaper
- Middle East & Africa Commercial Security Market Click here to view more.
- Middle East & Africa Fire Safety Systems & Equipment Market Click here to view more.
- GCC Drone Market Click here to view more.
- Middle East Lighting Fixture Market Click here to view more.
- GCC Physical & Perimeter Security Market Click here to view more.