Kenya Polymer Binders Market Outlook | Forecast, Revenue, Size, Share, Companies, Industry, Growth, Analysis, Trends, Value & COVID-19 IMPACT
Market Forecast By Type (Acrylic, Vinyl Acetate, Latex), By Form (Liquid, Powder, High Solids), By Applications (Architectural Coatings, Adhesives and Sealants, Textile and Carpets, Paper and Board, Construction Additives) And Competitive Landscape
| Product Code: ETC105369 | Publication Date: Jun 2021 | Updated Date: Apr 2025 | Product Type: Report | |
| Publisher: 6Wresearch | Author: Ravi Bhandari | No. of Pages: 70 | No. of Figures: 35 | No. of Tables: 5 |
Kenya Polymer Binders Market Size Growth Rate
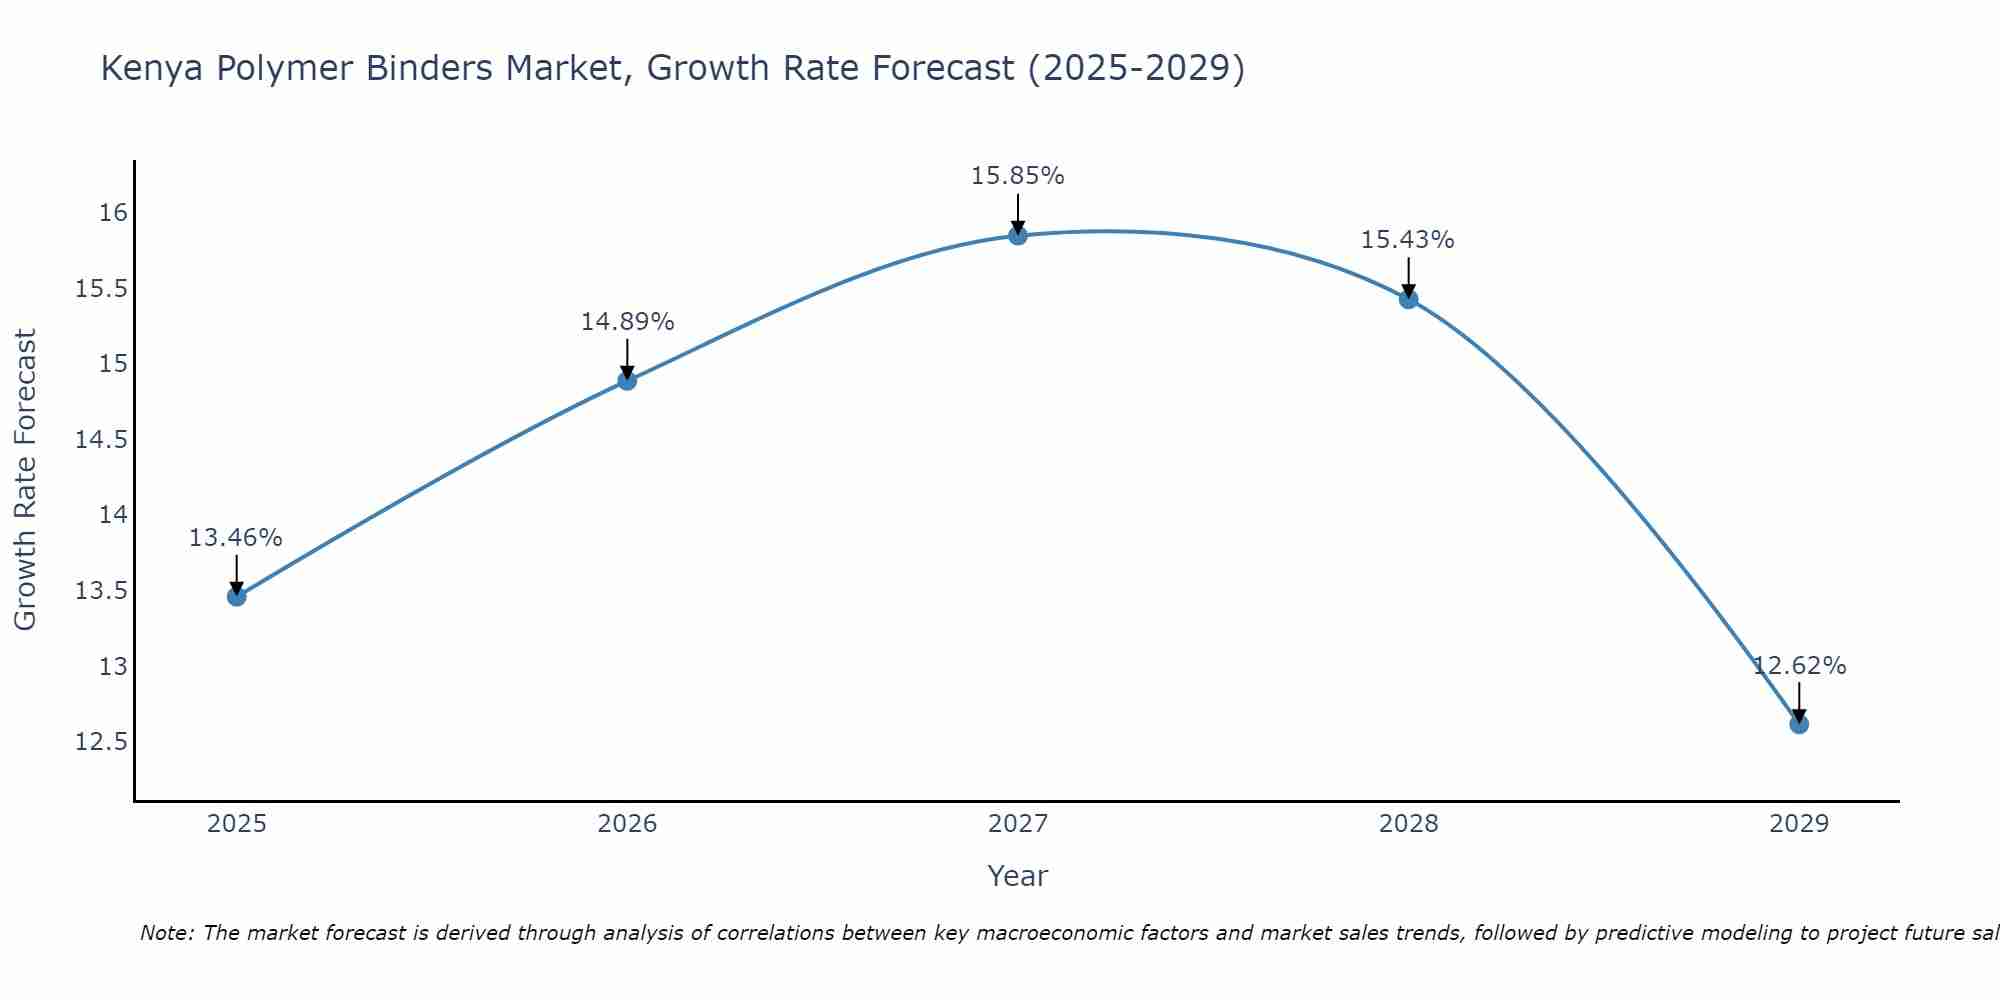
The Kenya Polymer Binders Market is projected to witness mixed growth rate patterns during 2025 to 2029. Starting at 13.46% in 2025, the market peaks at 15.85% in 2027, and settles at 12.62% by 2029.
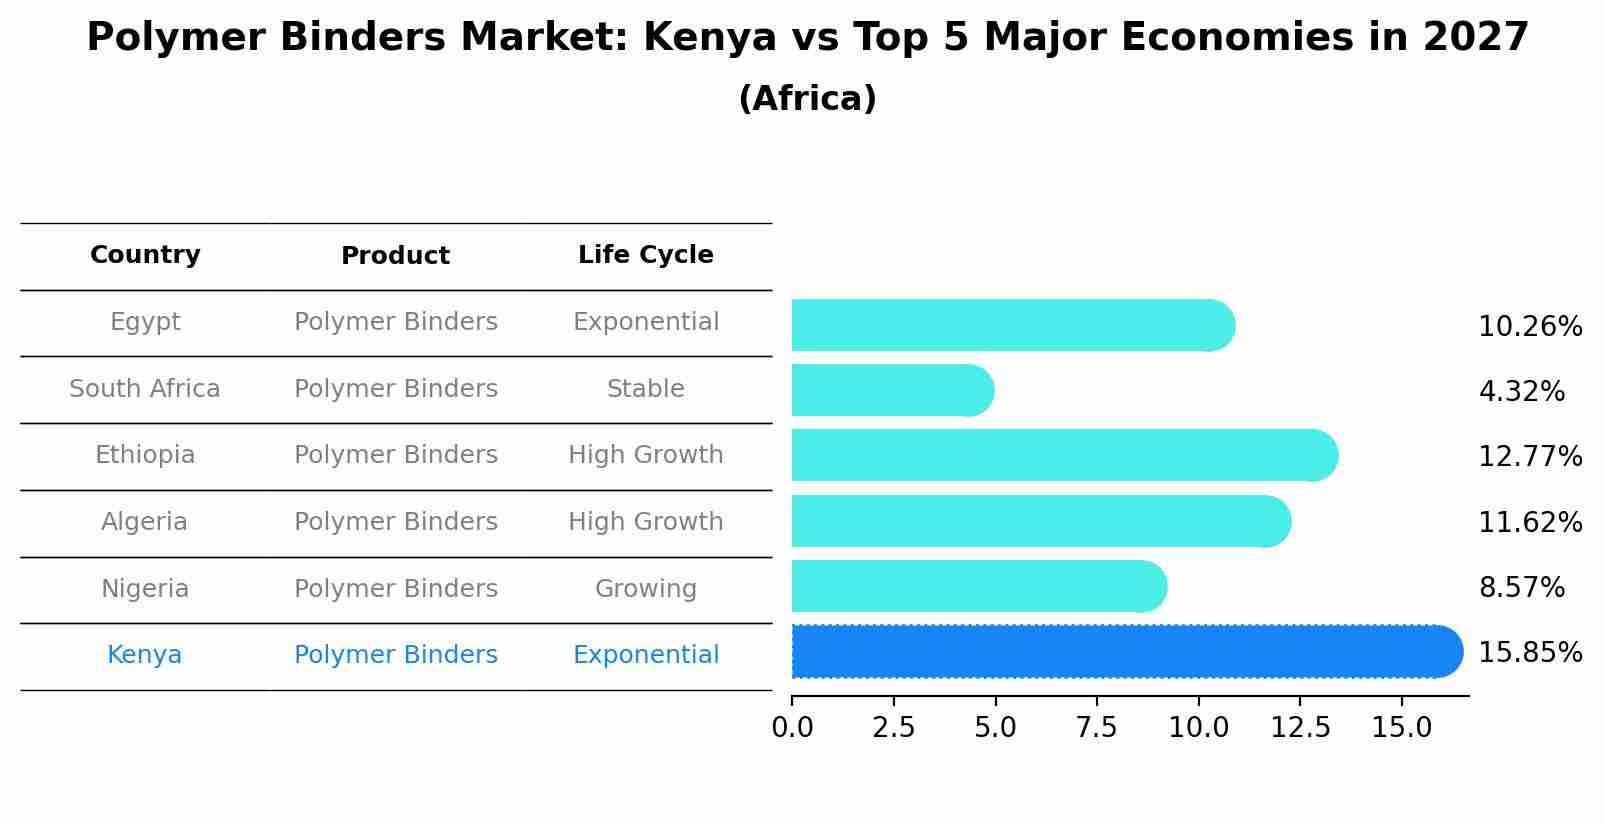
Polymer Binders Market: Kenya vs Top 5 Major Economies in 2027 (Africa)
In the Africa region, the Polymer Binders market in Kenya is projected to expand at a exponential growth rate of 15.85% by 2027. The largest economy is Egypt, followed by South Africa, Ethiopia, Algeria and Nigeria.
Kenya Polymer Binders Market Overview
The Polymer Binders Market in Kenya is expanding due to its use in paints, coatings, and construction materials. Polymer binders enhance the performance of products by improving adhesion, durability, and resistance to environmental factors. The market growth is driven by the construction industry`s demand for high-quality building materials and the paint industry`s need for durable coatings.
Drivers of the market
The polymer binders market in Kenya is driven by the construction, paints and coatings, and adhesives industries` demand for binders that impart strength, durability, and adhesion properties to various substrates. Market growth is influenced by factors such as infrastructure development projects, urbanization, and the growing construction activities in residential, commercial, and industrial sectors.
Challenges of the market
Kenya polymer binders market deals with high production costs and reliance on imported raw materials and technology. Environmental regulations and sustainability concerns necessitate continuous innovation and investment in eco-friendly production methods. The market also faces competition from alternative binders and raw materials that may offer better performance or cost advantages. Additionally, there is limited local expertise and technical knowledge in the production and application of polymer binders, impacting product quality and market growth.
Government Policy of the market
The polymer binders market in Kenya faces several challenges. High production costs, driven by raw material prices and energy expenses, impact the overall competitiveness of polymer binder products. Additionally, limited availability of specialized equipment and technical expertise for binder production poses a challenge for market players. Fluctuating demand from end-use industries such as construction, paints, and adhesives further adds to market volatility. Moreover, environmental concerns regarding binder emissions and waste management present compliance challenges for manufacturers.
Key Highlights of the Report:
- Kenya Polymer Binders Market Outlook
- Market Size of Kenya Polymer Binders Market, 2020
- Forecast of Kenya Polymer Binders Market, 2027
- Historical Data and Forecast of Kenya Polymer Binders Revenues & Volume for the Period 2018 - 2027
- Kenya Polymer Binders Market Trend Evolution
- Kenya Polymer Binders Market Drivers and Challenges
- Kenya Polymer Binders Price Trends
- Kenya Polymer Binders Porter's Five Forces
- Kenya Polymer Binders Industry Life Cycle
- Historical Data and Forecast of Kenya Polymer Binders Market Revenues & Volume By Type for the Period 2018 - 2027
- Historical Data and Forecast of Kenya Polymer Binders Market Revenues & Volume By Acrylic for the Period 2018 - 2027
- Historical Data and Forecast of Kenya Polymer Binders Market Revenues & Volume By Vinyl Acetate for the Period 2018 - 2027
- Historical Data and Forecast of Kenya Polymer Binders Market Revenues & Volume By Latex for the Period 2018 - 2027
- Historical Data and Forecast of Kenya Polymer Binders Market Revenues & Volume By Form for the Period 2018 - 2027
- Historical Data and Forecast of Kenya Polymer Binders Market Revenues & Volume By Liquid for the Period 2018 - 2027
- Historical Data and Forecast of Kenya Polymer Binders Market Revenues & Volume By Powder for the Period 2018 - 2027
- Historical Data and Forecast of Kenya Polymer Binders Market Revenues & Volume By High Solids for the Period 2018 - 2027
- Historical Data and Forecast of Kenya Polymer Binders Market Revenues & Volume By Applications for the Period 2018 - 2027
- Historical Data and Forecast of Kenya Polymer Binders Market Revenues & Volume By Architectural Coatings for the Period 2018 - 2027
- Historical Data and Forecast of Kenya Polymer Binders Market Revenues & Volume By Adhesives and Sealants for the Period 2018 - 2027
- Historical Data and Forecast of Kenya Polymer Binders Market Revenues & Volume By Textile and Carpets for the Period 2018 - 2027
- Historical Data and Forecast of Kenya Polymer Binders Market Revenues & Volume By Paper and Board for the Period 2018 - 2027
- Historical Data and Forecast of Kenya Polymer Binders Market Revenues & Volume By Construction Additives for the Period 2018 - 2027
- Kenya Polymer Binders Import Export Trade Statistics
- Market Opportunity Assessment By Type
- Market Opportunity Assessment By Form
- Market Opportunity Assessment By Applications
- Kenya Polymer Binders Top Companies Market Share
- Kenya Polymer Binders Competitive Benchmarking By Technical and Operational Parameters
- Kenya Polymer Binders Company Profiles
- Kenya Polymer Binders Key Strategic Recommendations
Frequently Asked Questions About the Market Study (FAQs):
6Wresearch actively monitors the Kenya Polymer Binders Market and publishes its comprehensive annual report, highlighting emerging trends, growth drivers, revenue analysis, and forecast outlook. Our insights help businesses to make data-backed strategic decisions with ongoing market dynamics. Our analysts track relevent industries related to the Kenya Polymer Binders Market, allowing our clients with actionable intelligence and reliable forecasts tailored to emerging regional needs.
Yes, we provide customisation as per your requirements. To learn more, feel free to contact us on sales@6wresearch.com
1 Executive Summary |
2 Introduction |
2.1 Key Highlights of the Report |
2.2 Report Description |
2.3 Market Scope & Segmentation |
2.4 Research Methodology |
2.5 Assumptions |
3 Kenya Polymer Binders Market Overview |
3.1 Kenya Country Macro Economic Indicators |
3.2 Kenya Polymer Binders Market Revenues & Volume, 2020 & 2027F |
3.3 Kenya Polymer Binders Market - Industry Life Cycle |
3.4 Kenya Polymer Binders Market - Porter's Five Forces |
3.5 Kenya Polymer Binders Market Revenues & Volume Share, By Type, 2020 & 2027F |
3.6 Kenya Polymer Binders Market Revenues & Volume Share, By Form, 2020 & 2027F |
3.7 Kenya Polymer Binders Market Revenues & Volume Share, By Applications, 2020 & 2027F |
4 Kenya Polymer Binders Market Dynamics |
4.1 Impact Analysis |
4.2 Market Drivers |
4.3 Market Restraints |
5 Kenya Polymer Binders Market Trends |
6 Kenya Polymer Binders Market, By Types |
6.1 Kenya Polymer Binders Market, By Type |
6.1.1 Overview and Analysis |
6.1.2 Kenya Polymer Binders Market Revenues & Volume, By Type, 2018 - 2027F |
6.1.3 Kenya Polymer Binders Market Revenues & Volume, By Acrylic, 2018 - 2027F |
6.1.4 Kenya Polymer Binders Market Revenues & Volume, By Vinyl Acetate, 2018 - 2027F |
6.1.5 Kenya Polymer Binders Market Revenues & Volume, By Latex, 2018 - 2027F |
6.2 Kenya Polymer Binders Market, By Form |
6.2.1 Overview and Analysis |
6.2.2 Kenya Polymer Binders Market Revenues & Volume, By Liquid, 2018 - 2027F |
6.2.3 Kenya Polymer Binders Market Revenues & Volume, By Powder, 2018 - 2027F |
6.2.4 Kenya Polymer Binders Market Revenues & Volume, By High Solids, 2018 - 2027F |
6.3 Kenya Polymer Binders Market, By Applications |
6.3.1 Overview and Analysis |
6.3.2 Kenya Polymer Binders Market Revenues & Volume, By Architectural Coatings, 2018 - 2027F |
6.3.3 Kenya Polymer Binders Market Revenues & Volume, By Adhesives and Sealants, 2018 - 2027F |
6.3.4 Kenya Polymer Binders Market Revenues & Volume, By Textile and Carpets, 2018 - 2027F |
6.3.5 Kenya Polymer Binders Market Revenues & Volume, By Paper and Board, 2018 - 2027F |
6.3.6 Kenya Polymer Binders Market Revenues & Volume, By Construction Additives, 2018 - 2027F |
7 Kenya Polymer Binders Market Import-Export Trade Statistics |
7.1 Kenya Polymer Binders Market Export to Major Countries |
7.2 Kenya Polymer Binders Market Imports from Major Countries |
8 Kenya Polymer Binders Market Key Performance Indicators |
9 Kenya Polymer Binders Market - Opportunity Assessment |
9.1 Kenya Polymer Binders Market Opportunity Assessment, By Type, 2020 & 2027F |
9.2 Kenya Polymer Binders Market Opportunity Assessment, By Form, 2020 & 2027F |
9.3 Kenya Polymer Binders Market Opportunity Assessment, By Applications, 2020 & 2027F |
10 Kenya Polymer Binders Market - Competitive Landscape |
10.1 Kenya Polymer Binders Market Revenue Share, By Companies, 2020 |
10.2 Kenya Polymer Binders Market Competitive Benchmarking, By Operating and Technical Parameters |
11 Company Profiles |
12 Recommendations |
13 Disclaimer |
Global Go To Market Strategy - 2030
Export potential enables firms to identify high-growth global markets with greater confidence by combining advanced trade intelligence with a structured quantitative methodology. The framework analyzes emerging demand trends and country-level import patterns while integrating macroeconomic and trade datasets such as GDP and population forecasts, bilateral import–export flows, tariff structures, elasticity differentials between developed and developing economies, geographic distance, and import demand projections. Using weighted trade values from 2020–2024 as the base period to project country-to-country export potential for 2030, these inputs are operationalized through calculated drivers such as gravity model parameters, tariff impact factors, and projected GDP per-capita growth. Through an analysis of hidden potentials, demand hotspots, and market conditions that are most favorable to success, this method enables firms to focus on target countries, maximize returns, and global expansion with data, backed by accuracy.
By factoring in the projected importer demand gap that is currently unmet and could be potential opportunity, it identifies the potential for the Exporter (Country) among 190 countries, against the general trade analysis, which identifies the biggest importer or exporter.
To discover high-growth global markets and optimize your business strategy:
Click Here
Pricing
- Single User License$ 1,995
- Department License$ 2,400
- Site License$ 3,120
- Global License$ 3,795

Leadership Perspectives from Industry Events
Search
Thought Leadership and Analyst Meet


Our Clients
6WResearch In News
- Doha a strategic location for EV manufacturing hub: IPA Qatar
- Demand for luxury TVs surging in the GCC, says Samsung
- Empowering Growth: The Thriving Journey of Bangladesh’s Cable Industry
- Demand for luxury TVs surging in the GCC, says Samsung
- Video call with a traditional healer? Once unthinkable, it’s now common in South Africa
- Intelligent Buildings To Smooth GCC’s Path To Net Zero
Latest Reports
- Taiwan Airport Wireless Infrastructure Market (2026-2032)
- Vietnam Airport Wireless Infrastructure Market (2026-2032)
- Thailand Airport Wireless Infrastructure Market (2026-2032)
- South Korea Airport Wireless Infrastructure Market (2026-2032)
- Romania Airport Wireless Infrastructure Market (2026-2032)
- Qatar Airport Wireless Infrastructure Market (2026-2032)
- Philippines Airport Wireless Infrastructure Market (2026-2032)
- Japan Airport Wireless Infrastructure Market (2026-2032)
- Taiwan Airport Winter Services Market (2026-2032)
- Vietnam Airport Winter Services Market (2026-2032)
Industry Events and Analyst Meet

HIMTEX 2026

India Refining Summit 2026

India EV Show 2026

EV tech India Expo 2026

Auto Tech Asia 2026
Whitepaper
- Middle East & Africa Commercial Security Market Click here to view more.
- Middle East & Africa Fire Safety Systems & Equipment Market Click here to view more.
- GCC Drone Market Click here to view more.
- Middle East Lighting Fixture Market Click here to view more.
- GCC Physical & Perimeter Security Market Click here to view more.