Kenya Power Bank Market (2026-2032) | Revenue, Industry, Share, Growth, Forecast, Analysis, Companies, Trends, Outlook, Value & Size
Market Forecast By Capacity Range (Up to 3,000 mAh, 3,001 mAh-8,000 mAh, 8,001 mAh-20,000 mAh, Above 20,000 mAh), By Energy Source (Electric, Solar), By Battery Type (Lithium-ion, Lithium Polymer), By Distribution Channel (E-commerce, Brick and Mortar) And Competitive Landscape
| Product Code: ETC012190 | Publication Date: Oct 2020 | Updated Date: Jun 2026 | Product Type: Report | |
| Publisher: 6Wresearch | Author: Ravi Bhandari | No. of Pages: 70 | No. of Figures: 35 | No. of Tables: 5 |
Kenya Power Bank Market Summary
The kenya power bank market was estimated at USD 467 Million in 2025 and is projected to reach USD 624 Million by 2032, growing at a CAGR of 5.2% from 2026 to 2032.
Kenya Power Bank Market Growth Rate Analysis (2021-2032)
The Kenya Power Bank market has shown a stable growth trend over the years, with annual growth rates fluctuating between 4.7% and 5.2%. Notably, the market experienced a notable growth of 5.2% in 2022, driven by heightened consumer demand for portable energy solutions amid the country's increasing reliance on digital devices. Investments in local manufacturing and energy infrastructure have further fueled this expansion. However, projections indicate a slight decrease to 4.7% in 2028, attributed to market saturation and intensified competition. As the energy transition continues to evolve, the market is anticipated to rebound, with growth intensifying to 5.2% in 2031, bolstered by advancements in battery technology and increased adoption of renewable energy sources.
Kenya Power Bank Market Year-wise Growth Rate and Key Drivers
This graph highlights how the Kenya Power Bank Market has steadily grown over the past five years, supported by major growth factors.
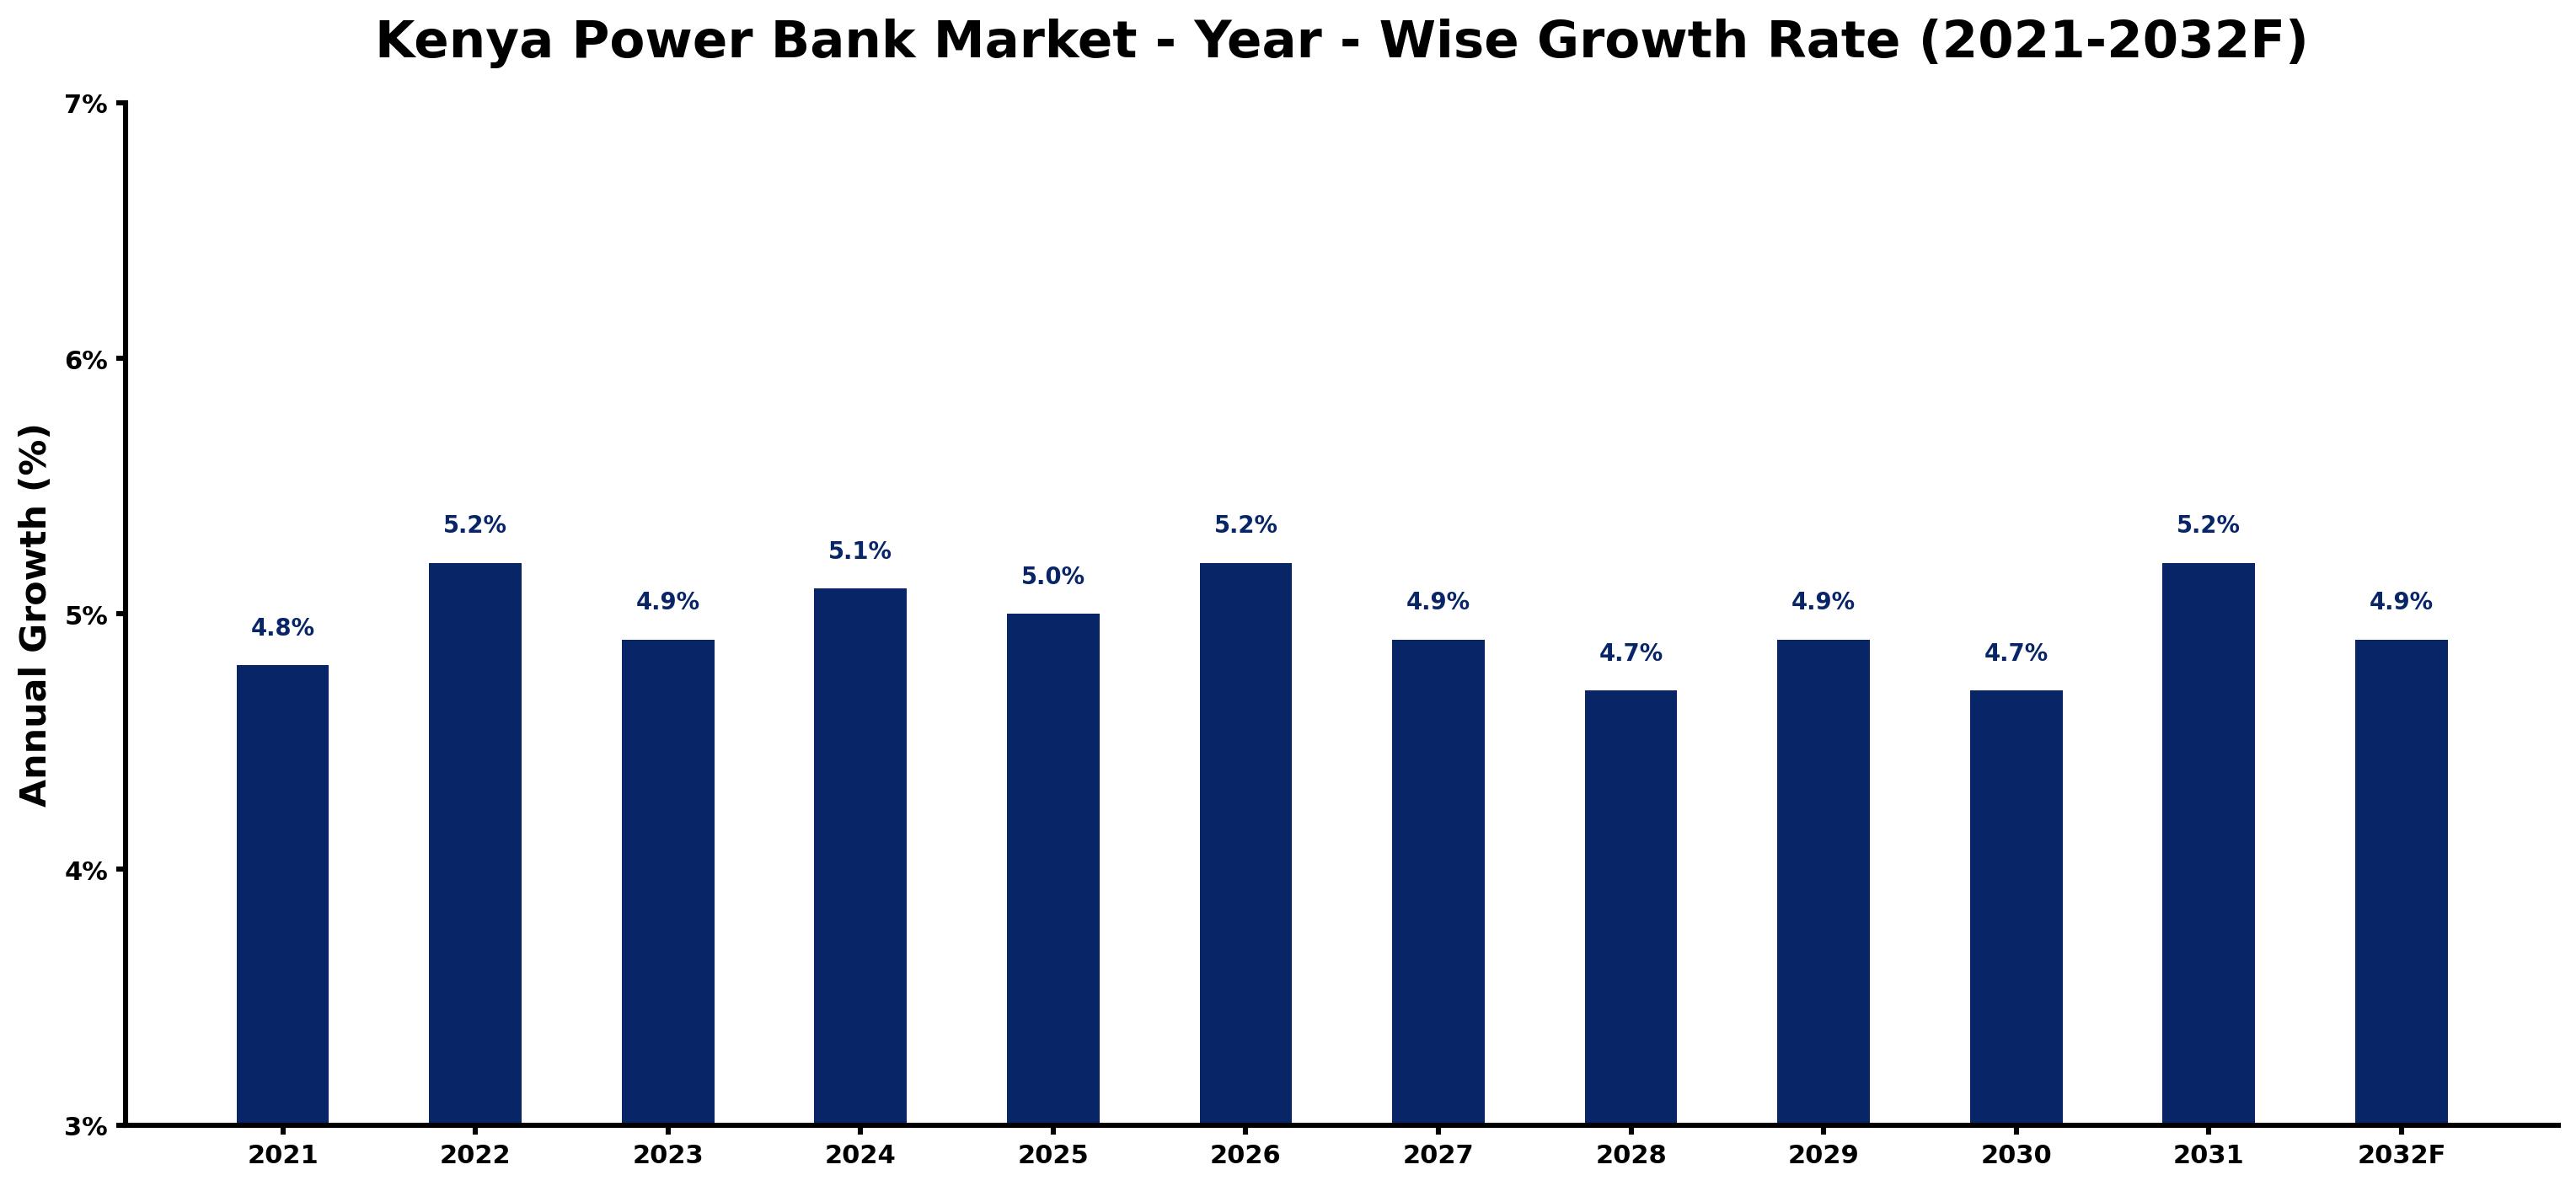
The table below presents the year wise growth rates along with the key drivers influencing the market
| Year | Growth Rate | Major Drivers |
| 2021 | 4.8% | The demand for portable energy solutions surged due to remote and outdoor activities. |
| 2022 | 5.2% | Increased smartphone penetration heightened the need for reliable power bank options. |
| 2023 | 4.9% | Urbanization trends expanded the number of users reliant on mobile devices daily. |
| 2024 | 5.1% | Corporate partnerships with tech firms boosted power bank accessibility in retail spaces. |
| 2025 | 5.0% | Consumer preferences shifted towards eco-friendly power banks amid sustainability consciousness. |
| 2026 | 5.2% | Integration of solar technology in power banks appealed to environmentally aware buyers. |
| 2027 | 4.9% | Technological advancements in battery efficiency improved product longevity and reliability. |
| 2028 | 4.7% | Rising disposable income enabled a broader consumer base to invest in power banks. |
| 2029 | 4.9% | Growth in local entrepreneurship led to diverse, innovative power bank offerings. |
| 2030 | 4.7% | E-commerce expansion streamlined access to various power bank brands and models. |
| 2031 | 5.2% | Digital nomadism fueled demand for portable charging solutions in remote workspaces. |
| 2032 | 4.9% | Brand loyalty and community engagement increased, driving repeat purchases among consumers. |
Note - Market size estimations and growth projections presented in this report are based on 6Wresearch's advanced forecasting approach, validated with industry datasets as of June 2026.
Kenya Power Bank Market Synopsis
The Kenya Power Bank Market is projected to reach 5.2% and witness significant growth during the forecast period (2026-2032). This expansion is largely fueled by the increasing reliance on portable electronic devices within the region. Power banks serve as essential charging solutions for a multitude of gadgets, including smartphones and tablets, catering to a growing consumer base that values convenience and reliability in their power sources.
Kenya Power Bank Market Growth Drivers
Several key factors contribute to the acceleration of the Kenya Power Bank Market. Firstly, the proliferation of smartphones and other portable devices has intensified the demand for efficient mobile charging solutions. With the rising number of mobile users, the necessity for accessible power sources becomes increasingly critical in everyday life.
- The rapid urbanization and population growth in Kenya have fostered an environment where the use of electronic devices is ubiquitous. This trend solidifies the need for reliable charging options, particularly in urban centers.
- Frequent power outages, a common challenge in various regions of Kenya, heighten the dependence on power banks. Consumers seek uninterrupted power supply solutions, propelling the market forward.
- Advancements in battery technology have greatly improved the efficiency and longevity of power banks, making them a more attractive alternative for consumers. Innovations contribute to better performance and user satisfaction.
- A growing awareness of the importance of having a backup power source has led to an increase in consumer education and marketing efforts, which further drive sales in the sector.
- Seasonal factors, such as increased outdoor activities and travel, also create spikes in demand as consumers require portable charging solutions while on the go.
Kenya Power Bank Market Challenges and Restraints
Despite substantial growth potential, the Kenya Power Bank Market faces notable challenges. High production costs stemming from the reliance on imported components and technology pose significant barriers to market entry and expansion. This dependency on imports not only amplifies overall costs but also complicates the logistics involved in supply chain management.
- Environmental concerns associated with battery disposal and recycling are gaining traction. Regulatory pressures may necessitate companies to invest in sustainable practices, which could increase operational costs.
- The prevalence of counterfeit products in the market undermines trust and poses a threat to consumer safety. This issue necessitates robust measures for regulatory compliance among legitimate providers.
- Limited local expertise in advanced battery technology hampers the development of high-quality products, creating a reliance on foreign technologies that could stifle competitive advantage.
- Competition from alternative portable power solutions, such as solar chargers, introduces additional challenges to traditional power bank manufacturers, necessitating innovation and differentiation.
- Economic volatility may affect consumer purchasing power, impacting overall market growth and the ability of consumers to invest in portable power solutions.
Kenya Power Bank Market Government Investment and Initiatives
The Kenyan government has initiated various policies and programs aimed at bolstering the power bank market, recognizing its significance in promoting consumer electronics and enhancing connectivity. Investment in infrastructure development is a priority, as improving grid electricity access would complement portable charging solutions.
- Public spending initiatives focus on enhancing the energy sector, potentially increasing the reliability of electricity supply and reducing the reliance on power banks for everyday use.
- The government is promoting regulations around electronic waste management, which could incentivize investments in sustainable battery disposal and recycling practices.
- Support for local manufacturing capabilities aims to reduce dependency on imported components, fostering industry growth and enhancing the quality of power bank products available on the market.
- Incentives for research and development in battery technology are part of the government's strategy to encourage innovation within the sector, promoting the creation of high-performance products.
- The establishment of consumer protection laws aims to combat counterfeit products, ensuring that consumers have access to safe and reliable power bank solutions.
Kenya Power Bank Market Latest Developments (May 2025 - June 2026)
In the period from May 2025 to June 2026, various developments have begun to shape the trajectory of the Kenya Power Bank Market. Notably, an uptick in consumer awareness regarding product safety has pushed companies to enhance their quality assurance measures. Market players have been increasingly focused on sustainable practices, with investments directed toward eco-friendly production methods.
- The introduction of government regulations targeting the disposal of electronic waste has prompted companies to develop recycling initiatives, reflecting a growing commitment to environmental sustainability.
- Advancements in technology have led to the development of more efficient power banks with faster charging capabilities, catering to the evolving needs of tech-savvy consumers.
- Collaboration among industry stakeholders has increased, with partnerships aimed at improving product offerings and expanding market reach, as companies recognize the value of shared resources and expertise.
- Consumer demand for customization has grown, prompting manufacturers to explore opportunities for personalized power bank designs that align with individual preferences.
- The competitive landscape has intensified, with companies exploring alternative distribution channels to enhance customer access, including online platforms that facilitate wider market reach.
Kenya Power Bank Market - Key Attractiveness of the Report
- 10 Years of Market Numbers
- Historical Data Starting from 2022 to 2025
- Base Year: 2025
- Forecast Data until 2032
- Key Performance Indicators Impacting the Market
- Major Upcoming Developments and Projects
Key Highlights of the Report:
- Kenya Power Bank Market Outlook
- Market Size of Kenya Power Bank Market, 2025
- Forecast of Kenya Power Bank Market, 2032
- Historical Data and Forecast of Kenya Power Bank Revenues & Volume for the Period 2022-2032F
- Kenya Power Bank Market Trend Evolution
- Kenya Power Bank Market Drivers and Challenges
- Kenya Power Bank Price Trends
- Kenya Power Bank Porter's Five Forces
- Kenya Power Bank Industry Life Cycle
- Historical Data and Forecast of Kenya Power Bank Market Revenues & Volume By Capacity Range for the Period 2022-2032F
- Historical Data and Forecast of Kenya Power Bank Market Revenues & Volume By Up to 3,000 mAh for the Period 2022-2032F
- Historical Data and Forecast of Kenya Power Bank Market Revenues & Volume By 3,001 mAh-8,000 mAh for the Period 2022-2032F
- Historical Data and Forecast of Kenya Power Bank Market Revenues & Volume By 8,001 mAh-20,000 mAh for the Period 2022-2032F
- Historical Data and Forecast of Kenya Power Bank Market Revenues & Volume By Above 20,000 mAh for the Period 2022-2032F
- Historical Data and Forecast of Kenya Power Bank Market Revenues & Volume By Energy Source for the Period 2022-2032F
- Historical Data and Forecast of Kenya Power Bank Market Revenues & Volume By Electric for the Period 2022-2032F
- Historical Data and Forecast of Kenya Power Bank Market Revenues & Volume By Solar for the Period 2022-2032F
- Historical Data and Forecast of Kenya Power Bank Market Revenues & Volume By Battery Type for the Period 2022-2032F
- Historical Data and Forecast of Kenya Power Bank Market Revenues & Volume By Lithium-ion for the Period 2022-2032F
- Historical Data and Forecast of Kenya Power Bank Market Revenues & Volume By Lithium Polymer for the Period 2022-2032F
- Historical Data and Forecast of Kenya Power Bank Market Revenues & Volume By Distribution Channel for the Period 2022-2032F
- Historical Data and Forecast of Kenya Power Bank Market Revenues & Volume By E-commerce for the Period 2022-2032F
- Historical Data and Forecast of Kenya Power Bank Market Revenues & Volume By Brick and Mortar for the Period 2022-2032F
- Kenya Power Bank Import Export Trade Statistics
- Market Opportunity Assessment By Capacity Range
- Market Opportunity Assessment By Energy Source
- Market Opportunity Assessment By Battery Type
- Market Opportunity Assessment By Distribution Channel
- Kenya Power Bank Top Companies Market Share
- Kenya Power Bank Competitive Benchmarking By Technical and Operational Parameters
- Kenya Power Bank Company Profiles
- Kenya Power Bank Key Strategic Recommendations
Frequently Asked Questions About the Market Study (FAQs):
Key growth factors include the increasing penetration of smartphones, the frequency of power outages, and advancements in battery technology that enhance performance.
Environmental concerns related to battery disposal and recycling are prompting companies to adopt sustainable practices, which may increase operational costs but ultimately benefit market credibility.
Significant challenges include high production costs, reliance on imported components, and competition from alternative power solutions that can affect market dynamics.
The government supports the market through infrastructure development, regulatory frameworks for electronic waste management, and incentives for local manufacturing and research initiatives.
6Wresearch actively monitors the Kenya Power Bank Market and publishes its comprehensive annual report, highlighting emerging trends, growth drivers, revenue analysis, and forecast outlook. Our insights help businesses to make data-backed strategic decisions with ongoing market dynamics. Our analysts track relevent industries related to the Kenya Power Bank Market, allowing our clients with actionable intelligence and reliable forecasts tailored to emerging regional needs.
Yes, we provide customisation as per your requirements. To learn more, feel free to contact us on sales@6wresearch.com
1 Executive Summary |
2 Introduction |
2.1 Key Highlights of the Report |
2.2 Report Description |
2.3 Market Scope & Segmentation |
2.4 Research Methodology |
2.5 Assumptions |
3 Kenya Power Bank Market Overview |
3.1 Kenya Country Macro Economic Indicators |
3.2 Kenya Power Bank Market Revenues & Volume, 2022 & 2032F |
3.3 Kenya Power Bank Market - Industry Life Cycle |
3.4 Kenya Power Bank Market - Porter's Five Forces |
3.5 Kenya Power Bank Market Revenues & Volume Share, By Capacity Range , 2022 & 2032F |
3.6 Kenya Power Bank Market Revenues & Volume Share, By Energy Source, 2022 & 2032F |
3.7 Kenya Power Bank Market Revenues & Volume Share, By Battery Type, 2022 & 2032F |
3.8 Kenya Power Bank Market Revenues & Volume Share, By Distribution Channel, 2022 & 2032F |
4 Kenya Power Bank Market Dynamics |
4.1 Impact Analysis |
4.2 Market Drivers |
4.3 Market Restraints |
5 Kenya Power Bank Market Trends |
6 Kenya Power Bank Market, By Types |
6.1 Kenya Power Bank Market, By Capacity Range |
6.1.1 Overview and Analysis |
6.1.2 Kenya Power Bank Market Revenues & Volume, By Capacity Range , 2022-2032F |
6.1.3 Kenya Power Bank Market Revenues & Volume, By Up to 3,000 mAh, 2022-2032F |
6.1.4 Kenya Power Bank Market Revenues & Volume, By 3,001 mAh-8,000 mAh, 2022-2032F |
6.1.5 Kenya Power Bank Market Revenues & Volume, By 8,001 mAh-20,000 mAh, 2022-2032F |
6.1.6 Kenya Power Bank Market Revenues & Volume, By Above 20,000 mAh, 2022-2032F |
6.2 Kenya Power Bank Market, By Energy Source |
6.2.1 Overview and Analysis |
6.2.2 Kenya Power Bank Market Revenues & Volume, By Electric, 2022-2032F |
6.2.3 Kenya Power Bank Market Revenues & Volume, By Solar, 2022-2032F |
6.3 Kenya Power Bank Market, By Battery Type |
6.3.1 Overview and Analysis |
6.3.2 Kenya Power Bank Market Revenues & Volume, By Lithium-ion, 2022-2032F |
6.3.3 Kenya Power Bank Market Revenues & Volume, By Lithium Polymer, 2022-2032F |
6.4 Kenya Power Bank Market, By Distribution Channel |
6.4.1 Overview and Analysis |
6.4.2 Kenya Power Bank Market Revenues & Volume, By E-commerce, 2022-2032F |
6.4.3 Kenya Power Bank Market Revenues & Volume, By Brick and Mortar, 2022-2032F |
7 Kenya Power Bank Market Import-Export Trade Statistics |
7.1 Kenya Power Bank Market Export to Major Countries |
7.2 Kenya Power Bank Market Imports from Major Countries |
8 Kenya Power Bank Market Key Performance Indicators |
9 Kenya Power Bank Market - Opportunity Assessment |
9.1 Kenya Power Bank Market Opportunity Assessment, By Capacity Range , 2022 & 2032F |
9.2 Kenya Power Bank Market Opportunity Assessment, By Energy Source, 2022 & 2032F |
9.3 Kenya Power Bank Market Opportunity Assessment, By Battery Type, 2022 & 2032F |
9.4 Kenya Power Bank Market Opportunity Assessment, By Distribution Channel, 2022 & 2032F |
10 Kenya Power Bank Market - Competitive Landscape |
10.1 Kenya Power Bank Market Revenue Share, By Companies, 2025 |
10.2 Kenya Power Bank Market Competitive Benchmarking, By Operating and Technical Parameters |
11 Company Profiles |
12 Recommendations |
13 Disclaimer |
Global Go To Market Strategy - 2030
Export potential enables firms to identify high-growth global markets with greater confidence by combining advanced trade intelligence with a structured quantitative methodology. The framework analyzes emerging demand trends and country-level import patterns while integrating macroeconomic and trade datasets such as GDP and population forecasts, bilateral import–export flows, tariff structures, elasticity differentials between developed and developing economies, geographic distance, and import demand projections. Using weighted trade values from 2020–2024 as the base period to project country-to-country export potential for 2030, these inputs are operationalized through calculated drivers such as gravity model parameters, tariff impact factors, and projected GDP per-capita growth. Through an analysis of hidden potentials, demand hotspots, and market conditions that are most favorable to success, this method enables firms to focus on target countries, maximize returns, and global expansion with data, backed by accuracy.
By factoring in the projected importer demand gap that is currently unmet and could be potential opportunity, it identifies the potential for the Exporter (Country) among 190 countries, against the general trade analysis, which identifies the biggest importer or exporter.
To discover high-growth global markets and optimize your business strategy:
Click Here
Pricing
- Single User License$ 1,995
- Department License$ 2,400
- Site License$ 3,120
- Global License$ 3,795

Leadership Perspectives from Industry Events
Search
Thought Leadership and Analyst Meet


Our Clients
6WResearch In News
- India Air Conditioner Market Set for Strong Rebound in 2026 After Weather-Led Correction and GST-Driven Recovery: 6Wresearch
- ADAS in India: How Automatic Emergency Braking, Blind Spot Detection & Driver Monitoring are Transforming Road Safety
- Doha a strategic location for EV manufacturing hub: IPA Qatar
- Demand for luxury TVs surging in the GCC, says Samsung
- Empowering Growth: The Thriving Journey of Bangladesh’s Cable Industry
- Demand for luxury TVs surging in the GCC, says Samsung
Latest Reports
- Nicaragua RPG Gaming Market (2026-2032)
- New Zealand RPG Gaming Market (2026-2032)
- Netherlands RPG Gaming Market (2026-2032)
- Nauru RPG Gaming Market (2026-2032)
- Namibia RPG Gaming Market (2026-2032)
- Mozambique RPG Gaming Market (2026-2032)
- Montenegro RPG Gaming Market (2026-2032)
- Mongolia RPG Gaming Market (2026-2032)
- Monaco RPG Gaming Market (2026-2032)
- Micronesia RPG Gaming Market (2026-2032)
Industry Events and Analyst Meet

HIMTEX 2026

India Refining Summit 2026

India EV Show 2026

EV tech India Expo 2026

Auto Tech Asia 2026
Whitepaper
- Middle East & Africa Commercial Security Market Click here to view more.
- Middle East & Africa Fire Safety Systems & Equipment Market Click here to view more.
- GCC Drone Market Click here to view more.
- Middle East Lighting Fixture Market Click here to view more.
- GCC Physical & Perimeter Security Market Click here to view more.