Kenya Rubber Transmission Belts Market (2026-2032) | Outlook, Forecast, Industry, Value, Share, Revenue, Size, Growth, Analysis, Companies & Trends
Market Forecast By Product (Raw Edged Belts, V-belts, Timing Belts, Wrapped Belts, Specialty Belts, Others), By Application (Industrial, Automotive Components, Agricultural Equipment, Mining, Others) And Competitive Landscape
| Product Code: ETC030130 | Publication Date: Oct 2020 | Updated Date: Jun 2026 | Product Type: Report | |
| Publisher: 6Wresearch | Author: Shubham Deep | No. of Pages: 70 | No. of Figures: 35 | No. of Tables: 5 |
Kenya Rubber Transmission Belts Market Summary
The kenya rubber transmission belts market was estimated at USD 362 Million in 2025 and is projected to reach USD 500 Million by 2032, growing at a CAGR of 5.6% from 2026 to 2032.
Kenya Rubber Transmission Belts Market Growth Rate Analysis (2021-2032)
The Kenya Rubber Transmission Belts Market displays a promising trajectory, with growth rates maintaining stability in recent years. In 2021, the market expanded by 5.6%, followed by a slightly higher growth of 5.9% in 2022, driven by increased demand from various industries, especially agriculture and manufacturing. Although growth tapered to 5.2% in 2023, this fluctuation can be attributed to temporary supply chain disruptions and rising raw material costs. Nevertheless, projections suggest a rebound, with anticipated growth around 5.5% to 5.6% from 2024 to 2026 as infrastructure development boosts industrial activities. The ongoing energy transition and rising consumer demand are expected to support sustained investments in this sector, fostering further growth up to 2032.
Kenya Rubber Transmission Belts Market Year-wise Growth Rate and Key Drivers
This graph highlights how the Kenya Rubber Transmission Belts Market has steadily grown over the past five years, supported by major growth factors.
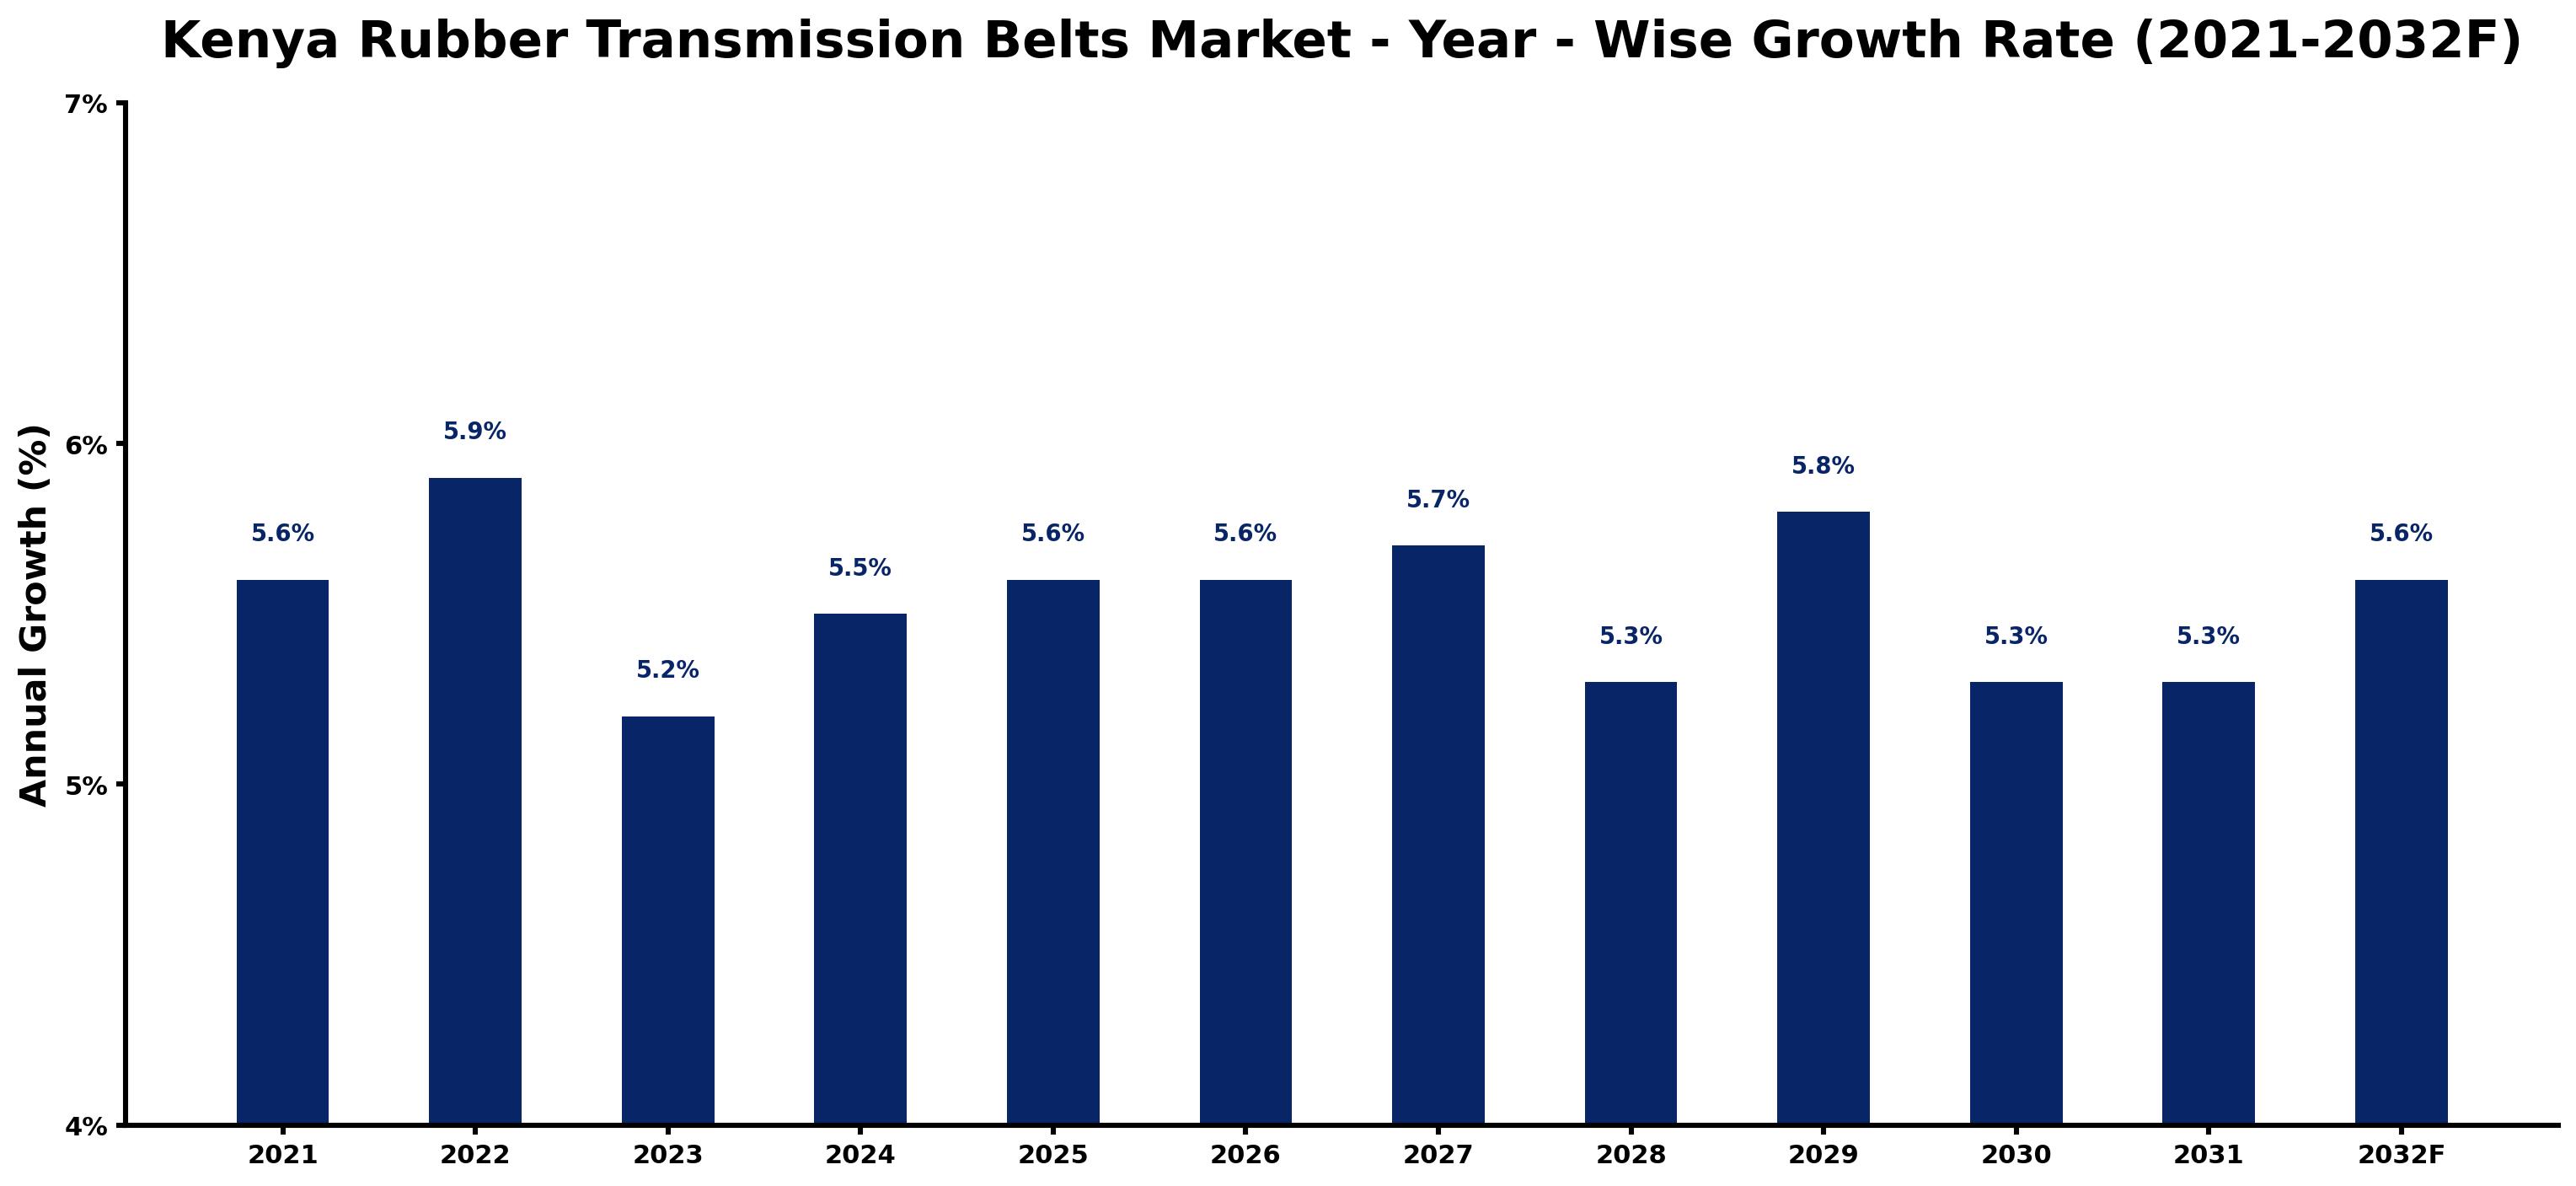
The table below presents the year wise growth rates along with the key drivers influencing the market
| Year | Growth Rate | Major Drivers |
| 2021 | 5.6% | Increased local production capabilities help reduce reliance on imported rubber belts. |
| 2022 | 5.9% | Infrastructure investments support the demand for reliable transmission solutions in industries. |
| 2023 | 5.2% | Emerging mining projects create new opportunities for belt manufacturers in Kenya. |
| 2024 | 5.5% | Technological improvements enhance belt durability, appealing to diverse industrial applications. |
| 2025 | 5.6% | Strategic partnerships with local firms boost distribution networks across key sectors. |
| 2026 | 5.6% | Growing automotive industry necessitates higher-quality belts for enhanced vehicle performance. |
| 2027 | 5.7% | Expansions in agriculture drive the need for specialized transmission solutions in farming. |
| 2028 | 5.3% | Regional trade agreements reduce tariffs, encouraging cross-border belt sales and imports. |
| 2029 | 5.8% | Heightened focus on sustainable materials influences product innovation within the market. |
| 2030 | 5.3% | Investment in renewable energy projects increases demand for reliable rubber transmission belts. |
| 2031 | 5.3% | Improved logistics infrastructure streamlines transportation and distribution channels nationally. |
| 2032 | 5.6% | Market consolidation leads to enhanced product offerings and competitive pricing strategies. |
Note - Market size estimations and growth projections presented in this report are based on 6Wresearch's advanced forecasting approach, validated with industry datasets as of June 2026.
Kenya Rubber Transmission Belts Market Synopsis
The Kenya Rubber Transmission Belts Market is projected to reach 5.6% and witness significant growth during the forecast period (2026-2032). This growth can be attributed to various factors, including an upsurge in industrial activities across key sectors like agriculture, mining, and manufacturing. As these industries expand, the need for efficient power transmission systems has intensified, creating a robust demand for rubber transmission belts. Furthermore, advancements in belt manufacturing technologies and a strong focus on enhancing operational efficiency and productivity serve as critical drivers propelling this market.
Kenya Rubber Transmission Belts Market Growth Drivers
The growth trajectory of the Kenya Rubber Transmission Belts Market is underpinned by several pivotal factors:
- The diversification of the Kenyan economy is leading to increased industrialization, with sectors such as construction and mining requiring reliable power transmission solutions.
- Technological innovations in the design and manufacturing of rubber transmission belts enhance performance, leading to heightened demand in various applications.
- Local players and international manufacturers are expanding their product portfolios, addressing the growing need for specialized rubber transmission belts in diverse industrial setups.
- A growing focus on sustainability is prompting industries to adopt eco-friendly materials and energy-efficient technologies, which boosts the demand for advanced rubber transmission belt solutions.
- Government initiatives aimed at improving infrastructure and promoting local manufacturing are also fostering a conducive environment for market expansion.
Kenya Rubber Transmission Belts Market Trends and Opportunities
The Kenya Rubber Transmission Belts Market is currently witnessing several pivotal trends that present opportunities for growth:
- Increasing preference for high-performance rubber transmission belts among industries such as automotive and agriculture is driving demand for more durable and efficient solutions.
- The trend towards sustainability is not only shaping consumer preferences but also pushing manufacturers to innovate towards eco-friendly belt options.
- There is a rising demand for customized rubber belts designed specifically for unique applications, presenting significant opportunities for niche market players.
- The shift towards automation and advanced machinery in various sectors is likely to increase the reliance on robust transmission belts, fueling market growth.
- With ongoing investments in infrastructure development, especially in rural areas, the demand for transmission belts in conveyor systems is expected to rise correspondingly.
Kenya Rubber Transmission Belts Market Challenges and Restraints
Despite the positive outlook, the Kenya Rubber Transmission Belts Market faces several challenges:
- Competition from both local and international manufacturers is intense, leading to price wars and margin compression.
- Inconsistent quality control measures can allow inferior products to enter the market, undermining consumer trust and sector reputation.
- Volatility in the prices of raw materials, including rubber and synthetic fibers, poses a significant risk to production stability and pricing strategies.
- Limited access to advanced manufacturing technologies hampers the ability to innovate and compete effectively in terms of quality and performance.
- Inadequate infrastructure and logistics in certain regions can restrict distribution capabilities, limiting market reach and impacting sales.
Kenya Rubber Transmission Belts Market Investment Opportunities
The current landscape offers various investment opportunities in the Kenya Rubber Transmission Belts Market:
- Investors can capitalize on the increasing demand for high-quality rubber belts tailored for diverse industrial applications.
- Emerging technologies focused on enhancing the durability and energy efficiency of transmission belts present avenues for innovation-driven investments.
- Strategic partnerships with local distributors can facilitate market entry and broaden distribution networks across Kenya.
- Development of training programs for manufacturers concerning quality control measures can improve product standards and market reputation.
- Investments in research and development can drive advancements in materials and designs, keeping pace with evolving customer demands.
Kenya Rubber Transmission Belts Market Government Investment and Initiatives
The Kenyan government has instituted several initiatives aimed at bolstering the rubber transmission belts market:
- Policies promoting local manufacturing are in place to diminish dependency on imports, encouraging domestic production capabilities.
- Investment incentives have been established to attract investors into the rubber manufacturing sector, aiming to enhance production capacities.
- Quality control standards are enforced to ensure product safety and reliability, supporting consumer confidence and market integrity.
- The government's collaboration with research institutions is fostering innovation, providing manufacturers with access to advanced technologies.
- Public spending directed towards infrastructure development strengthens logistical networks, enhancing the distribution capabilities of rubber transmission belts.
Kenya Rubber Transmission Belts Market Latest Developments (May 2025 - June 2026)
The period from May 2025 to June 2026 has seen significant developments in the Kenya Rubber Transmission Belts Market:
- An increasing number of manufacturers have begun adopting advanced materials to enhance the durability and performance of rubber transmission belts.
- Sustainability initiatives have gained momentum, with more companies prioritizing the development of eco-friendly rubber belts.
- The market has observed a surge in partnerships between manufacturers and technology providers aimed at fostering innovation and competitive advantage.
- Economic recovery efforts post-pandemic have stimulated demand across various sectors, resulting in higher consumption of rubber belts.
- Research and development initiatives have intensified, focusing on improving manufacturing processes and enhancing product offerings to meet specific market needs.
Kenya Rubber Transmission Belts Market - Key Attractiveness of the Report
- 10 Years of Market Numbers
- Historical Data Starting from 2022 to 2025
- Base Year: 2025
- Forecast Data until 2032
- Key Performance Indicators Impacting the Market
- Major Upcoming Developments and Projects
Key Highlights of the Report:
- Kenya Rubber Transmission Belts Market Outlook
- Market Size of Kenya Rubber Transmission Belts Market, 2025
- Forecast of Kenya Rubber Transmission Belts Market, 2032F
- Historical Data and Forecast of Kenya Rubber Transmission Belts Revenues & Volume for the Period 2022-2032F
- Kenya Rubber Transmission Belts Market Trend Evolution
- Kenya Rubber Transmission Belts Market Drivers and Challenges
- Kenya Rubber Transmission Belts Price Trends
- Kenya Rubber Transmission Belts Porter's Five Forces
- Kenya Rubber Transmission Belts Industry Life Cycle
- Historical Data and Forecast of Kenya Rubber Transmission Belts Market Revenues & Volume By Product for the Period 2022-2032F
- Historical Data and Forecast of Kenya Rubber Transmission Belts Market Revenues & Volume By Raw Edged Belts for the Period 2022-2032F
- Historical Data and Forecast of Kenya Rubber Transmission Belts Market Revenues & Volume By V-belts for the Period 2022-2032F
- Historical Data and Forecast of Kenya Rubber Transmission Belts Market Revenues & Volume By Timing Belts for the Period 2022-2032F
- Historical Data and Forecast of Kenya Rubber Transmission Belts Market Revenues & Volume By Wrapped Belts for the Period 2022-2032F
- Historical Data and Forecast of Kenya Rubber Transmission Belts Market Revenues & Volume By Specialty Belts for the Period 2022-2032F
- Historical Data and Forecast of Kenya Rubber Transmission Belts Market Revenues & Volume By Others for the Period 2022-2032F
- Historical Data and Forecast of Kenya Rubber Transmission Belts Market Revenues & Volume By Application for the Period 2022-2032F
- Historical Data and Forecast of Kenya Rubber Transmission Belts Market Revenues & Volume By Industrial for the Period 2022-2032F
- Historical Data and Forecast of Kenya Rubber Transmission Belts Market Revenues & Volume By Automotive Components for the Period 2022-2032F
- Historical Data and Forecast of Kenya Rubber Transmission Belts Market Revenues & Volume By Agricultural Equipment for the Period 2022-2032F
- Historical Data and Forecast of Kenya Rubber Transmission Belts Market Revenues & Volume By Mining for the Period 2022-2032F
- Historical Data and Forecast of Kenya Rubber Transmission Belts Market Revenues & Volume By Others for the Period 2022-2032F
- Kenya Rubber Transmission Belts Import Export Trade Statistics
- Market Opportunity Assessment By Product
- Market Opportunity Assessment By Application
- Kenya Rubber Transmission Belts Top Companies Market Share
- Kenya Rubber Transmission Belts Competitive Benchmarking By Technical and Operational Parameters
- Kenya Rubber Transmission Belts Company Profiles
- Kenya Rubber Transmission Belts Key Strategic Recommendations
Frequently Asked Questions About the Market Study (FAQs):
The growth is primarily driven by increasing industrial activities, infrastructural development, and advancements in manufacturing technologies.
Manufacturers face challenges including intense competition, fluctuating raw material prices, and inconsistent quality control measures.
Opportunities lie in local manufacturing, development of advanced belt technologies, and strategic partnerships with distributors.
The Kenyan government supports the market through policies promoting local manufacturing, investment incentives, and quality control standards.
6Wresearch actively monitors the Kenya Rubber Transmission Belts Market and publishes its comprehensive annual report, highlighting emerging trends, growth drivers, revenue analysis, and forecast outlook. Our insights help businesses to make data-backed strategic decisions with ongoing market dynamics. Our analysts track relevent industries related to the Kenya Rubber Transmission Belts Market, allowing our clients with actionable intelligence and reliable forecasts tailored to emerging regional needs.
Yes, we provide customisation as per your requirements. To learn more, feel free to contact us on sales@6wresearch.com
1 Executive Summary |
2 Introduction |
2.1 Key Highlights of the Report |
2.2 Report Description |
2.3 Market Scope & Segmentation |
2.4 Research Methodology |
2.5 Assumptions |
3 Kenya Rubber Transmission Belts Market Overview |
3.1 Kenya Country Macro Economic Indicators |
3.2 Kenya Rubber Transmission Belts Market Revenues & Volume, 2022 & 2032F |
3.3 Kenya Rubber Transmission Belts Market - Industry Life Cycle |
3.4 Kenya Rubber Transmission Belts Market - Porter's Five Forces |
3.5 Kenya Rubber Transmission Belts Market Revenues & Volume Share, By Product, 2022 & 2032F |
3.6 Kenya Rubber Transmission Belts Market Revenues & Volume Share, By Application, 2022 & 2032F |
4 Kenya Rubber Transmission Belts Market Dynamics |
4.1 Impact Analysis |
4.2 Market Drivers |
4.3 Market Restraints |
5 Kenya Rubber Transmission Belts Market Trends |
6 Kenya Rubber Transmission Belts Market, By Types |
6.1 Kenya Rubber Transmission Belts Market, By Product |
6.1.1 Overview and Analysis |
6.1.2 Kenya Rubber Transmission Belts Market Revenues & Volume, By Product, 2022-2032F |
6.1.3 Kenya Rubber Transmission Belts Market Revenues & Volume, By Raw Edged Belts, 2022-2032F |
6.1.4 Kenya Rubber Transmission Belts Market Revenues & Volume, By V-belts, 2022-2032F |
6.1.5 Kenya Rubber Transmission Belts Market Revenues & Volume, By Timing Belts, 2022-2032F |
6.1.6 Kenya Rubber Transmission Belts Market Revenues & Volume, By Wrapped Belts, 2022-2032F |
6.1.7 Kenya Rubber Transmission Belts Market Revenues & Volume, By Specialty Belts, 2022-2032F |
6.1.8 Kenya Rubber Transmission Belts Market Revenues & Volume, By Others, 2022-2032F |
6.2 Kenya Rubber Transmission Belts Market, By Application |
6.2.1 Overview and Analysis |
6.2.2 Kenya Rubber Transmission Belts Market Revenues & Volume, By Industrial, 2022-2032F |
6.2.3 Kenya Rubber Transmission Belts Market Revenues & Volume, By Automotive Components, 2022-2032F |
6.2.4 Kenya Rubber Transmission Belts Market Revenues & Volume, By Agricultural Equipment, 2022-2032F |
6.2.5 Kenya Rubber Transmission Belts Market Revenues & Volume, By Mining, 2022-2032F |
6.2.6 Kenya Rubber Transmission Belts Market Revenues & Volume, By Others, 2022-2032F |
7 Kenya Rubber Transmission Belts Market Import-Export Trade Statistics |
7.1 Kenya Rubber Transmission Belts Market Export to Major Countries |
7.2 Kenya Rubber Transmission Belts Market Imports from Major Countries |
8 Kenya Rubber Transmission Belts Market Key Performance Indicators |
9 Kenya Rubber Transmission Belts Market - Opportunity Assessment |
9.1 Kenya Rubber Transmission Belts Market Opportunity Assessment, By Product, 2022 & 2032F |
9.2 Kenya Rubber Transmission Belts Market Opportunity Assessment, By Application, 2022 & 2032F |
10 Kenya Rubber Transmission Belts Market - Competitive Landscape |
10.1 Kenya Rubber Transmission Belts Market Revenue Share, By Companies, 2025 |
10.2 Kenya Rubber Transmission Belts Market Competitive Benchmarking, By Operating and Technical Parameters |
11 Company Profiles |
12 Recommendations |
13 Disclaimer |
Global Go To Market Strategy - 2030
Export potential enables firms to identify high-growth global markets with greater confidence by combining advanced trade intelligence with a structured quantitative methodology. The framework analyzes emerging demand trends and country-level import patterns while integrating macroeconomic and trade datasets such as GDP and population forecasts, bilateral import–export flows, tariff structures, elasticity differentials between developed and developing economies, geographic distance, and import demand projections. Using weighted trade values from 2020–2024 as the base period to project country-to-country export potential for 2030, these inputs are operationalized through calculated drivers such as gravity model parameters, tariff impact factors, and projected GDP per-capita growth. Through an analysis of hidden potentials, demand hotspots, and market conditions that are most favorable to success, this method enables firms to focus on target countries, maximize returns, and global expansion with data, backed by accuracy.
By factoring in the projected importer demand gap that is currently unmet and could be potential opportunity, it identifies the potential for the Exporter (Country) among 190 countries, against the general trade analysis, which identifies the biggest importer or exporter.
To discover high-growth global markets and optimize your business strategy:
Click Here
Pricing
- Single User License$ 1,995
- Department License$ 2,400
- Site License$ 3,120
- Global License$ 3,795

Leadership Perspectives from Industry Events
Search
Thought Leadership and Analyst Meet


Our Clients
6WResearch In News
- India Air Conditioner Market Set for Strong Rebound in 2026 After Weather-Led Correction and GST-Driven Recovery: 6Wresearch
- ADAS in India: How Automatic Emergency Braking, Blind Spot Detection & Driver Monitoring are Transforming Road Safety
- Doha a strategic location for EV manufacturing hub: IPA Qatar
- Demand for luxury TVs surging in the GCC, says Samsung
- Empowering Growth: The Thriving Journey of Bangladesh’s Cable Industry
- Demand for luxury TVs surging in the GCC, says Samsung
Latest Reports
- Nicaragua RPG Gaming Market (2026-2032)
- New Zealand RPG Gaming Market (2026-2032)
- Netherlands RPG Gaming Market (2026-2032)
- Nauru RPG Gaming Market (2026-2032)
- Namibia RPG Gaming Market (2026-2032)
- Mozambique RPG Gaming Market (2026-2032)
- Montenegro RPG Gaming Market (2026-2032)
- Mongolia RPG Gaming Market (2026-2032)
- Monaco RPG Gaming Market (2026-2032)
- Micronesia RPG Gaming Market (2026-2032)
Industry Events and Analyst Meet

HIMTEX 2026

India Refining Summit 2026

India EV Show 2026

EV tech India Expo 2026

Auto Tech Asia 2026
Whitepaper
- Middle East & Africa Commercial Security Market Click here to view more.
- Middle East & Africa Fire Safety Systems & Equipment Market Click here to view more.
- GCC Drone Market Click here to view more.
- Middle East Lighting Fixture Market Click here to view more.
- GCC Physical & Perimeter Security Market Click here to view more.