Kenya Shaft Couplings Market (2026-2032) | Forecast, Industry, Value, Analysis, Growth, Outlook, Share, Size, Trends, Companies & Revenue
Market Forecast By Type (Flexible Couplings, Disc Rigid Couplings), By Application (Power and Energy, Automotive Industry, Steel Industry) And Competitive Landscape
| Product Code: ETC043290 | Publication Date: Jan 2021 | Updated Date: Jun 2026 | Product Type: Report | |
| Publisher: 6Wresearch | Author: Sachin Kumar Rai | No. of Pages: 70 | No. of Figures: 35 | No. of Tables: 5 |
Kenya Shaft Couplings Market Summary
The kenya shaft couplings market was estimated at USD 200 Million in 2025 and is projected to reach USD 281 Million by 2032, growing at a CAGR of 6.1% from 2026 to 2032.
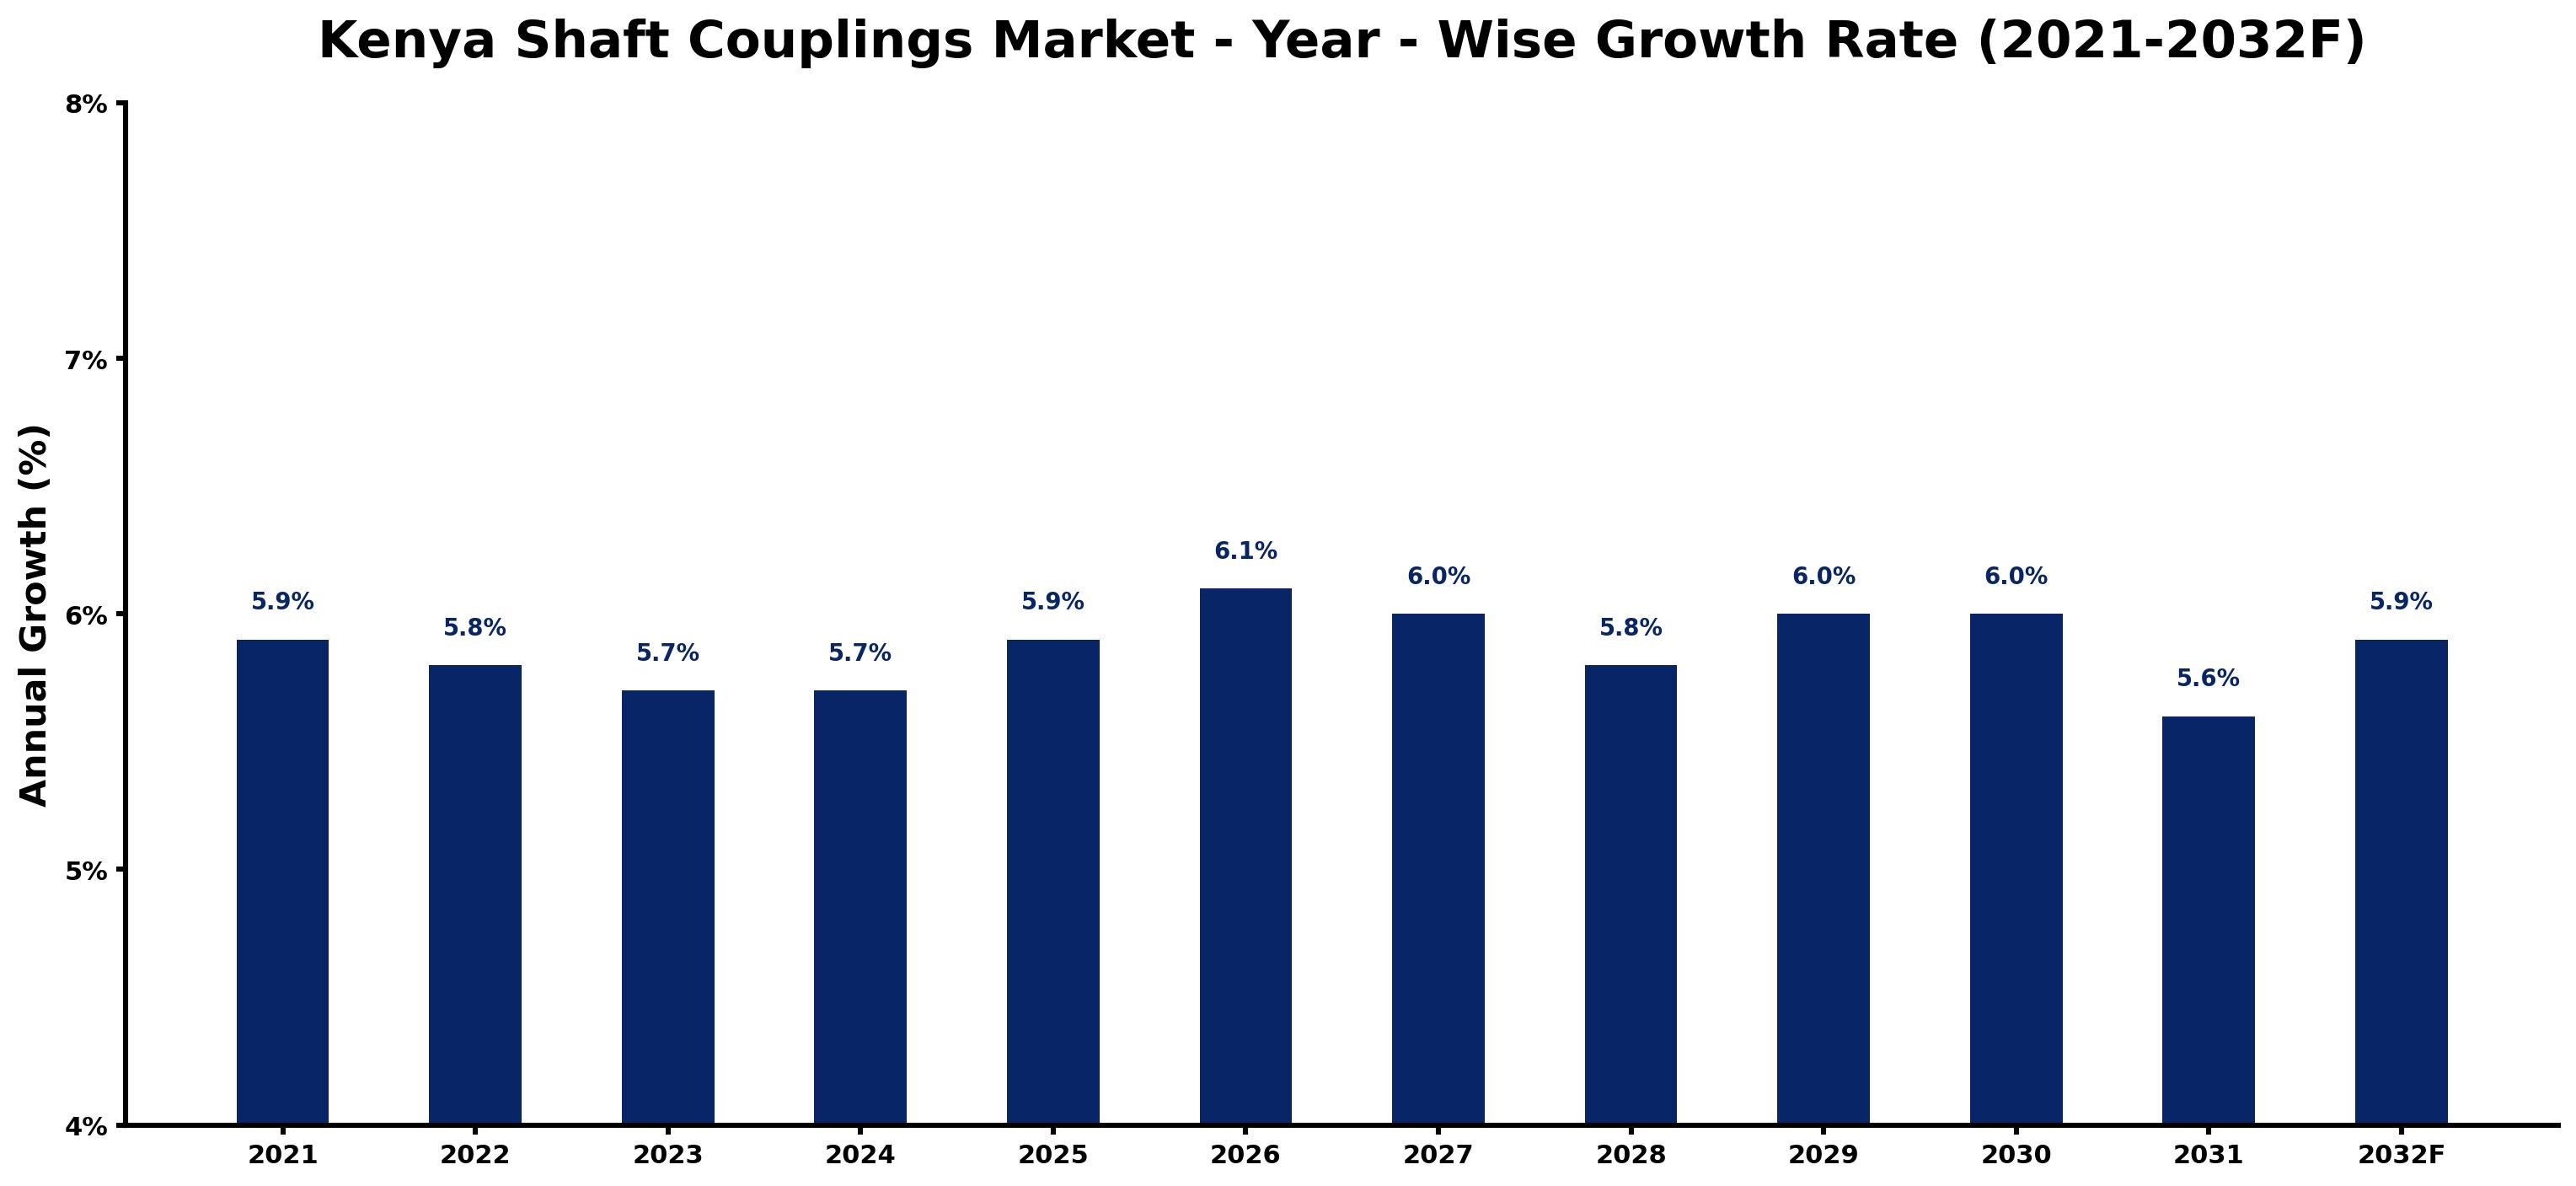
Kenya Shaft Couplings Market Growth Rate Analysis (2021-2032)
The Kenya shaft couplings market has displayed stable growth, with an increase of 5.9% in 2021, dipping slightly to 5.8% in 2022, before continuing on a similar trajectory with 5.7% in 2023 and 2024. Demand has remained strong due to ongoing investments in infrastructure and industrial projects, bolstered by an energy transition that emphasizes efficient machinery. Between 2025 and 2032, growth is projected to stabilize, with slight fluctuations—seeing a rise to 6.1% in 2026, before settling back to 5.6% in 2031. These shifts reflect ongoing technological advancements and adjustments in consumer demand, highlighting the market's resilience amidst evolving industrial trends.
Kenya Shaft Couplings Market Year-wise Growth Rate and Key Drivers
This graph highlights how the Kenya Shaft Couplings Market has steadily grown over the past five years, supported by major growth factors.
The table below presents the year wise growth rates along with the key drivers influencing the market
| Year | Growth Rate | Major Drivers |
| 2021 | 5.9% | Manufacturing sectors are expanding, enhancing the need for reliable shaft couplings. |
| 2022 | 5.8% | Investment in renewable energy projects is boosting machinery requirements significantly. |
| 2023 | 5.7% | Infrastructure development in urban areas demands robust mechanical solutions for construction. |
| 2024 | 5.7% | Emerging industries are integrating automation, increasing the demand for high-performance couplings. |
| 2025 | 5.9% | Local manufacturing capabilities are improving, reducing reliance on foreign coupling imports. |
| 2026 | 6.1% | Technological advancements in materials are leading to innovative coupling designs and applications. |
| 2027 | 6.0% | New trade agreements are fostering market competition, benefiting end-users with better choices. |
| 2028 | 5.8% | Economic diversification efforts are propelling industries that require advanced mechanical components. |
| 2029 | 6.0% | The agricultural sector's modernization is creating an uptick in coupling applications for machinery. |
| 2030 | 6.0% | Growing urbanization results in larger construction projects, further necessitating durable coupling solutions. |
| 2031 | 5.6% | Investment in transportation infrastructure is amplifying demand for specialized shaft couplings. |
| 2032 | 5.9% | Sustainability trends are driving the development of eco-friendly coupling alternatives in the market. |
Note - Market size estimations and growth projections presented in this report are based on 6Wresearch's advanced forecasting approach, validated with industry datasets as of June 2026.
Kenya Shaft Couplings Market Synopsis
The Kenya Shaft Couplings Market is projected to reach 6.1% and witness significant growth during the forecast period (2026-2032). This expansion is primarily attributed to the rising industrialization and infrastructure development within the country. An increasing demand for machinery and equipment across key sectors such as manufacturing, construction, and automotive underscores the need for effective power transmission solutions like shaft couplings.
Kenya Shaft Couplings Market Growth Drivers
The growth trajectory of the Kenya Shaft Couplings Market is influenced by several critical drivers:
- The acceleration of industrial activities in Kenya is fostering an increased demand for machinery that requires efficient power transmission solutions.
- Infrastructure development projects, including roadworks and energy generation facilities, are necessitating the use of various couplings in construction and heavy machinery.
- The automotive sector's expansion also creates a robust demand for reliable shaft couplings to enhance vehicle performance and durability.
- Technological advancements related to Industry 4.0 are enabling manufacturers to adopt innovative coupling designs that improve operational efficiency.
- The push for sustainable practices within industries is driving the development and adoption of eco-friendly coupling solutions, catering to the needs of environmentally conscious consumers.
Kenya Shaft Couplings Market Trends and Opportunities
Key trends shaping the Kenya Shaft Couplings Market include an increased focus on flexible and high-performance couplings across various industries. The following elements are contributing to this trend:
- Growing demand for flexible couplings that allow for greater misalignment and movement in machinery, enhancing performance in dynamic applications.
- Emerging interest in smart couplings equipped with monitoring capabilities, providing real-time data on operational efficiency and potential failures.
- A significant shift towards energy-efficient products, responding to global sustainability goals and regulatory requirements for reduced environmental impact.
- The integration of automation technologies within industrial processes is necessitating more sophisticated coupling systems that can support automated machinery.
- A rising awareness among manufacturers regarding the long-term cost benefits of investing in high-quality couplings, leading to a preference for premium products over cheaper alternatives.
Kenya Shaft Couplings Market Challenges and Restraints
Despite its growth potential, the Kenya Shaft Couplings Market faces significant challenges that may hinder its progress:
- The prevalence of low-quality and counterfeit products poses a threat to the credibility of genuine manufacturers, potentially leading to eroded consumer trust.
- Inconsistent regulatory frameworks and standards create confusion in the market, complicating compliance for manufacturers and potentially stalling industry growth.
- Limited awareness of the benefits associated with high-quality shaft couplings among certain consumer segments results in a tendency to select inferior alternatives.
- The market can also be impacted by fluctuating raw material costs, affecting the pricing strategies of manufacturers and their competitive positioning.
- The need for continuous innovation is pressured by rapidly changing technology landscapes, requiring manufacturers to invest consistently in R&D to stay competitive.
Kenya Shaft Couplings Market Investment Opportunities
The investment landscape in the Kenya Shaft Couplings Market is robust, driven by the expanding industrial sector. Key opportunities include:
- Manufacturing high-quality shaft couplings tailored to meet the diverse requirements of various industries, particularly in mining and construction.
- Investing in innovation focused on developing advanced coupling technologies that enhance efficiency and machine longevity.
- Forming strategic partnerships with local firms and industry associations to gain insights into market dynamics and consumer behavior.
- Exploring opportunities in eco-friendly coupling solutions, which align with sustainability efforts and environmental regulations.
- Contributing to community initiatives related to industrial training, which can help develop a skilled workforce suited for the evolving technical needs of the coupling sector.
Kenya Shaft Couplings Market Government Investment and Initiatives
The Kenyan government has enacted various policies that are conducive to the growth of the Shaft Couplings Market. Quality control measures enforced by the Kenya Bureau of Standards (KEBS) ensure that products meet industry standards. Additionally, tax incentives and subsidies aimed at promoting local manufacturing are fostering a favorable business environment.
Furthermore, the Industrial Property Act enhances intellectual property protections, encouraging innovation within the sector. Trade agreements established with other countries facilitate the import and export of shaft couplings, bolstering international trade relations. Overall, these government initiatives aim to stimulate growth, enhance competitiveness, and ensure sustainable practices within the Kenya Shaft Couplings Market.
Kenya Shaft Couplings Market Latest Developments (May 2025 - June 2026)
Recent developments in the Kenya Shaft Couplings Market reflect the industry's dynamic nature. There has been a noticeable shift toward the adoption of smart coupling technologies that monitor performance and provide predictive maintenance capabilities. This advancement resonates well with the rising demand for automation in manufacturing processes.
Moreover, sustainability has become a leading theme, with manufacturers increasingly prioritizing eco-friendly materials and production methods. This strategic focus is largely driven by consumer preferences for environmentally responsible products, which is shaping purchasing decisions across diverse sectors.
In addition to these technological and sustainability advancements, industry players are also focusing on enhancing product quality and compliance with international standards, forging relationships that can further broaden their market influence.
Kenya Shaft Couplings Market - Key Attractiveness of the Report
- 10 Years of Market Numbers
- Historical Data Starting from 2022 to 2025
- Base Year: 2025
- Forecast Data until 2032
- Key Performance Indicators Impacting the Market
- Major Upcoming Developments and Projects
Key Highlights of the Report:
- Kenya Shaft Couplings Market Outlook
- Market Size of Kenya Shaft Couplings Market, 2025
- Forecast of Kenya Shaft Couplings Market, 2032F
- Historical Data and Forecast of Kenya Shaft Couplings Revenues & Volume for the Period 2022-2032F
- Kenya Shaft Couplings Market Trend Evolution
- Kenya Shaft Couplings Market Drivers and Challenges
- Kenya Shaft Couplings Price Trends
- Kenya Shaft Couplings Porter's Five Forces
- Kenya Shaft Couplings Industry Life Cycle
- Historical Data and Forecast of Kenya Shaft Couplings Market Revenues & Volume By Type for the Period 2022-2032F
- Historical Data and Forecast of Kenya Shaft Couplings Market Revenues & Volume By Flexible Couplings for the Period 2022-2032F
- Historical Data and Forecast of Kenya Shaft Couplings Market Revenues & Volume By Disc Rigid Couplings for the Period 2022-2032F
- Historical Data and Forecast of Kenya Shaft Couplings Market Revenues & Volume By Application for the Period 2022-2032F
- Historical Data and Forecast of Kenya Shaft Couplings Market Revenues & Volume By Power and Energy for the Period 2022-2032F
- Historical Data and Forecast of Kenya Shaft Couplings Market Revenues & Volume By Automotive Industry for the Period 2022-2032F
- Historical Data and Forecast of Kenya Shaft Couplings Market Revenues & Volume By Steel Industry for the Period 2022-2032F
- Kenya Shaft Couplings Import Export Trade Statistics
- Market Opportunity Assessment By Type
- Market Opportunity Assessment By Application
- Kenya Shaft Couplings Top Companies Market Share
- Kenya Shaft Couplings Competitive Benchmarking By Technical and Operational Parameters
- Kenya Shaft Couplings Company Profiles
- Kenya Shaft Couplings Key Strategic Recommendations
Frequently Asked Questions About the Market Study (FAQs):
The growth is driven by industrialization, infrastructure development, and increasing demand for high-performance machinery in sectors like automotive and manufacturing.
Challenges include the presence of counterfeit products, inconsistent regulation, and a lack of consumer awareness regarding the benefits of high-quality couplings.
Opportunities include developing innovative coupling technologies, focusing on eco-friendly products, and forming strategic partnerships with local businesses.
Government initiatives, including quality control measures and tax incentives, create a favorable environment for local manufacturers and promote sustainable practices.
6Wresearch actively monitors the Kenya Shaft Couplings Market and publishes its comprehensive annual report, highlighting emerging trends, growth drivers, revenue analysis, and forecast outlook. Our insights help businesses to make data-backed strategic decisions with ongoing market dynamics. Our analysts track relevent industries related to the Kenya Shaft Couplings Market, allowing our clients with actionable intelligence and reliable forecasts tailored to emerging regional needs.
Yes, we provide customisation as per your requirements. To learn more, feel free to contact us on sales@6wresearch.com
1 Executive Summary |
2 Introduction |
2.1 Key Highlights of the Report |
2.2 Report Description |
2.3 Market Scope & Segmentation |
2.4 Research Methodology |
2.5 Assumptions |
3 Kenya Shaft Couplings Market Overview |
3.1 Kenya Country Macro Economic Indicators |
3.2 Kenya Shaft Couplings Market Revenues & Volume, 2022 & 2032F |
3.3 Kenya Shaft Couplings Market - Industry Life Cycle |
3.4 Kenya Shaft Couplings Market - Porter's Five Forces |
3.5 Kenya Shaft Couplings Market Revenues & Volume Share, By Type, 2022 & 2032F |
3.6 Kenya Shaft Couplings Market Revenues & Volume Share, By Application, 2022 & 2032F |
4 Kenya Shaft Couplings Market Dynamics |
4.1 Impact Analysis |
4.2 Market Drivers |
4.3 Market Restraints |
5 Kenya Shaft Couplings Market Trends |
6 Kenya Shaft Couplings Market, By Types |
6.1 Kenya Shaft Couplings Market, By Type |
6.1.1 Overview and Analysis |
6.1.2 Kenya Shaft Couplings Market Revenues & Volume, By Type, 2022-2032F |
6.1.3 Kenya Shaft Couplings Market Revenues & Volume, By Flexible Couplings, 2022-2032F |
6.1.4 Kenya Shaft Couplings Market Revenues & Volume, By Disc Rigid Couplings, 2022-2032F |
6.2 Kenya Shaft Couplings Market, By Application |
6.2.1 Overview and Analysis |
6.2.2 Kenya Shaft Couplings Market Revenues & Volume, By Power and Energy, 2022-2032F |
6.2.3 Kenya Shaft Couplings Market Revenues & Volume, By Automotive Industry, 2022-2032F |
6.2.4 Kenya Shaft Couplings Market Revenues & Volume, By Steel Industry, 2022-2032F |
7 Kenya Shaft Couplings Market Import-Export Trade Statistics |
7.1 Kenya Shaft Couplings Market Export to Major Countries |
7.2 Kenya Shaft Couplings Market Imports from Major Countries |
8 Kenya Shaft Couplings Market Key Performance Indicators |
9 Kenya Shaft Couplings Market - Opportunity Assessment |
9.1 Kenya Shaft Couplings Market Opportunity Assessment, By Type, 2022 & 2032F |
9.2 Kenya Shaft Couplings Market Opportunity Assessment, By Application, 2022 & 2032F |
10 Kenya Shaft Couplings Market - Competitive Landscape |
10.1 Kenya Shaft Couplings Market Revenue Share, By Companies, 2025 |
10.2 Kenya Shaft Couplings Market Competitive Benchmarking, By Operating and Technical Parameters |
11 Company Profiles |
12 Recommendations |
13 Disclaimer |
Global Go To Market Strategy - 2030
Export potential enables firms to identify high-growth global markets with greater confidence by combining advanced trade intelligence with a structured quantitative methodology. The framework analyzes emerging demand trends and country-level import patterns while integrating macroeconomic and trade datasets such as GDP and population forecasts, bilateral import–export flows, tariff structures, elasticity differentials between developed and developing economies, geographic distance, and import demand projections. Using weighted trade values from 2020–2024 as the base period to project country-to-country export potential for 2030, these inputs are operationalized through calculated drivers such as gravity model parameters, tariff impact factors, and projected GDP per-capita growth. Through an analysis of hidden potentials, demand hotspots, and market conditions that are most favorable to success, this method enables firms to focus on target countries, maximize returns, and global expansion with data, backed by accuracy.
By factoring in the projected importer demand gap that is currently unmet and could be potential opportunity, it identifies the potential for the Exporter (Country) among 190 countries, against the general trade analysis, which identifies the biggest importer or exporter.
To discover high-growth global markets and optimize your business strategy:
Click Here
Pricing
- Single User License$ 1,995
- Department License$ 2,400
- Site License$ 3,120
- Global License$ 3,795

Leadership Perspectives from Industry Events
Search
Thought Leadership and Analyst Meet


Our Clients
6WResearch In News
- India Air Conditioner Market Set for Strong Rebound in 2026 After Weather-Led Correction and GST-Driven Recovery: 6Wresearch
- ADAS in India: How Automatic Emergency Braking, Blind Spot Detection & Driver Monitoring are Transforming Road Safety
- Doha a strategic location for EV manufacturing hub: IPA Qatar
- Demand for luxury TVs surging in the GCC, says Samsung
- Empowering Growth: The Thriving Journey of Bangladesh’s Cable Industry
- Demand for luxury TVs surging in the GCC, says Samsung
Latest Reports
- Poland Fire Protection Systems Market (2026-2032)
- Cape Verde Portable Hand-Thrown Extinguisher Market (2026-2032)
- Canada Portable Hand-Thrown Extinguisher Market (2026-2032)
- Cameroon Portable Hand-Thrown Extinguisher Market (2026-2032)
- Burundi Portable Hand-Thrown Extinguisher Market (2026-2032)
- Burkina Faso Portable Hand-Thrown Extinguisher Market (2026-2032)
- Bulgaria Portable Hand-Thrown Extinguisher Market (2026-2032)
- Brunei Portable Hand-Thrown Extinguisher Market (2026-2032)
- Botswana Portable Hand-Thrown Extinguisher Market (2026-2032)
- Bosnia and Herzegovina Portable Hand-Thrown Extinguisher Market (2026-2032)
Industry Events and Analyst Meet

HIMTEX 2026

India Refining Summit 2026

India EV Show 2026

EV tech India Expo 2026

Auto Tech Asia 2026
Whitepaper
- Middle East & Africa Commercial Security Market Click here to view more.
- Middle East & Africa Fire Safety Systems & Equipment Market Click here to view more.
- GCC Drone Market Click here to view more.
- Middle East Lighting Fixture Market Click here to view more.
- GCC Physical & Perimeter Security Market Click here to view more.