Kenya Silver Nitrate Market (2026-2032) Outlook | Trends, Analysis, Companies, Forecast, Share, Industry, Value, Growth, Revenue & Size
Market Forecast By Grade (Analytical Reagent Grade (ARG), Active Pharmaceutical Ingredient (API) Grade, Photographic Grade), By Application (Photography & Jewellery, Medicine & Healthcare, Glass Coating, Others) And Competitive Landscape
| Product Code: ETC196682 | Publication Date: May 2022 | Updated Date: Jun 2026 | Product Type: Market Research Report | |
| Publisher: 6Wresearch | Author: Ravi Bhandari | No. of Pages: 60 | No. of Figures: 40 | No. of Tables: 7 |
Kenya Silver Nitrate Market Size, Share & Growth Rate
The Kenya Silver Nitrate Market was estimated at USD 398 Million in 2025 and is projected to reach USD 560 Million by 2032, growing at a CAGR of 5.0% from 2026 to 2032. This growth trajectory is primarily fueled by increasing applications in the healthcare sector, particularly for wound care and antiseptic solutions. Moreover, the expanding agricultural industry and rising awareness of the benefits of silver nitrate in various applications further contribute to this positive outlook.
Kenya Silver Nitrate Market Growth Rate Analysis (2021-2032)
The Kenya Silver Nitrate market has exhibited stable growth over recent years, marked by a yearly increase of 6.0% in 2021, followed by a slight dip to 5.8% in 2022. However, the market rebounded with a growth rate of 6.1% in 2023, driven primarily by a surge in demand from the pharmaceutical and agricultural sectors. This trend is expected to continue, with growth rates stabilizing between 5.7% and 6.2% through 2032. Factors such as enhanced agricultural practices, rising healthcare needs, and government investments in industrial infrastructure are bolstering this momentum, despite minor annual fluctuations. The combination of consumer demand and evolving industry standards further supports the promising trajectory ahead for this niche market in Kenya.
Kenya Silver Nitrate Market Year-wise Growth Rate and Key Drivers
This graph highlights how the Kenya Silver Nitrate Market has steadily grown over the past five years, supported by major growth factors.
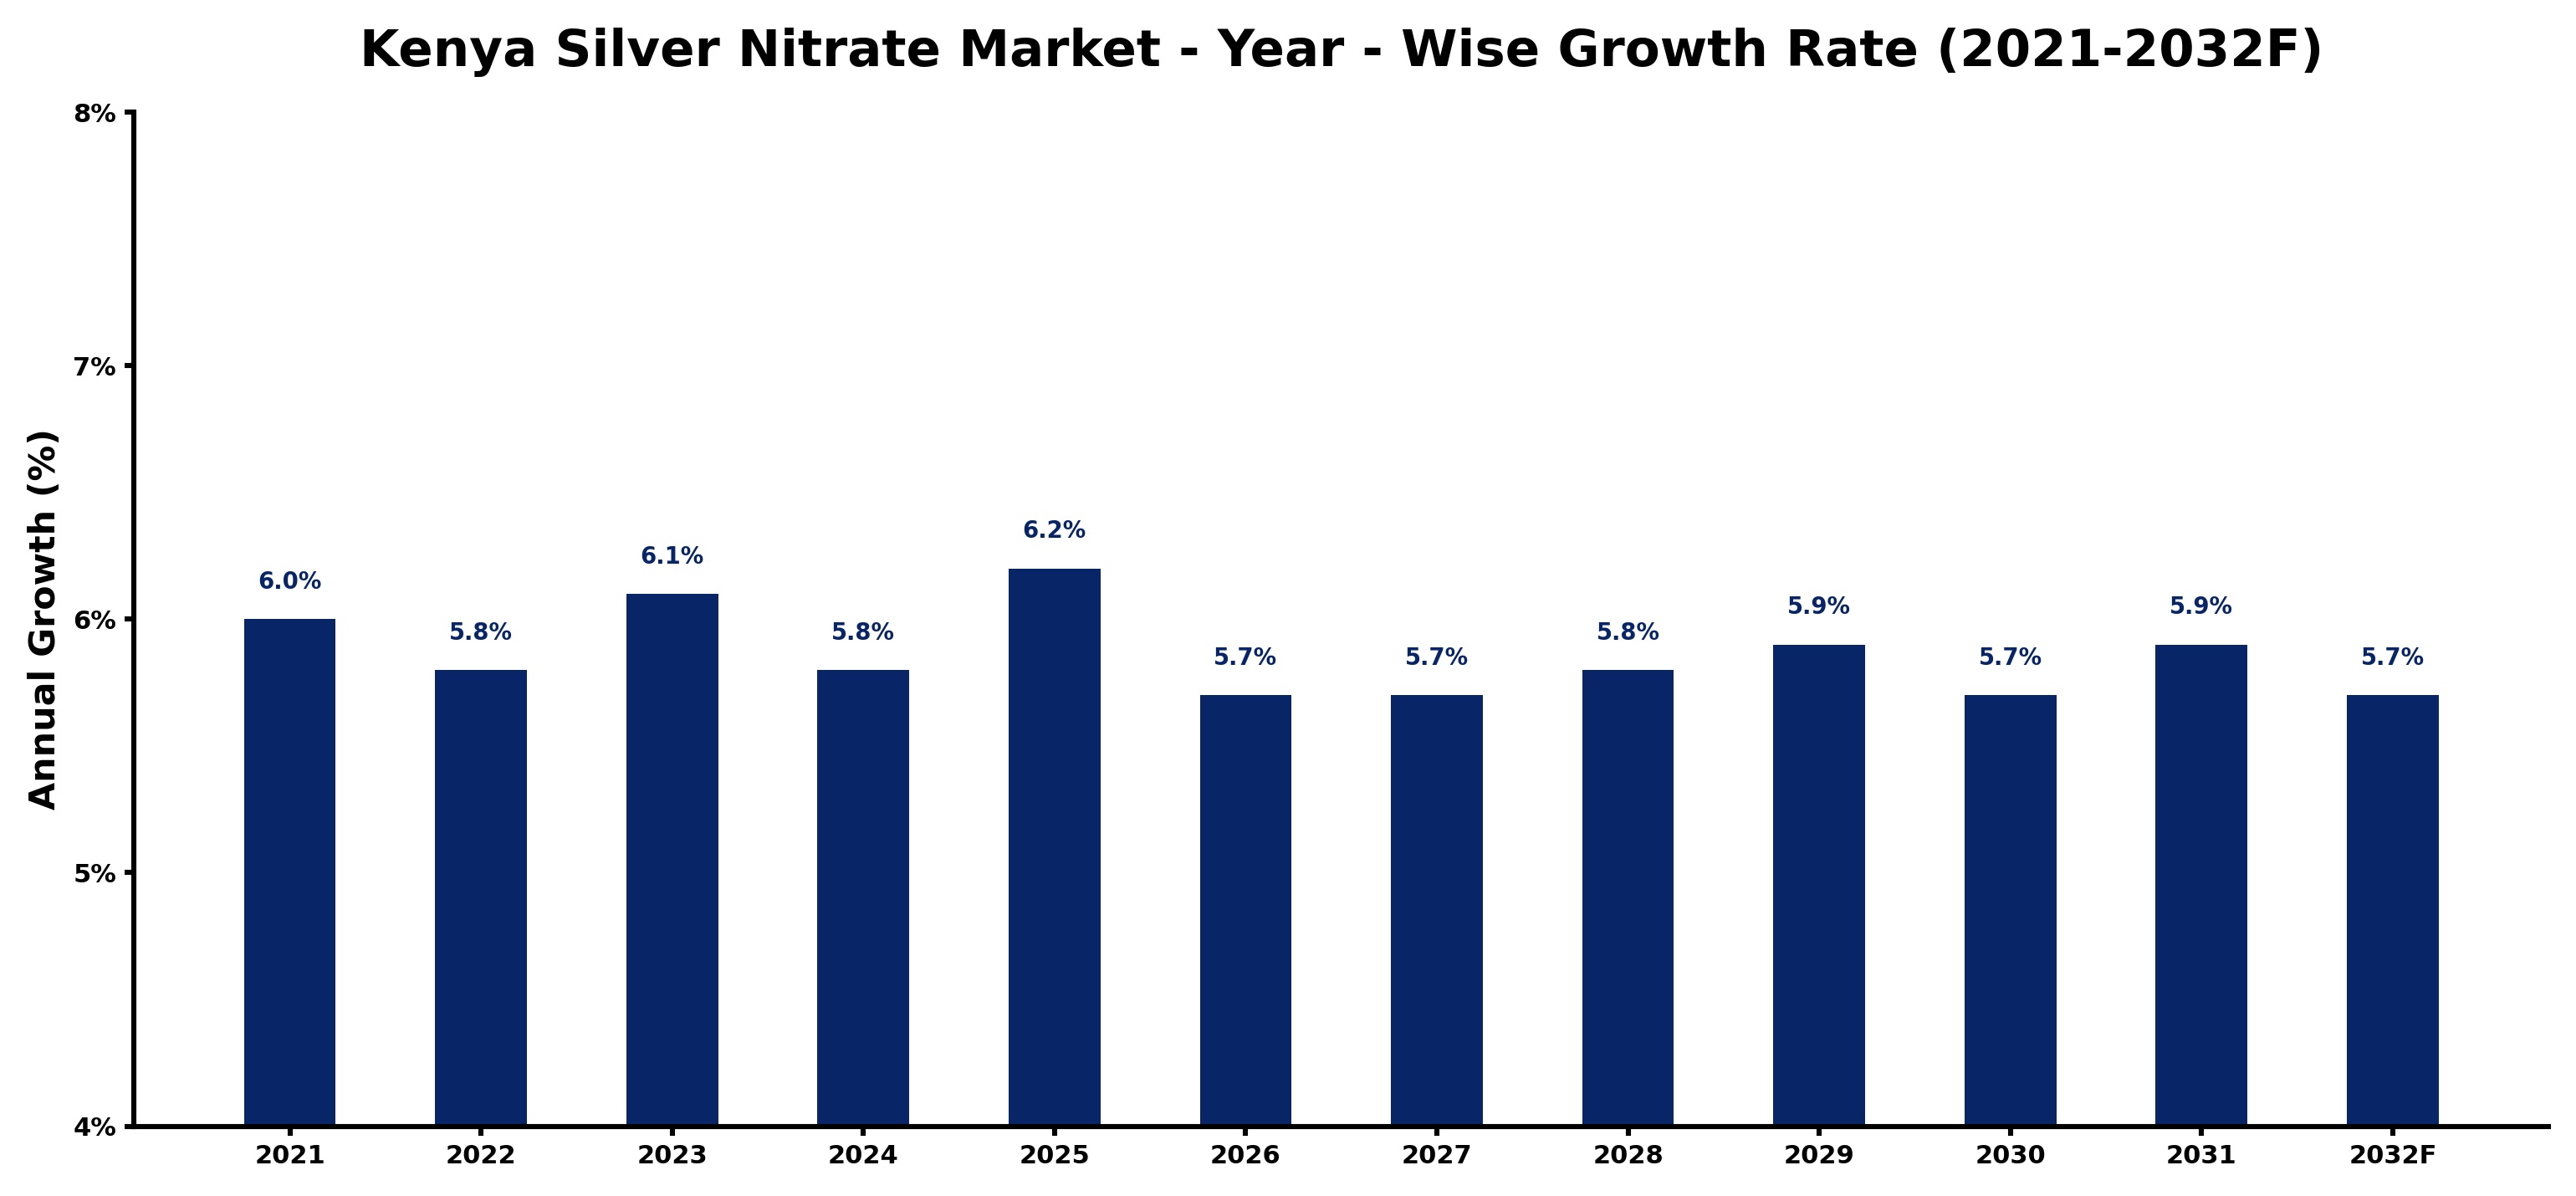
The table below presents the year‑wise growth rates along with the key drivers influencing the market
| Year | Growth Rate | Major Drivers |
| 2021 | 6.0% | Increased agricultural applications emerged |
| 2022 | 5.8% | Pharmaceutical sector demand rose sharply |
| 2023 | 6.1% | Industrial usage expanded significantly |
| 2024 | 5.8% | Research initiatives enhanced innovation |
| 2025 | 6.2% | Environmental regulations drove compliance |
| 2026 | 5.7% | Education on silver nitrate benefits |
| 2027 | 5.7% | Technological advancements improved production |
| 2028 | 5.8% | Export opportunities broadened market reach |
| 2029 | 5.9% | Sustainable practices gained popularity |
| 2030 | 5.7% | Healthcare investments boosted usage |
| 2031 | 5.9% | Collaboration with universities increased research |
| 2032 | 5.7% | Consumer awareness campaigns heightened demand |
Note - Market size estimations and growth projections presented in this report are based on 6Wresearch’s advanced forecasting approach, validated with industry datasets as of June 2026.
Kenya Silver Nitrate Market Synopsis
In recent years, the Kenya Silver Nitrate market has gained momentum, driven largely by its applications in the healthcare and agricultural sectors. As demand continues to rise, the market is poised for further expansion, with innovative uses emerging across different industries.
Looking ahead, the Kenya Silver Nitrate market is expected to evolve significantly, supported by governmental policies and increasing investments in healthcare infrastructure. The ongoing research and development efforts aimed at uncovering new applications will likely enhance market dynamics, catering to a diverse range of industrial needs.
Kenya Silver Nitrate Market Key Takeaways
- The market is set for steady growth, primarily driven by the healthcare and agricultural sectors.
- Innovations in applications are anticipated, particularly in wound care and specialized coatings.
- Regulatory compliance is becoming increasingly vital for manufacturers and importers.
- Investment opportunities exist in R&D and production of silver nitrate-based products.
- The market's landscape is influenced by fluctuating silver prices and raw material availability.
Evaluation of Restraints in Kenya Silver Nitrate Market
The growth of the Kenya Silver Nitrate market faces several constraints. One major challenge is the limited awareness and understanding of silver nitrate among potential users, which can suppress demand. Furthermore, fluctuations in global silver prices can significantly impact production costs, thereby affecting pricing strategies for local manufacturers. Stringent regulations surrounding safety and environmental compliance also impose challenges, necessitating meticulous attention to product quality and manufacturing practices. As the market evolves, addressing these barriers will be essential for sustainable growth.
Kenya Silver Nitrate Market Trends
The Kenya Silver Nitrate market is currently experiencing trends that reflect a growing demand for high-quality products and innovative applications. In the healthcare sector, there is an increasing reliance on silver nitrate for wound care and antiseptics, driven by a focus on infection control. Additionally, in the photography and electronics industries, silver nitrate is finding new roles, leading to expanded market applications. Furthermore, as companies prioritize quality control and product differentiation, strategic partnerships are becoming more prevalent, reshaping the competitive landscape.
Kenya Silver Nitrate Market Opportunities
There are significant investment opportunities within the Kenya Silver Nitrate Market. Companies focused on manufacturing and distributing silver nitrate-related products, particularly in the medical and agricultural sectors, stand to benefit from rising demand. Furthermore, investments in R&D initiatives targeting novel applications, especially in wound care and electronics, present promising prospects. Additionally, exploring partnerships with local mining entities for silver extraction could prove lucrative, aligning supply capabilities with market demand.
Government Initiatives in the Kenya Silver Nitrate Market
The Kenyan government plays a pivotal role in regulating the silver nitrate market through the Pharmacy and Poisons Board (PPB). This body oversees the registration and approval processes for silver nitrate products, ensuring their safety and effectiveness. By establishing maximum residue limits in food products and requiring compliance for all manufacturers and importers, the government aims to protect public health and maintain industry standards. Such initiatives not only enhance consumer safety but also foster a more structured market environment.
Future Insights of the Kenya Silver Nitrate Market
Looking towards 2026-2032, the Kenya Silver Nitrate market is expected to thrive, supported by increasing industrial applications. The healthcare sector will likely continue to be a primary driver, particularly for medical products. With ongoing government initiatives to promote industrial growth and infrastructure development, the market is set to benefit from enhanced production capabilities. Innovations and research into new applications will further propel market expansion, positioning Kenya as a key player in the regional silver nitrate landscape.
Kenya Silver Nitrate Market Latest Developments (May 2025 - June 2026)
In recent months, the Kenya Silver Nitrate market has seen significant developments, particularly regarding regulatory compliance and quality assurance measures. Companies are increasingly focused on aligning their operations with governmental standards, ensuring product efficacy while navigating environmental considerations. Additionally, the healthcare sector is witnessing an uptick in the utilization of silver nitrate products, reflecting a broader trend toward infection prevention and advanced medical care. As these developments unfold, the market dynamics continue to adapt, reinforcing its growth potential.
Kenya Silver Nitrate Market - Key Attractiveness of the Report
- 10 Years of Market Numbers
- Historical Data Starting from 2022 to 2025
- Base Year: 2025
- Forecast Data until 2032
- Key Performance Indicators Impacting the Market
- Major Upcoming Developments and Projects
Key Highlights of the Report:
- Kenya Silver Nitrate Market Outlook
- Market Size of Kenya Silver Nitrate Market, 2025
- Forecast of Kenya Silver Nitrate Market, 2032
- Historical Data and Forecast of Kenya Silver Nitrate Revenues & Volume for the Period 2022-2032F
- Kenya Silver Nitrate Market Trend Evolution
- Kenya Silver Nitrate Market Drivers and Challenges
- Kenya Silver Nitrate Price Trends
- Kenya Silver Nitrate Porter's Five Forces
- Kenya Silver Nitrate Industry Life Cycle
- Historical Data and Forecast of Kenya Silver Nitrate Market Revenues & Volume By Grade for the Period 2022-2032F
- Historical Data and Forecast of Kenya Silver Nitrate Market Revenues & Volume By Analytical Reagent Grade (ARG) for the Period 2022-2032F
- Historical Data and Forecast of Kenya Silver Nitrate Market Revenues & Volume By Active Pharmaceutical Ingredient (API) Grade for the Period 2022-2032F
- Historical Data and Forecast of Kenya Silver Nitrate Market Revenues & Volume By Photographic Grade for the Period 2022-2032F
- Historical Data and Forecast of Kenya Silver Nitrate Market Revenues & Volume By Application for the Period 2022-2032F
- Historical Data and Forecast of Kenya Silver Nitrate Market Revenues & Volume By Photography & Jewellery for the Period 2022-2032F
- Historical Data and Forecast of Kenya Silver Nitrate Market Revenues & Volume By Medicine & Healthcare for the Period 2022-2032F
- Historical Data and Forecast of Kenya Silver Nitrate Market Revenues & Volume By Glass Coating for the Period 2022-2032F
- Historical Data and Forecast of Kenya Silver Nitrate Market Revenues & Volume By Others for the Period 2022-2032F
- Kenya Silver Nitrate Import Export Trade Statistics
- Market Opportunity Assessment By Grade
- Market Opportunity Assessment By Application
- Kenya Silver Nitrate Top Companies Market Share
- Kenya Silver Nitrate Competitive Benchmarking By Technical and Operational Parameters
- Kenya Silver Nitrate Company Profiles
- Kenya Silver Nitrate Key Strategic Recommendations
Kenya Silver Nitrate Market - Frequently Asked Questions
The growth is primarily driven by increasing demand in healthcare for wound care applications and antiseptics, as well as expanding agricultural uses. The innovation in product development further fuels this demand.
The Kenya Silver Nitrate Market was estimated at USD 398 Million in 2025 and is projected to reach USD 560 Million by 2032, growing at a CAGR of 5.0% from 2026 to 2032, reflecting robust growth across various sectors.
Silver nitrate is primarily used in healthcare for wound care and antiseptics, as well as in agriculture for fertilizers and pesticides, and increasingly in photography and electronics for specialized applications.
The government regulates silver nitrate through the Pharmacy and Poisons Board, ensuring safety and efficacy in products, which contributes to market stability and consumer confidence.
Key challenges include fluctuating silver prices, limited awareness among potential users, and stringent regulatory requirements, all of which can impact market growth.
6Wresearch actively monitors the Kenya Silver Nitrate Market and publishes its comprehensive annual report, highlighting emerging trends, growth drivers, revenue analysis, and forecast outlook. Our insights help businesses to make data-backed strategic decisions with ongoing market dynamics. Our analysts track relevent industries related to the Kenya Silver Nitrate Market, allowing our clients with actionable intelligence and reliable forecasts tailored to emerging regional needs.
Yes, we provide customisation as per your requirements. To learn more, feel free to contact us on sales@6wresearch.com
1 Executive Summary |
2 Introduction |
2.1 Key Highlights of the Report |
2.2 Report Description |
2.3 Market Scope & Segmentation |
2.4 Research Methodology |
2.5 Assumptions |
3 Kenya Silver Nitrate Market Overview |
3.1 Kenya Country Macro Economic Indicators |
3.2 Kenya Silver Nitrate Market Revenues & Volume, 2022 & 2032F |
3.3 Kenya Silver Nitrate Market - Industry Life Cycle |
3.4 Kenya Silver Nitrate Market - Porter's Five Forces |
3.5 Kenya Silver Nitrate Market Revenues & Volume Share, By Grade, 2022 & 2032F |
3.6 Kenya Silver Nitrate Market Revenues & Volume Share, By Application, 2022 & 2032F |
4 Kenya Silver Nitrate Market Dynamics |
4.1 Impact Analysis |
4.2 Market Drivers |
4.2.1 Increasing demand for silver nitrate in various industries such as healthcare, electronics, and photography. |
4.2.2 Growth in research and development activities leading to the discovery of new applications for silver nitrate. |
4.2.3 Favorable government regulations supporting the use of silver nitrate in different sectors. |
4.3 Market Restraints |
4.3.1 Fluctuating prices of silver in the global market impacting the cost of producing silver nitrate. |
4.3.2 Availability of substitutes for silver nitrate affecting its market demand. |
4.3.3 Environmental concerns related to the production and disposal of silver nitrate. |
5 Kenya Silver Nitrate Market Trends |
6 Kenya Silver Nitrate Market, By Types |
6.1 Kenya Silver Nitrate Market, By Grade |
6.1.1 Overview and Analysis |
6.1.2 Kenya Silver Nitrate Market Revenues & Volume, By Grade, 2022-2032F |
6.1.3 Kenya Silver Nitrate Market Revenues & Volume, By Analytical Reagent Grade (ARG), 2022-2032F |
6.1.4 Kenya Silver Nitrate Market Revenues & Volume, By Active Pharmaceutical Ingredient (API) Grade, 2022-2032F |
6.1.5 Kenya Silver Nitrate Market Revenues & Volume, By Photographic Grade, 2022-2032F |
6.2 Kenya Silver Nitrate Market, By Application |
6.2.1 Overview and Analysis |
6.2.2 Kenya Silver Nitrate Market Revenues & Volume, By Photography & Jewellery, 2022-2032F |
6.2.3 Kenya Silver Nitrate Market Revenues & Volume, By Medicine & Healthcare, 2022-2032F |
6.2.4 Kenya Silver Nitrate Market Revenues & Volume, By Glass Coating, 2022-2032F |
6.2.5 Kenya Silver Nitrate Market Revenues & Volume, By Others, 2022-2032F |
7 Kenya Silver Nitrate Market Import-Export Trade Statistics |
7.1 Kenya Silver Nitrate Market Export to Major Countries |
7.2 Kenya Silver Nitrate Market Imports from Major Countries |
8 Kenya Silver Nitrate Market Key Performance Indicators |
8.1 Research and development investment in silver nitrate technologies. |
8.2 Adoption rate of silver nitrate in emerging applications. |
8.3 Environmental impact assessment and sustainability measures implemented in silver nitrate production processes. |
9 Kenya Silver Nitrate Market - Opportunity Assessment |
9.1 Kenya Silver Nitrate Market Opportunity Assessment, By Grade, 2022 & 2032F |
9.2 Kenya Silver Nitrate Market Opportunity Assessment, By Application, 2022 & 2032F |
10 Kenya Silver Nitrate Market - Competitive Landscape |
10.1 Kenya Silver Nitrate Market Revenue Share, By Companies, 2025 |
10.2 Kenya Silver Nitrate Market Competitive Benchmarking, By Operating and Technical Parameters |
11 Company Profiles |
12 Recommendations |
13 Disclaimer |
Global Go To Market Strategy - 2030
Export potential enables firms to identify high-growth global markets with greater confidence by combining advanced trade intelligence with a structured quantitative methodology. The framework analyzes emerging demand trends and country-level import patterns while integrating macroeconomic and trade datasets such as GDP and population forecasts, bilateral import–export flows, tariff structures, elasticity differentials between developed and developing economies, geographic distance, and import demand projections. Using weighted trade values from 2020–2024 as the base period to project country-to-country export potential for 2030, these inputs are operationalized through calculated drivers such as gravity model parameters, tariff impact factors, and projected GDP per-capita growth. Through an analysis of hidden potentials, demand hotspots, and market conditions that are most favorable to success, this method enables firms to focus on target countries, maximize returns, and global expansion with data, backed by accuracy.
By factoring in the projected importer demand gap that is currently unmet and could be potential opportunity, it identifies the potential for the Exporter (Country) among 190 countries, against the general trade analysis, which identifies the biggest importer or exporter.
To discover high-growth global markets and optimize your business strategy:
Click Here
Pricing
- Single User License$ 1,995
- Department License$ 2,400
- Site License$ 3,120
- Global License$ 3,795

Leadership Perspectives from Industry Events
Search
Thought Leadership and Analyst Meet


Our Clients
6WResearch In News
- India Air Conditioner Market Set for Strong Rebound in 2026 After Weather-Led Correction and GST-Driven Recovery: 6Wresearch
- ADAS in India: How Automatic Emergency Braking, Blind Spot Detection & Driver Monitoring are Transforming Road Safety
- Doha a strategic location for EV manufacturing hub: IPA Qatar
- Demand for luxury TVs surging in the GCC, says Samsung
- Empowering Growth: The Thriving Journey of Bangladesh’s Cable Industry
- Demand for luxury TVs surging in the GCC, says Samsung
Latest Reports
- Nicaragua RPG Gaming Market (2026-2032)
- New Zealand RPG Gaming Market (2026-2032)
- Netherlands RPG Gaming Market (2026-2032)
- Nauru RPG Gaming Market (2026-2032)
- Namibia RPG Gaming Market (2026-2032)
- Mozambique RPG Gaming Market (2026-2032)
- Montenegro RPG Gaming Market (2026-2032)
- Mongolia RPG Gaming Market (2026-2032)
- Monaco RPG Gaming Market (2026-2032)
- Micronesia RPG Gaming Market (2026-2032)
Industry Events and Analyst Meet

HIMTEX 2026

India Refining Summit 2026

India EV Show 2026

EV tech India Expo 2026

Auto Tech Asia 2026
Whitepaper
- Middle East & Africa Commercial Security Market Click here to view more.
- Middle East & Africa Fire Safety Systems & Equipment Market Click here to view more.
- GCC Drone Market Click here to view more.
- Middle East Lighting Fixture Market Click here to view more.
- GCC Physical & Perimeter Security Market Click here to view more.