Kenya Snap-on Closures Market (2026-2032) | Industry, Companies, Share, Forecast, Value, Trends, Size & Revenue, Competitive Landscape, Analysis, Outlook, Segmentation, Growth
Market Forecast By Type (Bottles, Tubes, Jars, Vials, Can & Containers), By Material (Polyethylene terephthalate (PET), Polyvinyl chloride (PVC), High-density polyethylene (HDPE))), By Closure Type (Flip Top, Bottle Stopper, Twist off Cap), By Diameter (Up to 24 mm, 24-34 mm, 34-44 mm, Above 44 mm), By End-User (Liquid soap, Oil products, Liquid soap, Shampoo, Lotion and Cream) And Competitive Landscape
| Product Code: ETC7813625 | Publication Date: Sep 2024 | Updated Date: Feb 2026 | Product Type: Market Research Report | |
| Publisher: 6Wresearch | Author: Summon Dutta | No. of Pages: 75 | No. of Figures: 35 | No. of Tables: 20 |
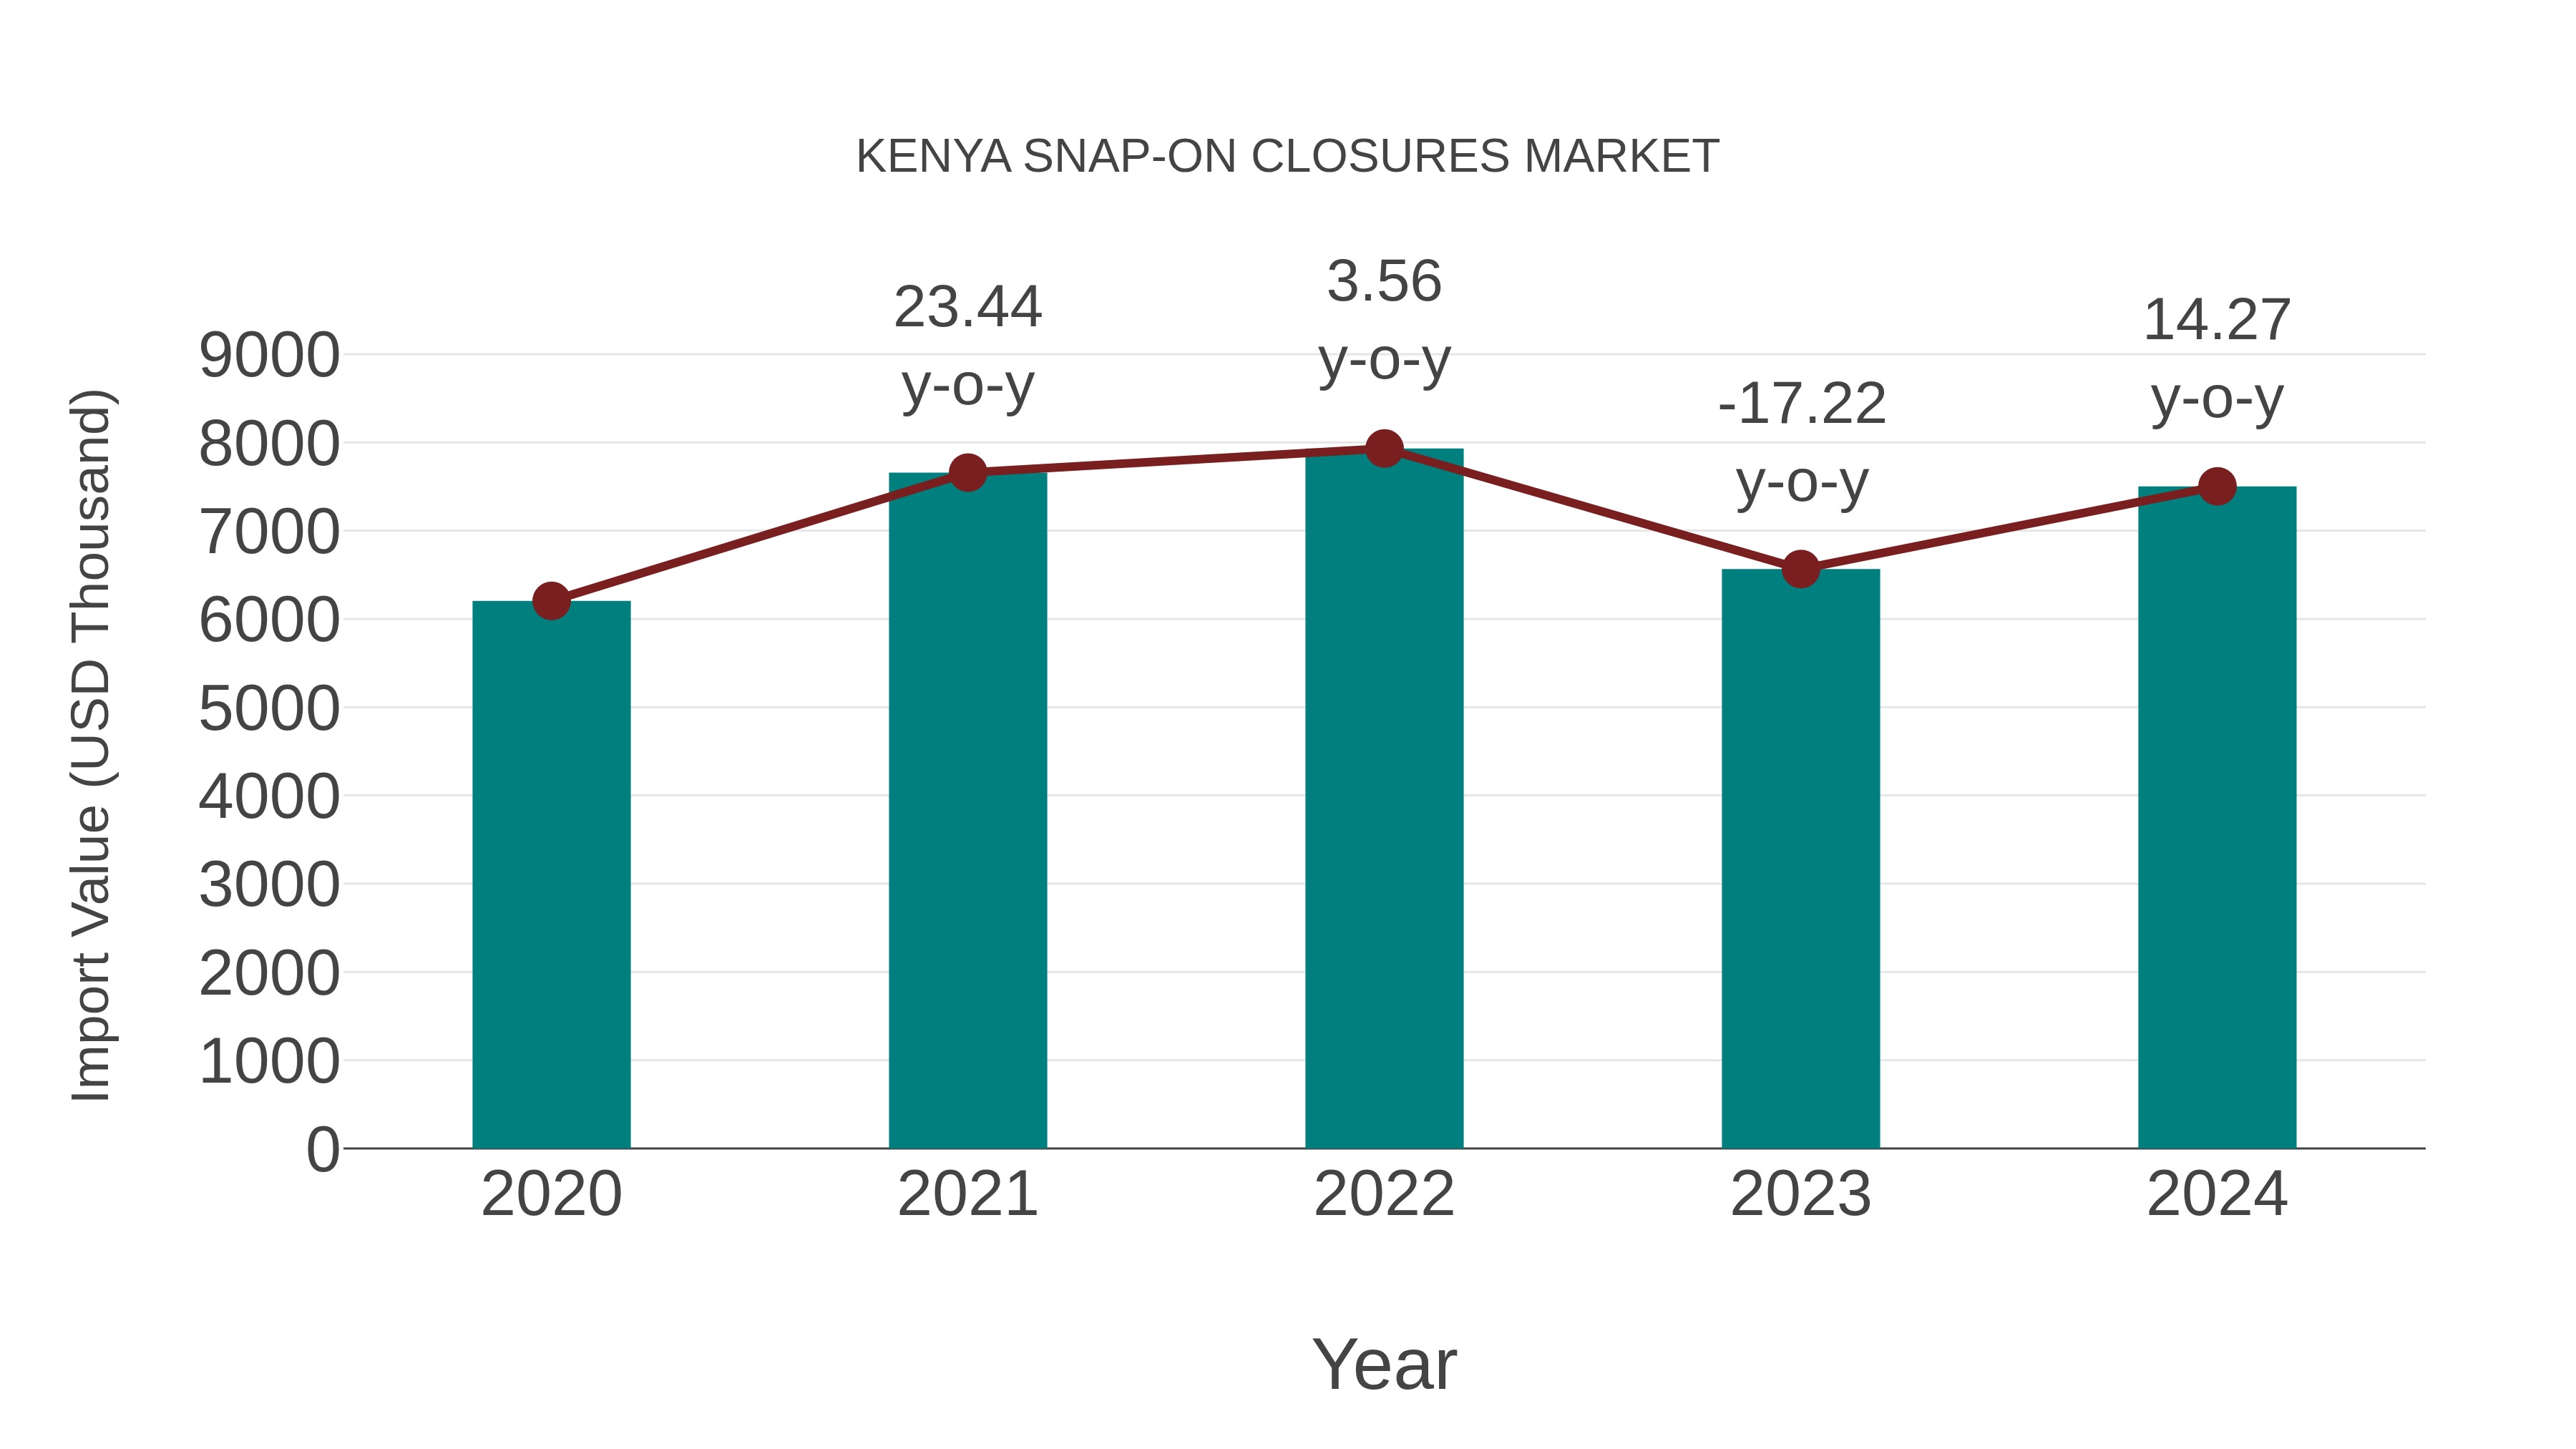
Kenya Snap-on Closures Market: Import Trend Analysis
In the past year, the import trend for Kenya Snap-On Closures market in Kenya showed a consistent increase. This was driven by growing demand for packaging solutions in various industries within the country.
Key Highlights of the Report:
- Kenya Snap-on Closures Market Outlook
- Market Size of Kenya Snap-on Closures Market, 2025
- Forecast of Kenya Snap-on Closures Market, 2032
- Historical Data and Forecast of Kenya Snap-on Closures Revenues & Volume for the Period 2022-2032F
- Kenya Snap-on Closures Market Trend Evolution
- Kenya Snap-on Closures Market Drivers and Challenges
- Kenya Snap-on Closures Price Trends
- Kenya Snap-on Closures Porter's Five Forces
- Kenya Snap-on Closures Industry Life Cycle
- Historical Data and Forecast of Kenya Snap-on Closures Market Revenues & Volume By Type for the Period 2022-2032F
- Historical Data and Forecast of Kenya Snap-on Closures Market Revenues & Volume By Bottles for the Period 2022-2032F
- Historical Data and Forecast of Kenya Snap-on Closures Market Revenues & Volume By Tubes for the Period 2022-2032F
- Historical Data and Forecast of Kenya Snap-on Closures Market Revenues & Volume By Jars for the Period 2022-2032F
- Historical Data and Forecast of Kenya Snap-on Closures Market Revenues & Volume By Vials for the Period 2022-2032F
- Historical Data and Forecast of Kenya Snap-on Closures Market Revenues & Volume By Can & Containers for the Period 2022-2032F
- Historical Data and Forecast of Kenya Snap-on Closures Market Revenues & Volume By Material for the Period 2022-2032F
- Historical Data and Forecast of Kenya Snap-on Closures Market Revenues & Volume By Polyethylene terephthalate (PET) for the Period 2022-2032F
- Historical Data and Forecast of Kenya Snap-on Closures Market Revenues & Volume By Polyvinyl chloride (PVC) for the Period 2022-2032F
- Historical Data and Forecast of Kenya Snap-on Closures Market Revenues & Volume By High-density polyethylene (HDPE)) for the Period 2022-2032F
- Historical Data and Forecast of Kenya Snap-on Closures Market Revenues & Volume By Closure Type for the Period 2022-2032F
- Historical Data and Forecast of Kenya Snap-on Closures Market Revenues & Volume By Flip Top for the Period 2022-2032F
- Historical Data and Forecast of Kenya Snap-on Closures Market Revenues & Volume By Bottle Stopper for the Period 2022-2032F
- Historical Data and Forecast of Kenya Snap-on Closures Market Revenues & Volume By Twist off Cap for the Period 2022-2032F
- Historical Data and Forecast of Kenya Snap-on Closures Market Revenues & Volume By Diameter for the Period 2022-2032F
- Historical Data and Forecast of Kenya Snap-on Closures Market Revenues & Volume By Up to 24 mm for the Period 2022-2032F
- Historical Data and Forecast of Kenya Snap-on Closures Market Revenues & Volume By 24-34 mm for the Period 2022-2032F
- Historical Data and Forecast of Kenya Snap-on Closures Market Revenues & Volume By 34-44 mm for the Period 2022-2032F
- Historical Data and Forecast of Kenya Snap-on Closures Market Revenues & Volume By Above 44 mm for the Period 2022-2032F
- Historical Data and Forecast of Kenya Snap-on Closures Market Revenues & Volume By End-User for the Period 2022-2032F
- Historical Data and Forecast of Kenya Snap-on Closures Market Revenues & Volume By Liquid soap for the Period 2022-2032F
- Historical Data and Forecast of Kenya Snap-on Closures Market Revenues & Volume By Oil products for the Period 2022-2032F
- Historical Data and Forecast of Kenya Snap-on Closures Market Revenues & Volume By Liquid soap for the Period 2022-2032F
- Historical Data and Forecast of Kenya Snap-on Closures Market Revenues & Volume By Shampoo for the Period 2022-2032F
- Historical Data and Forecast of Kenya Snap-on Closures Market Revenues & Volume By Lotion and Cream for the Period 2022-2032F
- Kenya Snap-on Closures Import Export Trade Statistics
- Market Opportunity Assessment By Type
- Market Opportunity Assessment By Material
- Market Opportunity Assessment By Closure Type
- Market Opportunity Assessment By Diameter
- Market Opportunity Assessment By End-User
- Kenya Snap-on Closures Top Companies Market Share
- Kenya Snap-on Closures Competitive Benchmarking By Technical and Operational Parameters
- Kenya Snap-on Closures Company Profiles
- Kenya Snap-on Closures Key Strategic Recommendations
Frequently Asked Questions About the Market Study (FAQs):
6Wresearch actively monitors the Kenya Snap-on Closures Market and publishes its comprehensive annual report, highlighting emerging trends, growth drivers, revenue analysis, and forecast outlook. Our insights help businesses to make data-backed strategic decisions with ongoing market dynamics. Our analysts track relevent industries related to the Kenya Snap-on Closures Market, allowing our clients with actionable intelligence and reliable forecasts tailored to emerging regional needs.
Yes, we provide customisation as per your requirements. To learn more, feel free to contact us on sales@6wresearch.com
1 Executive Summary |
2 Introduction |
2.1 Key Highlights of the Report |
2.2 Report Description |
2.3 Market Scope & Segmentation |
2.4 Research Methodology |
2.5 Assumptions |
3 Kenya Snap-on Closures Market Overview |
3.1 Kenya Country Macro Economic Indicators |
3.2 Kenya Snap-on Closures Market Revenues & Volume, 2022 & 2032F |
3.3 Kenya Snap-on Closures Market - Industry Life Cycle |
3.4 Kenya Snap-on Closures Market - Porter's Five Forces |
3.5 Kenya Snap-on Closures Market Revenues & Volume Share, By Type, 2022 & 2032F |
3.6 Kenya Snap-on Closures Market Revenues & Volume Share, By Material, 2022 & 2032F |
3.7 Kenya Snap-on Closures Market Revenues & Volume Share, By Closure Type, 2022 & 2032F |
3.8 Kenya Snap-on Closures Market Revenues & Volume Share, By Diameter, 2022 & 2032F |
3.9 Kenya Snap-on Closures Market Revenues & Volume Share, By End-User, 2022 & 2032F |
4 Kenya Snap-on Closures Market Dynamics |
4.1 Impact Analysis |
4.2 Market Drivers |
4.2.1 Increasing demand for convenient packaging solutions |
4.2.2 Growing popularity of ready-to-drink beverages in Kenya |
4.2.3 Rise in disposable income leading to higher consumption of packaged products |
4.3 Market Restraints |
4.3.1 Intense competition from alternative packaging solutions like screw caps and twist-off closures |
4.3.2 Price volatility of raw materials used in snap-on closures production |
4.3.3 Stringent regulations on packaging materials and processes in Kenya |
5 Kenya Snap-on Closures Market Trends |
6 Kenya Snap-on Closures Market, By Types |
6.1 Kenya Snap-on Closures Market, By Type |
6.1.1 Overview and Analysis |
6.1.2 Kenya Snap-on Closures Market Revenues & Volume, By Type, 2022-2032F |
6.1.3 Kenya Snap-on Closures Market Revenues & Volume, By Bottles, 2022-2032F |
6.1.4 Kenya Snap-on Closures Market Revenues & Volume, By Tubes, 2022-2032F |
6.1.5 Kenya Snap-on Closures Market Revenues & Volume, By Jars, 2022-2032F |
6.1.6 Kenya Snap-on Closures Market Revenues & Volume, By Vials, 2022-2032F |
6.1.7 Kenya Snap-on Closures Market Revenues & Volume, By Can & Containers, 2022-2032F |
6.2 Kenya Snap-on Closures Market, By Material |
6.2.1 Overview and Analysis |
6.2.2 Kenya Snap-on Closures Market Revenues & Volume, By Polyethylene terephthalate (PET), 2022-2032F |
6.2.3 Kenya Snap-on Closures Market Revenues & Volume, By Polyvinyl chloride (PVC), 2022-2032F |
6.2.4 Kenya Snap-on Closures Market Revenues & Volume, By High-density polyethylene (HDPE)), 2022-2032F |
6.3 Kenya Snap-on Closures Market, By Closure Type |
6.3.1 Overview and Analysis |
6.3.2 Kenya Snap-on Closures Market Revenues & Volume, By Flip Top, 2022-2032F |
6.3.3 Kenya Snap-on Closures Market Revenues & Volume, By Bottle Stopper, 2022-2032F |
6.3.4 Kenya Snap-on Closures Market Revenues & Volume, By Twist off Cap, 2022-2032F |
6.4 Kenya Snap-on Closures Market, By Diameter |
6.4.1 Overview and Analysis |
6.4.2 Kenya Snap-on Closures Market Revenues & Volume, By Up to 24 mm, 2022-2032F |
6.4.3 Kenya Snap-on Closures Market Revenues & Volume, By 24-34 mm, 2022-2032F |
6.4.4 Kenya Snap-on Closures Market Revenues & Volume, By 34-44 mm, 2022-2032F |
6.4.5 Kenya Snap-on Closures Market Revenues & Volume, By Above 44 mm, 2022-2032F |
6.5 Kenya Snap-on Closures Market, By End-User |
6.5.1 Overview and Analysis |
6.5.2 Kenya Snap-on Closures Market Revenues & Volume, By Liquid soap, 2022-2032F |
6.5.3 Kenya Snap-on Closures Market Revenues & Volume, By Oil products, 2022-2032F |
6.5.4 Kenya Snap-on Closures Market Revenues & Volume, By Liquid soap, 2022-2032F |
6.5.5 Kenya Snap-on Closures Market Revenues & Volume, By Shampoo, 2022-2032F |
6.5.6 Kenya Snap-on Closures Market Revenues & Volume, By Lotion and Cream, 2022-2032F |
7 Kenya Snap-on Closures Market Import-Export Trade Statistics |
7.1 Kenya Snap-on Closures Market Export to Major Countries |
7.2 Kenya Snap-on Closures Market Imports from Major Countries |
8 Kenya Snap-on Closures Market Key Performance Indicators |
8.1 Customer satisfaction scores related to the ease of use of snap-on closures |
8.2 Percentage of repeat purchases of products using snap-on closures |
8.3 Rate of adoption of innovative snap-on closure designs in the market. |
9 Kenya Snap-on Closures Market - Opportunity Assessment |
9.1 Kenya Snap-on Closures Market Opportunity Assessment, By Type, 2022 & 2032F |
9.2 Kenya Snap-on Closures Market Opportunity Assessment, By Material, 2022 & 2032F |
9.3 Kenya Snap-on Closures Market Opportunity Assessment, By Closure Type, 2022 & 2032F |
9.4 Kenya Snap-on Closures Market Opportunity Assessment, By Diameter, 2022 & 2032F |
9.5 Kenya Snap-on Closures Market Opportunity Assessment, By End-User, 2022 & 2032F |
10 Kenya Snap-on Closures Market - Competitive Landscape |
10.1 Kenya Snap-on Closures Market Revenue Share, By Companies, 2025 |
10.2 Kenya Snap-on Closures Market Competitive Benchmarking, By Operating and Technical Parameters |
11 Company Profiles |
12 Recommendations |
13 Disclaimer |
Global Go To Market Strategy - 2030
Export potential enables firms to identify high-growth global markets with greater confidence by combining advanced trade intelligence with a structured quantitative methodology. The framework analyzes emerging demand trends and country-level import patterns while integrating macroeconomic and trade datasets such as GDP and population forecasts, bilateral import–export flows, tariff structures, elasticity differentials between developed and developing economies, geographic distance, and import demand projections. Using weighted trade values from 2020–2024 as the base period to project country-to-country export potential for 2030, these inputs are operationalized through calculated drivers such as gravity model parameters, tariff impact factors, and projected GDP per-capita growth. Through an analysis of hidden potentials, demand hotspots, and market conditions that are most favorable to success, this method enables firms to focus on target countries, maximize returns, and global expansion with data, backed by accuracy.
By factoring in the projected importer demand gap that is currently unmet and could be potential opportunity, it identifies the potential for the Exporter (Country) among 190 countries, against the general trade analysis, which identifies the biggest importer or exporter.
To discover high-growth global markets and optimize your business strategy:
Click Here
Pricing
- Single User License$ 1,995
- Department License$ 2,400
- Site License$ 3,120
- Global License$ 3,795

Leadership Perspectives from Industry Events
Search
Thought Leadership and Analyst Meet


Our Clients
6WResearch In News
- Doha a strategic location for EV manufacturing hub: IPA Qatar
- Demand for luxury TVs surging in the GCC, says Samsung
- Empowering Growth: The Thriving Journey of Bangladesh’s Cable Industry
- Demand for luxury TVs surging in the GCC, says Samsung
- Video call with a traditional healer? Once unthinkable, it’s now common in South Africa
- Intelligent Buildings To Smooth GCC’s Path To Net Zero
Latest Reports
- Taiwan Airport Wireless Infrastructure Market (2026-2032)
- Vietnam Airport Wireless Infrastructure Market (2026-2032)
- Thailand Airport Wireless Infrastructure Market (2026-2032)
- South Korea Airport Wireless Infrastructure Market (2026-2032)
- Romania Airport Wireless Infrastructure Market (2026-2032)
- Qatar Airport Wireless Infrastructure Market (2026-2032)
- Philippines Airport Wireless Infrastructure Market (2026-2032)
- Japan Airport Wireless Infrastructure Market (2026-2032)
- Taiwan Airport Winter Services Market (2026-2032)
- Vietnam Airport Winter Services Market (2026-2032)
Industry Events and Analyst Meet

HIMTEX 2026

India Refining Summit 2026

India EV Show 2026

EV tech India Expo 2026

Auto Tech Asia 2026
Whitepaper
- Middle East & Africa Commercial Security Market Click here to view more.
- Middle East & Africa Fire Safety Systems & Equipment Market Click here to view more.
- GCC Drone Market Click here to view more.
- Middle East Lighting Fixture Market Click here to view more.
- GCC Physical & Perimeter Security Market Click here to view more.