Kenya Specialty Chemicals Market (2026-2032) Outlook | Share, Analysis, Trends, Forecast, Industry, Companies, Revenue, Value, Size & Growth
Market Forecast By Type (Agrochemicals, Flavor Ingredients, Fragrances Ingredients, Dyes & pigments, Personal care active ingredients, Water treatment chemicals, Construction chemicals, Others) And Competitive Landscape
| Product Code: ETC190142 | Publication Date: May 2022 | Updated Date: Jun 2026 | Product Type: Market Research Report | |
| Publisher: 6Wresearch | Author: Ravi Bhandari | No. of Pages: 60 | No. of Figures: 40 | No. of Tables: 7 |
Kenya Specialty Chemicals Market Size, Share & Growth Rate
The Kenya Specialty Chemicals Market was estimated at USD 446 Million in 2025 and is projected to reach USD 601 Million by 2032, growing at a CAGR of 4.4% from 2026 to 2032. This growth is primarily driven by increasing industrialization, urbanization, and a rising awareness of environmental sustainability among consumers and businesses. As various sectors, including agriculture and healthcare, demand higher-quality specialty chemicals, the market is positioned for sustained expansion.
Kenya Specialty Chemicals Market Growth Rate Analysis (2021-2032)
The Kenya Specialty Chemicals Market has maintained a stable growth pattern, with yearly growth rates hovering around 5% from 2021 to 2023. Specifically, the market grew by 5.1% in 2021 and 2022, followed by a slight dip to 5.0% in 2023. Factors driving this development include increasing industrialization and a surge in consumer demand for high-performance materials, particularly in sectors such as construction and agriculture. Notably, investments in technology and infrastructure have played a pivotal role, with 2026 projected to yield a peak growth of 5.4%. As the nation transitions towards more sustainable energy practices, the demand for specialty chemicals is expected to adapt accordingly, reflecting a growing alignment with global market trends.
Kenya Specialty Chemicals Market Year-wise Growth Rate and Key Drivers
This graph highlights how the Kenya Specialty Chemicals Market has steadily grown over the past five years, supported by major growth factors.
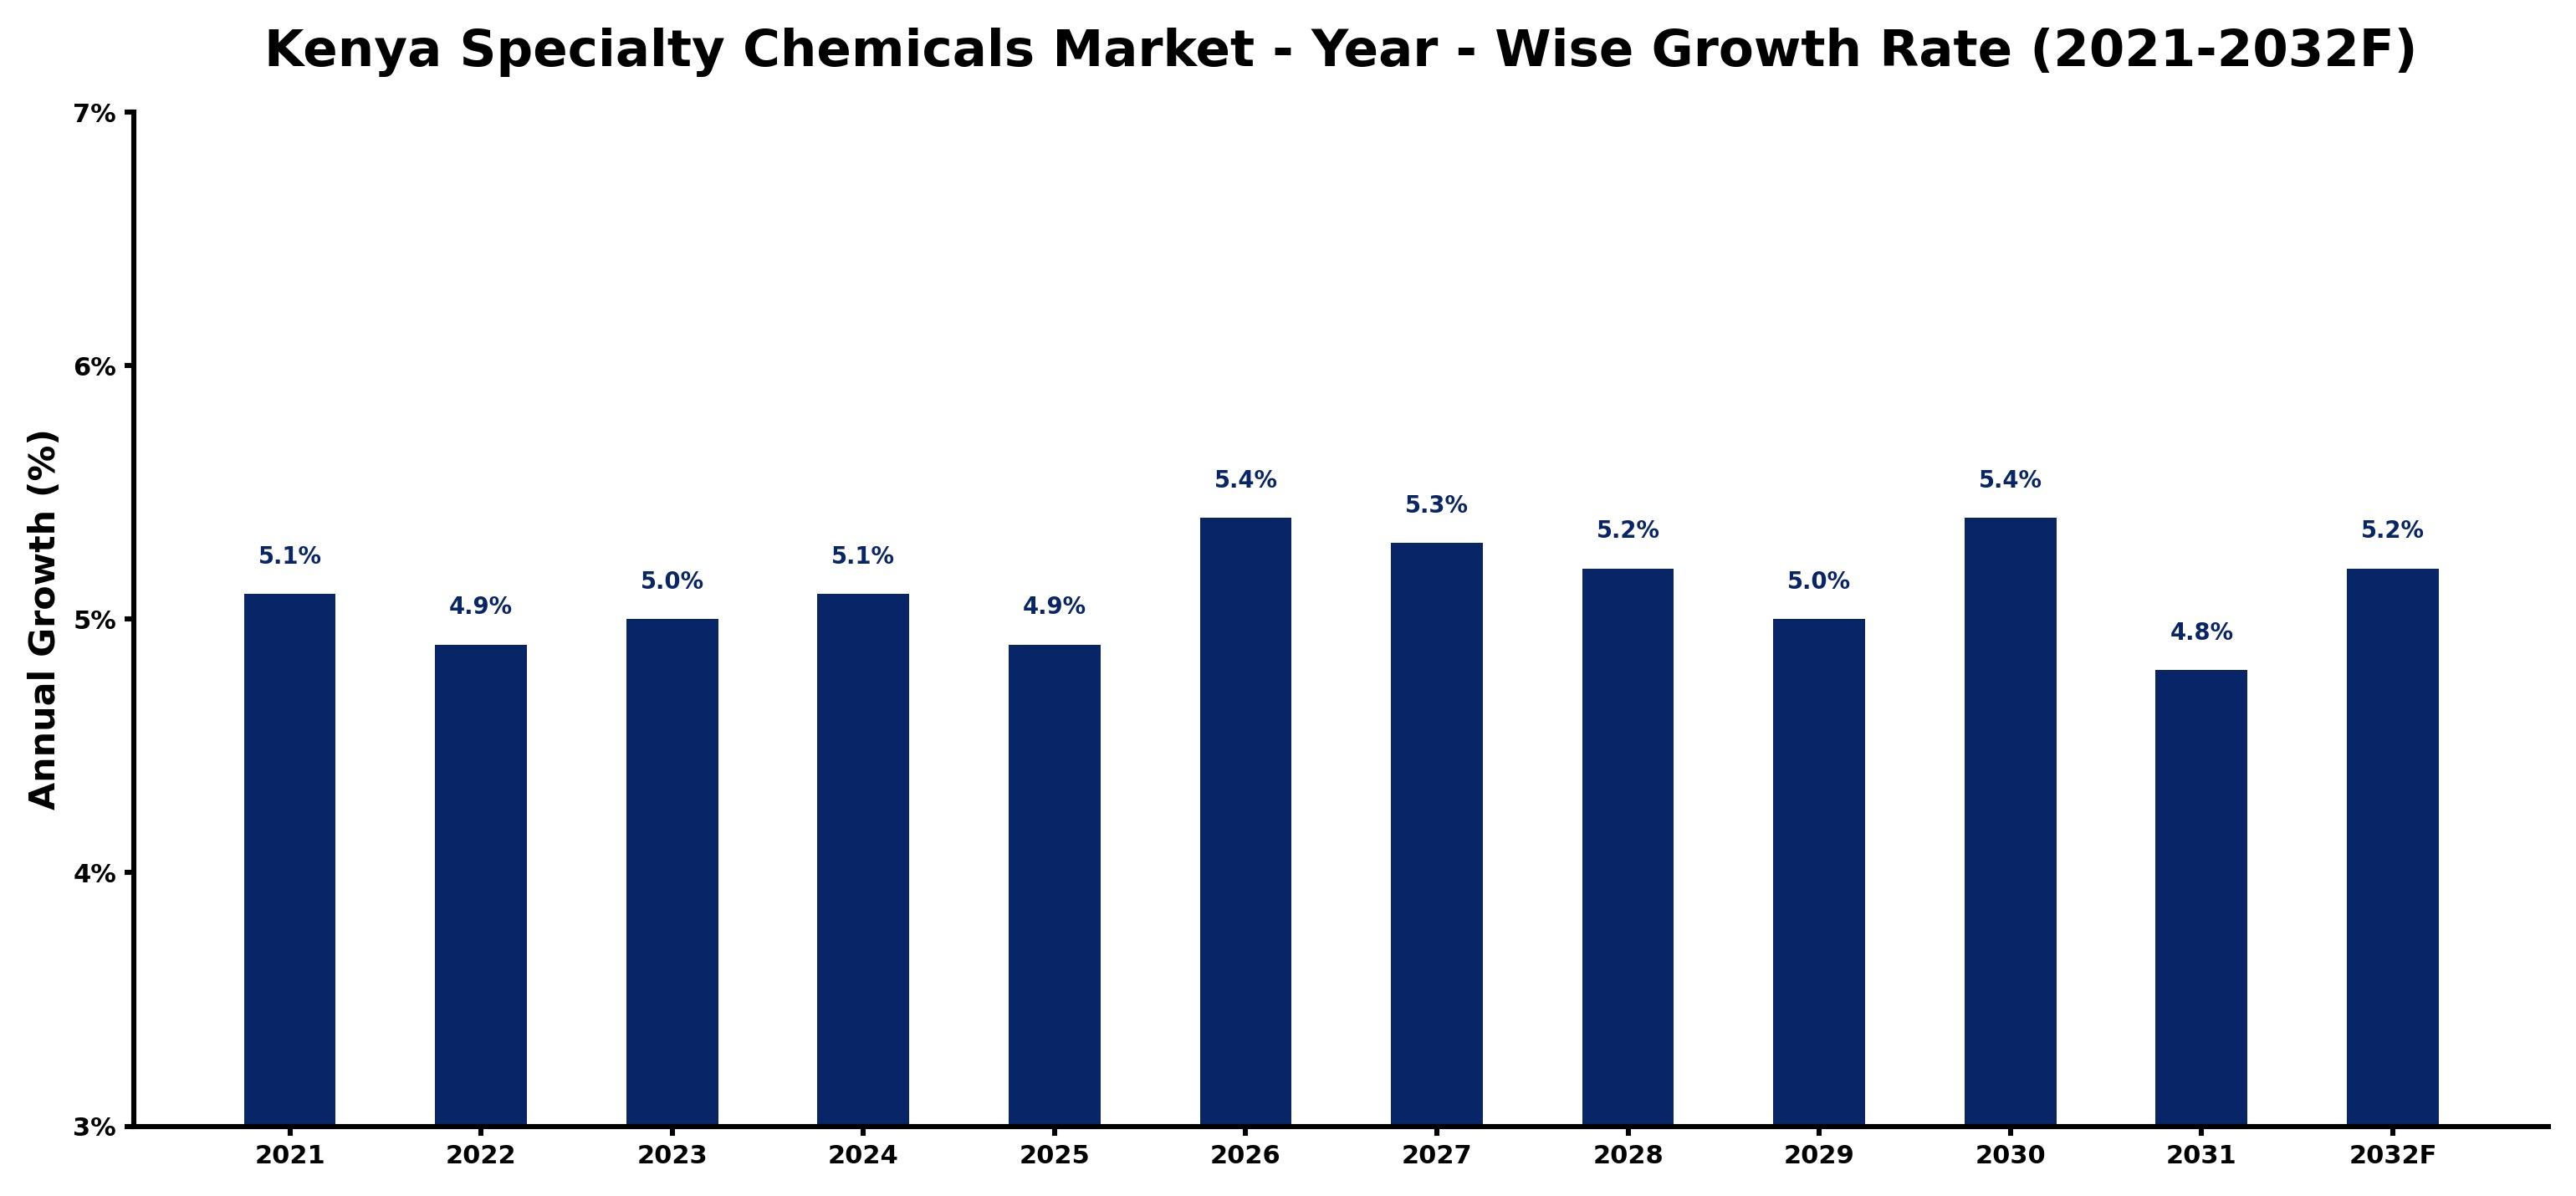
The table below presents the year‑wise growth rates along with the key drivers influencing the market
| Year | Growth Rate | Major Drivers |
| 2021 | 5.1% | Increased agricultural production demand |
| 2022 | 4.9% | Growing industrial applications expanded |
| 2023 | 5.0% | Rising consumer awareness improved |
| 2024 | 5.1% | Infrastructure development enhanced logistics |
| 2025 | 4.9% | Sustainable practices gained traction |
| 2026 | 5.4% | Technological advancements boosted efficiency |
| 2027 | 5.3% | Export opportunities expanded significantly |
| 2028 | 5.2% | Regulatory support encouraged innovation |
| 2029 | 5.0% | Investment in R&D increased growth |
| 2030 | 5.4% | Collaboration with local manufacturers |
| 2031 | 4.8% | Market diversification enhanced stability |
| 2032 | 5.2% | E-commerce growth improved accessibility |
Note - Market size estimations and growth projections presented in this report are based on 6Wresearch’s advanced forecasting approach, validated with industry datasets as of June 2026.
Kenya Specialty Chemicals Market Synopsis
The Kenya Specialty Chemicals Market is currently experiencing dynamic shifts, largely propelled by the increased demand for eco-friendly products across industries. Companies are responding to this call by investing in innovative, sustainable solutions that align with consumer values and regulatory standards.
Additionally, government policies aimed at boosting local manufacturing and supporting industrial growth are enhancing the market's potential. This commitment to fostering a safe and compliant environment is critical for the ongoing development of the specialty chemicals sector in Kenya.
Kenya Specialty Chemicals Market Key Takeaways
- The market is estimated to grow at a CAGR of 4.4% from 2026 to 2032, reflecting strong demand across various sectors.
- Investments in sustainable and environmentally friendly products are driving innovation and market expansion.
- The government's focus on local manufacturing is creating new opportunities for growth in the specialty chemicals sector.
- Key industries such as agriculture, healthcare, and manufacturing are increasingly utilizing specialty chemicals to enhance product quality and performance.
- The adoption of digitalization and technological integration is streamlining operations within the specialty chemicals market.
Evaluation of Restraints in Kenya Specialty Chemicals Market
Despite its promising outlook, the Kenya Specialty Chemicals Market is hindered by several challenges. Domestic and international competition has intensified, often leading to price wars that can impact profitability. Fluctuating raw material costs complicate budgeting and pricing strategies, creating further instability. Moreover, stringent regulations surrounding environmental protection necessitate compliance investments, while limited technical expertise and underdeveloped infrastructure for R&D constrain innovation. These factors collectively create a complex landscape that companies must navigate to maintain competitiveness.
Kenya Specialty Chemicals Market Trends
A notable trend in the Kenya Specialty Chemicals Market is the shift towards sustainable and bio-based chemical alternatives. As environmental concerns become more pronounced, businesses and consumers alike are prioritizing products that reduce ecological impact. Additionally, advancements in digital technology are being leveraged to enhance operational efficiencies, leading to greater productivity and competitiveness. This trend is further complemented by an emphasis on innovation that meets the evolving demands of diverse applications.
Kenya Specialty Chemicals Market Opportunities
There exists substantial potential for investment in the Kenya Specialty Chemicals Market, especially in agriculture, healthcare, and manufacturing sectors. The rising demand for specialty chemicals to boost agricultural productivity presents lucrative opportunities for producers of fertilizers and pesticides. Similarly, the healthcare industry requires a variety of specialty chemicals for pharmaceuticals and medical devices. Investors can explore avenues in raw material supply, manufacturing, distribution, and R&D, aligning with the country's industrialization goals.
Government Initiatives in the Kenya Specialty Chemicals Market
The Kenyan government is proactively regulating the specialty chemicals market through the establishment of the Kenya Bureau of Standards (KEBS), which ensures compliance with quality and safety standards. Additional regulations govern the import and export of specialty chemicals to maintain environmental safety. Incentives for local production further support domestic manufacturers, aiming to diminish reliance on imports and bolster the industry’s growth and innovation.
Future Insights of the Kenya Specialty Chemicals Market
Looking ahead to the years 2026-2032, the Kenya Specialty Chemicals Market is set to thrive, backed by increasing industrial activity and a growing recognition of the benefits offered by specialty chemicals. The expansion of diverse applications will continue to fuel demand across agriculture, healthcare, and manufacturing, while sustained investments in R&D will drive the introduction of innovative, sustainable products. The governmental push towards enhancing local manufacturing capabilities is likely to play a crucial role in shaping a resilient market landscape.
Kenya Specialty Chemicals Market Latest Developments (May 2025 - June 2026)
Recent developments within the Kenya Specialty Chemicals Market have showcased a notable trend toward sustainability and innovation. Companies are increasingly launching eco-friendly product lines, responding to the growing demand for environmentally conscious alternatives. The integration of digital technologies in manufacturing processes is also gaining traction, enhancing operational efficiencies and fostering competitive advantage. Overall, the market is poised for continued evolution as new players enter and adapt to the changing landscape.
Kenya Specialty Chemicals Market - Key Attractiveness of the Report
- 10 Years of Market Numbers
- Historical Data Starting from 2022 to 2025
- Base Year: 2025
- Forecast Data until 2032
- Key Performance Indicators Impacting the Market
- Major Upcoming Developments and Projects
Key Highlights of the Report:
- Kenya Specialty Chemicals Market Outlook
- Market Size of Kenya Specialty Chemicals Market, 2025
- Forecast of Kenya Specialty Chemicals Market, 2032
- Historical Data and Forecast of Kenya Specialty Chemicals Revenues & Volume for the Period 2022-2032F
- Kenya Specialty Chemicals Market Trend Evolution
- Kenya Specialty Chemicals Market Drivers and Challenges
- Kenya Specialty Chemicals Price Trends
- Kenya Specialty Chemicals Porter's Five Forces
- Kenya Specialty Chemicals Industry Life Cycle
- Historical Data and Forecast of Kenya Specialty Chemicals Market Revenues & Volume By Type for the Period 2022-2032F
- Historical Data and Forecast of Kenya Specialty Chemicals Market Revenues & Volume By Agrochemicals for the Period 2022-2032F
- Historical Data and Forecast of Kenya Specialty Chemicals Market Revenues & Volume By Flavor Ingredients for the Period 2022-2032F
- Historical Data and Forecast of Kenya Specialty Chemicals Market Revenues & Volume By Fragrances Ingredients for the Period 2022-2032F
- Historical Data and Forecast of Kenya Specialty Chemicals Market Revenues & Volume By Dyes & pigments for the Period 2022-2032F
- Historical Data and Forecast of Kenya Specialty Chemicals Market Revenues & Volume By Personal care active ingredients for the Period 2022-2032F
- Historical Data and Forecast of Kenya Specialty Chemicals Market Revenues & Volume By Water treatment chemicals for the Period 2022-2032F
- Historical Data and Forecast of Kenya Specialty Chemicals Market Revenues & Volume By Construction chemicals for the Period 2022-2032F
- Historical Data and Forecast of Kenya Agrochemicals Specialty Chemicals Market Revenues & Volume By Others for the Period 2022-2032F
- Kenya Specialty Chemicals Import Export Trade Statistics
- Market Opportunity Assessment By Type
- Kenya Specialty Chemicals Top Companies Market Share
- Kenya Specialty Chemicals Competitive Benchmarking By Technical and Operational Parameters
- Kenya Specialty Chemicals Company Profiles
- Kenya Specialty Chemicals Key Strategic Recommendations
Kenya Specialty Chemicals Market - Frequently Asked Questions
The growth is largely driven by increasing demand for specialty chemicals in agriculture, healthcare, and manufacturing sectors, alongside a heightened focus on sustainability and eco-friendly solutions.
The market was estimated at USD 446 Million in 2025 and is projected to reach USD 601 Million by 2032, growing at a CAGR of 4.4% from 2026 to 2032.
Key sectors include agriculture, where fertilizers and pesticides are crucial; healthcare, focusing on pharmaceuticals and medical devices; and manufacturing, which utilizes chemicals for various industrial processes.
The government is implementing regulations to ensure quality and safety while promoting local manufacturing through incentives, which are positively influencing market growth.
Companies face challenges such as fierce competition, fluctuating raw material prices, stringent regulations, and limited R&D infrastructure, requiring strategic planning to navigate.
6Wresearch actively monitors the Kenya Specialty Chemicals Market and publishes its comprehensive annual report, highlighting emerging trends, growth drivers, revenue analysis, and forecast outlook. Our insights help businesses to make data-backed strategic decisions with ongoing market dynamics. Our analysts track relevent industries related to the Kenya Specialty Chemicals Market, allowing our clients with actionable intelligence and reliable forecasts tailored to emerging regional needs.
Yes, we provide customisation as per your requirements. To learn more, feel free to contact us on sales@6wresearch.com
1 Executive Summary |
2 Introduction |
2.1 Key Highlights of the Report |
2.2 Report Description |
2.3 Market Scope & Segmentation |
2.4 Research Methodology |
2.5 Assumptions |
3 Kenya Specialty Chemicals Market Overview |
3.1 Kenya Country Macro Economic Indicators |
3.2 Kenya Specialty Chemicals Market Revenues & Volume, 2022 & 2032F |
3.3 Kenya Specialty Chemicals Market - Industry Life Cycle |
3.4 Kenya Specialty Chemicals Market - Porter's Five Forces |
3.5 Kenya Specialty Chemicals Market Revenues & Volume Share, By Type, 2022 & 2032F |
4 Kenya Specialty Chemicals Market Dynamics |
4.1 Impact Analysis |
4.2 Market Drivers |
4.2.1 Growing demand for specialty chemicals in key industries such as agriculture, pharmaceuticals, and manufacturing. |
4.2.2 Increasing investments in research and development activities to develop innovative specialty chemical products. |
4.2.3 Government initiatives promoting the use of eco-friendly and sustainable specialty chemicals. |
4.3 Market Restraints |
4.3.1 Volatility in raw material prices impacting the cost of production for specialty chemicals. |
4.3.2 Stringent regulations and compliance requirements related to the manufacturing and usage of specialty chemicals. |
4.3.3 Intense competition from both domestic and international specialty chemical manufacturers. |
5 Kenya Specialty Chemicals Market Trends |
6 Kenya Specialty Chemicals Market, By Types |
6.1 Kenya Specialty Chemicals Market, By Type |
6.1.1 Overview and Analysis |
6.1.2 Kenya Specialty Chemicals Market Revenues & Volume, By Type, 2022-2032F |
6.1.3 Kenya Specialty Chemicals Market Revenues & Volume, By Agrochemicals, 2022-2032F |
6.1.4 Kenya Specialty Chemicals Market Revenues & Volume, By Flavor Ingredients, 2022-2032F |
6.1.5 Kenya Specialty Chemicals Market Revenues & Volume, By Fragrances Ingredients, 2022-2032F |
6.1.6 Kenya Specialty Chemicals Market Revenues & Volume, By Dyes & pigments, 2022-2032F |
6.1.7 Kenya Specialty Chemicals Market Revenues & Volume, By Personal care active ingredients, 2022-2032F |
6.1.8 Kenya Specialty Chemicals Market Revenues & Volume, By Water treatment chemicals, 2022-2032F |
6.1.9 Kenya Specialty Chemicals Market Revenues & Volume, By Others, 2022-2032F |
6.1.10 Kenya Specialty Chemicals Market Revenues & Volume, By Others, 2022-2032F |
7 Kenya Specialty Chemicals Market Import-Export Trade Statistics |
7.1 Kenya Specialty Chemicals Market Export to Major Countries |
7.2 Kenya Specialty Chemicals Market Imports from Major Countries |
8 Kenya Specialty Chemicals Market Key Performance Indicators |
8.1 Research and development expenditure as a percentage of total revenue. |
8.2 Number of new product launches in the specialty chemicals market. |
8.3 Percentage of revenue generated from eco-friendly specialty chemical products. |
8.4 Adoption rate of specialty chemicals in key industries. |
8.5 Percentage of customers reporting satisfaction with the quality and performance of specialty chemicals. |
9 Kenya Specialty Chemicals Market - Opportunity Assessment |
9.1 Kenya Specialty Chemicals Market Opportunity Assessment, By Type, 2022 & 2032F |
10 Kenya Specialty Chemicals Market - Competitive Landscape |
10.1 Kenya Specialty Chemicals Market Revenue Share, By Companies, 2025 |
10.2 Kenya Specialty Chemicals Market Competitive Benchmarking, By Operating and Technical Parameters |
11 Company Profiles |
12 Recommendations |
13 Disclaimer |
Global Go To Market Strategy - 2030
Export potential enables firms to identify high-growth global markets with greater confidence by combining advanced trade intelligence with a structured quantitative methodology. The framework analyzes emerging demand trends and country-level import patterns while integrating macroeconomic and trade datasets such as GDP and population forecasts, bilateral import–export flows, tariff structures, elasticity differentials between developed and developing economies, geographic distance, and import demand projections. Using weighted trade values from 2020–2024 as the base period to project country-to-country export potential for 2030, these inputs are operationalized through calculated drivers such as gravity model parameters, tariff impact factors, and projected GDP per-capita growth. Through an analysis of hidden potentials, demand hotspots, and market conditions that are most favorable to success, this method enables firms to focus on target countries, maximize returns, and global expansion with data, backed by accuracy.
By factoring in the projected importer demand gap that is currently unmet and could be potential opportunity, it identifies the potential for the Exporter (Country) among 190 countries, against the general trade analysis, which identifies the biggest importer or exporter.
To discover high-growth global markets and optimize your business strategy:
Click Here
Pricing
- Single User License$ 1,995
- Department License$ 2,400
- Site License$ 3,120
- Global License$ 3,795

Leadership Perspectives from Industry Events
Search
Thought Leadership and Analyst Meet


Our Clients
6WResearch In News
- India Air Conditioner Market Set for Strong Rebound in 2026 After Weather-Led Correction and GST-Driven Recovery: 6Wresearch
- ADAS in India: How Automatic Emergency Braking, Blind Spot Detection & Driver Monitoring are Transforming Road Safety
- Doha a strategic location for EV manufacturing hub: IPA Qatar
- Demand for luxury TVs surging in the GCC, says Samsung
- Empowering Growth: The Thriving Journey of Bangladesh’s Cable Industry
- Demand for luxury TVs surging in the GCC, says Samsung
Latest Reports
- Nicaragua RPG Gaming Market (2026-2032)
- New Zealand RPG Gaming Market (2026-2032)
- Netherlands RPG Gaming Market (2026-2032)
- Nauru RPG Gaming Market (2026-2032)
- Namibia RPG Gaming Market (2026-2032)
- Mozambique RPG Gaming Market (2026-2032)
- Montenegro RPG Gaming Market (2026-2032)
- Mongolia RPG Gaming Market (2026-2032)
- Monaco RPG Gaming Market (2026-2032)
- Micronesia RPG Gaming Market (2026-2032)
Industry Events and Analyst Meet

HIMTEX 2026

India Refining Summit 2026

India EV Show 2026

EV tech India Expo 2026

Auto Tech Asia 2026
Whitepaper
- Middle East & Africa Commercial Security Market Click here to view more.
- Middle East & Africa Fire Safety Systems & Equipment Market Click here to view more.
- GCC Drone Market Click here to view more.
- Middle East Lighting Fixture Market Click here to view more.
- GCC Physical & Perimeter Security Market Click here to view more.