Kenya Tags Market Outlook | Forecast, COVID-19 IMPACT, Analysis, Companies, Value, Size, Trends, Share, Industry, Revenue & Growth
Market Forecast By Material Type (Plastic, Paper, Fibers, Others (Metal, etc.)), By Tag Type (RFID Tag, Hang/ Swing Tag, Loop Tag), By End Use (Food & Beverage, Clothing & Apparels, Hospitality & Travel, Beauty & Personal Care, Consumer Electronics, Others) And Competitive Landscape
| Product Code: ETC428086 | Publication Date: Oct 2022 | Updated Date: Sep 2025 | Product Type: Market Research Report | |
| Publisher: 6Wresearch | Author: Ravi Bhandari | No. of Pages: 75 | No. of Figures: 35 | No. of Tables: 20 |
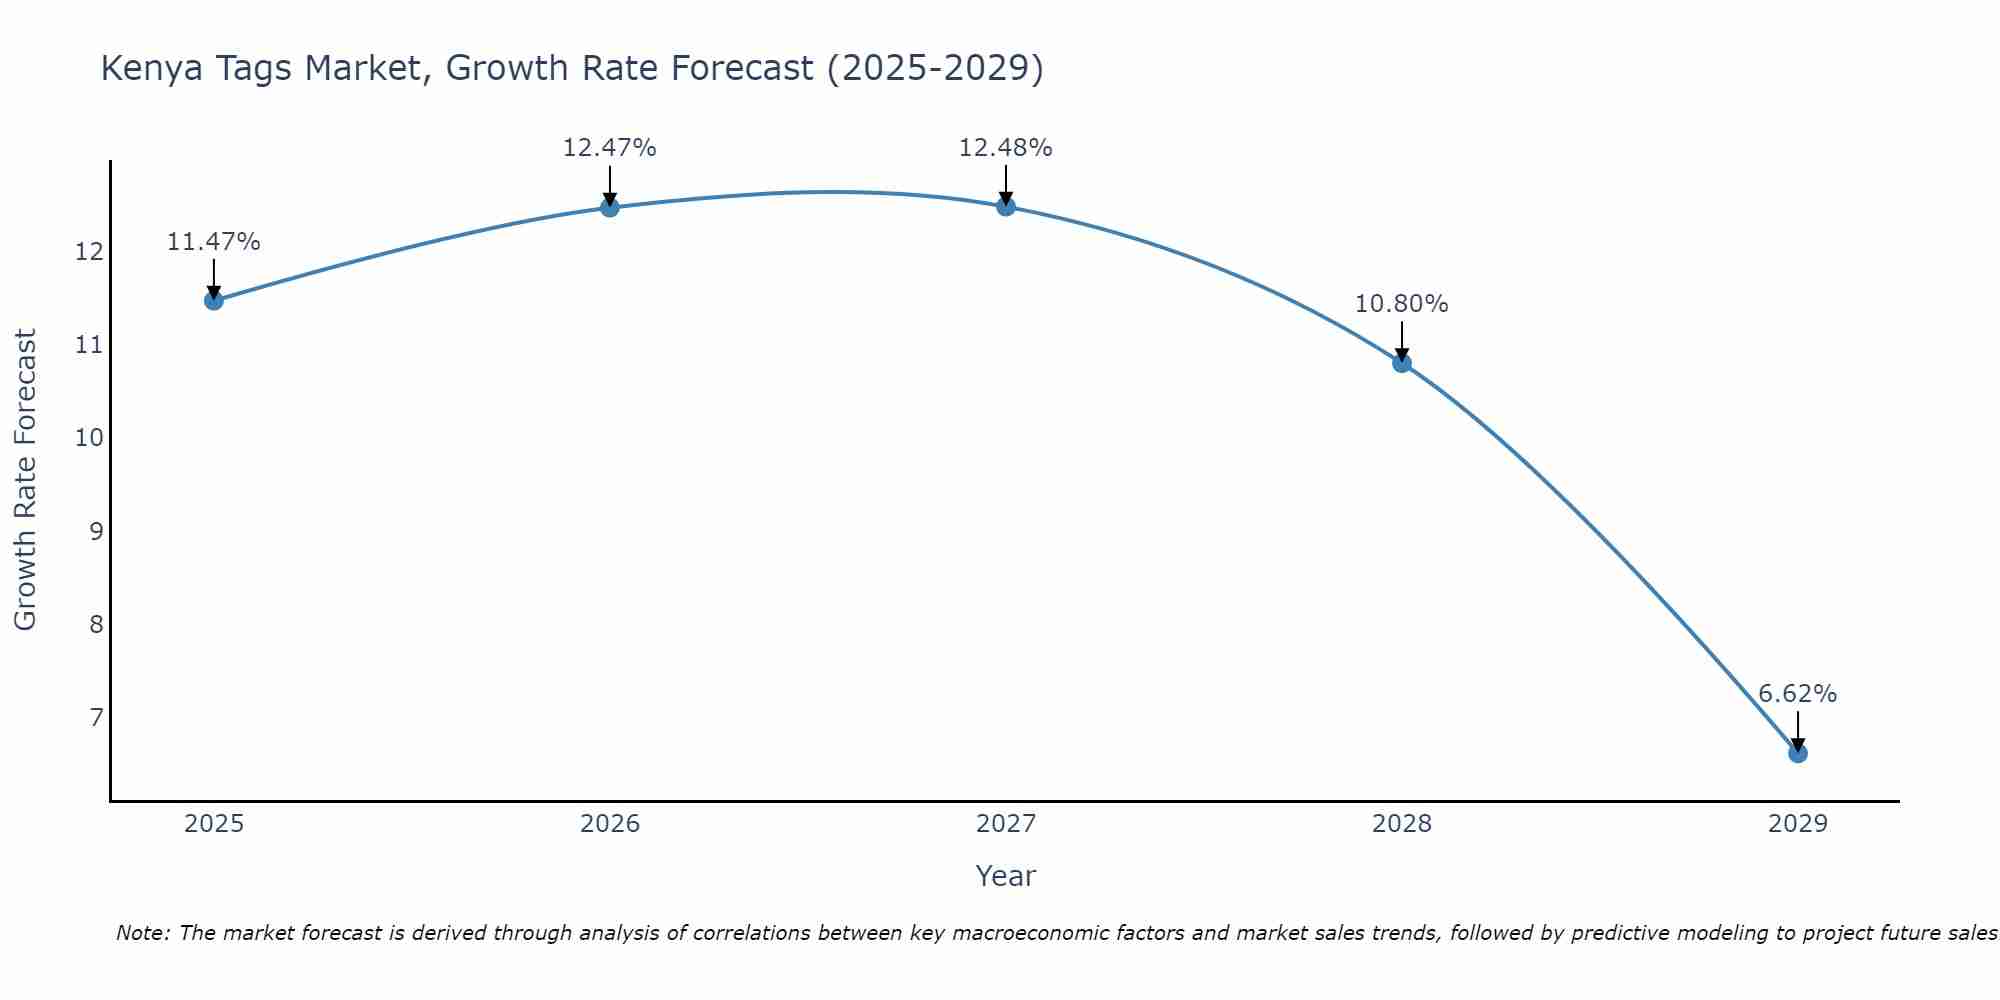
Kenya Tags Market Size Growth Rate
The Kenya Tags Market is projected to witness mixed growth rate patterns during 2025 to 2029. Starting at 11.47% in 2025, the market peaks at 12.48% in 2027, and settles at 6.62% by 2029.
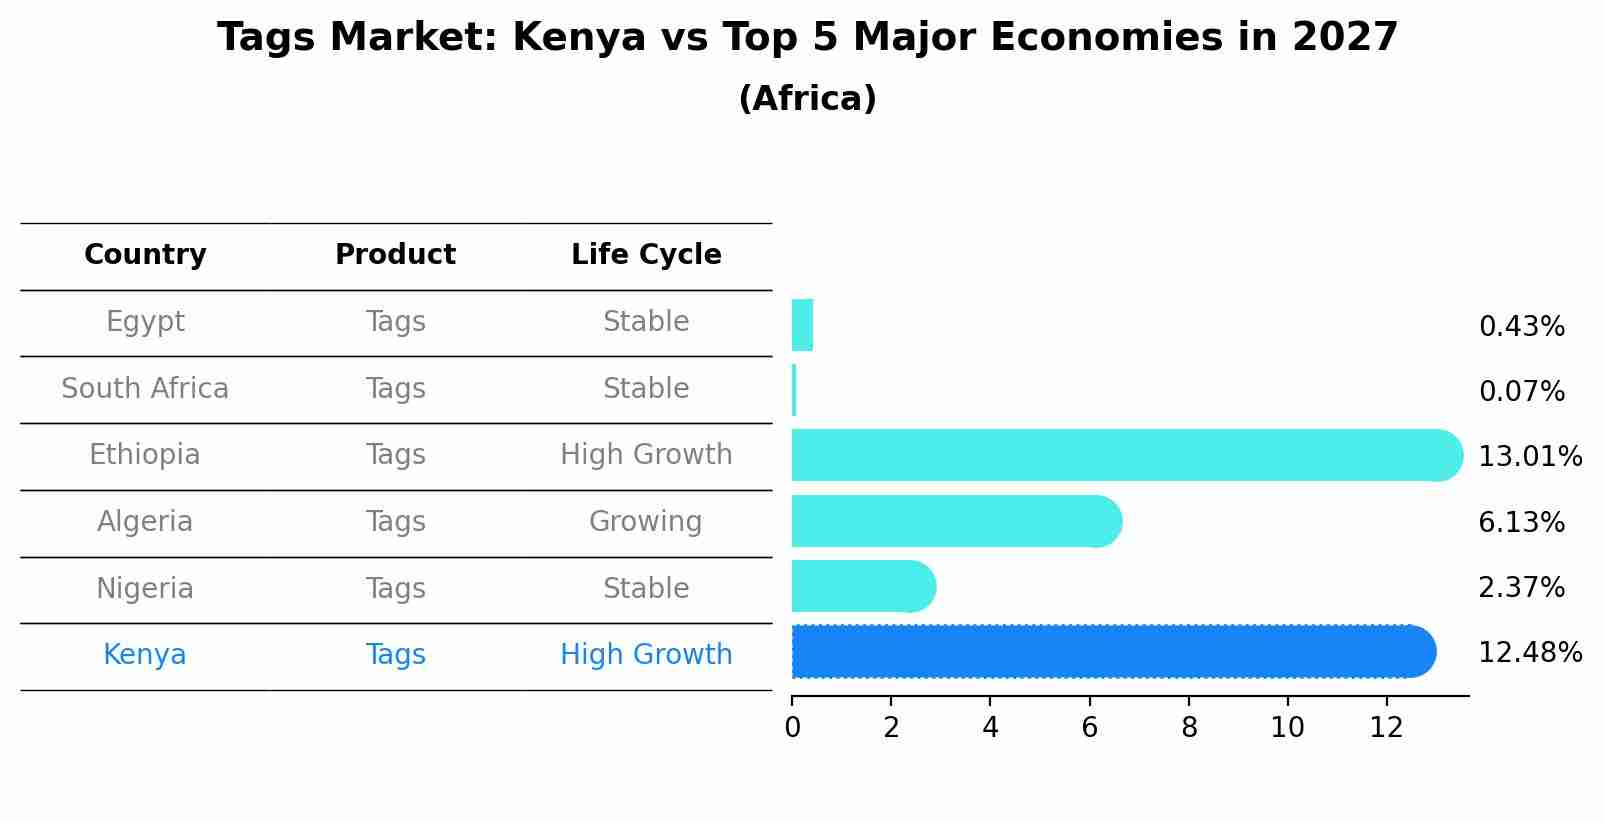
Tags Market: Kenya vs Top 5 Major Economies in 2027 (Africa)
The Tags market in Kenya is projected to grow at a high growth rate of 12.48% by 2027, highlighting the country's increasing focus on advanced technologies within the Africa region, where Egypt holds the dominant position, followed closely by South Africa, Ethiopia, Algeria and Nigeria, shaping overall regional demand.
Kenya Tags Market Synopsis
The Kenya tags market is experiencing steady growth driven by factors such as increasing demand for labeling and identification solutions across various industries including retail, agriculture, and healthcare. The market offers a wide range of tags including RFID tags, barcode tags, and security tags. RFID tags are gaining popularity due to their efficiency in inventory management and tracking. The agriculture sector is a key driver of the tags market in Kenya, with a growing adoption of tags for livestock identification and tracking. The market is characterized by the presence of both domestic manufacturers and international players offering innovative and customized tag solutions to cater to the diverse needs of businesses in Kenya. Overall, the Kenya tags market is expected to continue its growth trajectory supported by technological advancements and increasing adoption of automated identification systems.
Kenya Tags Market Trends
The Kenya tags market is experiencing a growing demand for RFID (Radio Frequency Identification) tags due to their ability to provide real-time tracking and monitoring of assets. This is particularly prevalent in sectors such as logistics, healthcare, and agriculture where efficient inventory management is crucial. There is also a trend towards the use of eco-friendly and sustainable materials in tag production, in alignment with the increasing focus on environmental sustainability. Additionally, there is a rising interest in customized tags that offer unique branding opportunities for businesses. Overall, the market is witnessing a shift towards innovative and technology-driven solutions that enhance operational efficiency and offer added value to customers.
Kenya Tags Market Challenges
In the Kenya tags market, several challenges are faced, including a lack of standardized regulations governing the industry, which can lead to inconsistencies in quality and pricing. Counterfeiting is also a significant issue, with counterfeit tags flooding the market and undermining the credibility of genuine products. Limited access to advanced technology and machinery for tag production hinders the ability of local manufacturers to compete effectively with international suppliers. Additionally, fluctuating raw material prices and currency exchange rates can impact production costs and profit margins for tag manufacturers in Kenya. Overcoming these challenges will require collaboration between industry stakeholders, government intervention to enforce regulations, investment in technology and skills development, and strategic partnerships to enhance market competitiveness and sustainability.
Kenya Tags Market Investment Opportunities
The Kenya tags market presents several promising investment opportunities across various sectors. With the country`s growing focus on agriculture and livestock, there is a demand for high-quality livestock tags for tracking and identification purposes. Additionally, the e-commerce industry in Kenya is rapidly expanding, creating a need for tags and labels for packaging and branding purposes. Investing in the production and distribution of RFID tags for inventory management and security applications is another lucrative opportunity in the market. Moreover, as the government and businesses emphasize sustainability and traceability, there is a rising demand for eco-friendly and biodegradable tags, offering a niche market for environmentally conscious investors. Overall, the Kenya tags market offers diverse investment avenues with the potential for growth and profitability.
Jordan Agar Market Government Policies
The Kenya Tags Market is subject to government policies aimed at regulating and standardizing the production, distribution, and use of tags in various sectors such as agriculture, livestock, and security. Key policies include the Kenya Bureau of Standards (KEBS) certification requirements for quality assurance, import and export regulations to ensure compliance with international standards, and licensing procedures for manufacturers and suppliers. Additionally, the government has implemented initiatives to support local tag producers through incentives and subsidies to promote domestic production. Environmental policies also play a role in governing the materials used in tags to ensure sustainability and minimize pollution. Overall, the government`s focus on quality control, trade regulations, and local industry support shapes the landscape of the Kenya Tags Market.
Kenya Tags Market Future Outlook
The Kenya tags market is poised for steady growth in the coming years, driven by increasing adoption of technology and advancement in the retail sector. With the rise of e-commerce platforms and the need for efficient inventory management, demand for various types of tags, such as RFID tags, barcode labels, and security tags, is expected to surge. Additionally, the growing awareness among businesses about the importance of product tracking, anti-counterfeiting measures, and data analytics will further fuel the market growth. The government`s initiatives to enhance supply chain efficiency and combat counterfeit products will also contribute to the expansion of the Kenya tags market. Overall, the market is likely to witness significant opportunities for innovation and investment in the near future.
Key Highlights of the Report:
- Kenya Tags Market Outlook
- Market Size of Kenya Tags Market, 2021
- Forecast of Kenya Tags Market, 2031
- Historical Data and Forecast of Kenya Tags Revenues & Volume for the Period 2018 - 2031
- Kenya Tags Market Trend Evolution
- Kenya Tags Market Drivers and Challenges
- Kenya Tags Price Trends
- Kenya Tags Porter's Five Forces
- Kenya Tags Industry Life Cycle
- Historical Data and Forecast of Kenya Tags Market Revenues & Volume By Material Type for the Period 2018 - 2031
- Historical Data and Forecast of Kenya Tags Market Revenues & Volume By Plastic for the Period 2018 - 2031
- Historical Data and Forecast of Kenya Tags Market Revenues & Volume By Paper for the Period 2018 - 2031
- Historical Data and Forecast of Kenya Tags Market Revenues & Volume By Fibers for the Period 2018 - 2031
- Historical Data and Forecast of Kenya Tags Market Revenues & Volume By Others (Metal, etc.) for the Period 2018 - 2031
- Historical Data and Forecast of Kenya Tags Market Revenues & Volume By Tag Type for the Period 2018 - 2031
- Historical Data and Forecast of Kenya Tags Market Revenues & Volume By RFID Tag for the Period 2018 - 2031
- Historical Data and Forecast of Kenya Tags Market Revenues & Volume By Hang/ Swing Tag for the Period 2018 - 2031
- Historical Data and Forecast of Kenya Tags Market Revenues & Volume By Loop Tag for the Period 2018 - 2031
- Historical Data and Forecast of Kenya Tags Market Revenues & Volume By End Use for the Period 2018 - 2031
- Historical Data and Forecast of Kenya Tags Market Revenues & Volume By Food & Beverage for the Period 2018 - 2031
- Historical Data and Forecast of Kenya Tags Market Revenues & Volume By Clothing & Apparels for the Period 2018 - 2031
- Historical Data and Forecast of Kenya Tags Market Revenues & Volume By Hospitality & Travel for the Period 2018 - 2031
- Historical Data and Forecast of Kenya Tags Market Revenues & Volume By Beauty & Personal Care for the Period 2018 - 2031
- Historical Data and Forecast of Kenya Tags Market Revenues & Volume By Consumer Electronics for the Period 2018 - 2031
- Historical Data and Forecast of Kenya Tags Market Revenues & Volume By Others for the Period 2018 - 2031
- Kenya Tags Import Export Trade Statistics
- Market Opportunity Assessment By Material Type
- Market Opportunity Assessment By Tag Type
- Market Opportunity Assessment By End Use
- Kenya Tags Top Companies Market Share
- Kenya Tags Competitive Benchmarking By Technical and Operational Parameters
- Kenya Tags Company Profiles
- Kenya Tags Key Strategic Recommendations
Frequently Asked Questions About the Market Study (FAQs):
6Wresearch actively monitors the Kenya Tags Market and publishes its comprehensive annual report, highlighting emerging trends, growth drivers, revenue analysis, and forecast outlook. Our insights help businesses to make data-backed strategic decisions with ongoing market dynamics. Our analysts track relevent industries related to the Kenya Tags Market, allowing our clients with actionable intelligence and reliable forecasts tailored to emerging regional needs.
Yes, we provide customisation as per your requirements. To learn more, feel free to contact us on sales@6wresearch.com
1 Executive Summary |
2 Introduction |
2.1 Key Highlights of the Report |
2.2 Report Description |
2.3 Market Scope & Segmentation |
2.4 Research Methodology |
2.5 Assumptions |
3 Kenya Tags Market Overview |
3.1 Kenya Country Macro Economic Indicators |
3.2 Kenya Tags Market Revenues & Volume, 2021 & 2031F |
3.3 Kenya Tags Market - Industry Life Cycle |
3.4 Kenya Tags Market - Porter's Five Forces |
3.5 Kenya Tags Market Revenues & Volume Share, By Material Type, 2021 & 2031F |
3.6 Kenya Tags Market Revenues & Volume Share, By Tag Type, 2021 & 2031F |
3.7 Kenya Tags Market Revenues & Volume Share, By End Use, 2021 & 2031F |
4 Kenya Tags Market Dynamics |
4.1 Impact Analysis |
4.2 Market Drivers |
4.2.1 Increasing adoption of technology and automation in the agriculture sector, leading to higher demand for Kenya tags for tracking livestock. |
4.2.2 Government initiatives promoting animal welfare and traceability, driving the need for Kenya tags to monitor and manage livestock. |
4.2.3 Growing awareness among farmers about the benefits of using Kenya tags for disease control, breeding management, and improved productivity. |
4.3 Market Restraints |
4.3.1 High initial investment cost associated with implementing Kenya tags systems, limiting adoption among small-scale farmers. |
4.3.2 Lack of standardized regulations and enforcement mechanisms for Kenya tags, leading to issues with interoperability and data sharing. |
4.3.3 Concerns regarding data privacy and security of information collected through Kenya tags, impacting trust among stakeholders. |
5 Kenya Tags Market Trends |
6 Kenya Tags Market, By Types |
6.1 Kenya Tags Market, By Material Type |
6.1.1 Overview and Analysis |
6.1.2 Kenya Tags Market Revenues & Volume, By Material Type, 2021-2031F |
6.1.3 Kenya Tags Market Revenues & Volume, By Plastic, 2021-2031F |
6.1.4 Kenya Tags Market Revenues & Volume, By Paper, 2021-2031F |
6.1.5 Kenya Tags Market Revenues & Volume, By Fibers, 2021-2031F |
6.1.6 Kenya Tags Market Revenues & Volume, By Others (Metal, etc.), 2021-2031F |
6.2 Kenya Tags Market, By Tag Type |
6.2.1 Overview and Analysis |
6.2.2 Kenya Tags Market Revenues & Volume, By RFID Tag, 2021-2031F |
6.2.3 Kenya Tags Market Revenues & Volume, By Hang/ Swing Tag, 2021-2031F |
6.2.4 Kenya Tags Market Revenues & Volume, By Loop Tag, 2021-2031F |
6.3 Kenya Tags Market, By End Use |
6.3.1 Overview and Analysis |
6.3.2 Kenya Tags Market Revenues & Volume, By Food & Beverage, 2021-2031F |
6.3.3 Kenya Tags Market Revenues & Volume, By Clothing & Apparels, 2021-2031F |
6.3.4 Kenya Tags Market Revenues & Volume, By Hospitality & Travel, 2021-2031F |
6.3.5 Kenya Tags Market Revenues & Volume, By Beauty & Personal Care, 2021-2031F |
6.3.6 Kenya Tags Market Revenues & Volume, By Consumer Electronics, 2021-2031F |
6.3.7 Kenya Tags Market Revenues & Volume, By Others, 2021-2031F |
7 Kenya Tags Market Import-Export Trade Statistics |
7.1 Kenya Tags Market Export to Major Countries |
7.2 Kenya Tags Market Imports from Major Countries |
8 Kenya Tags Market Key Performance Indicators |
8.1 Adoption rate of Kenya tags technology among different segments of farmers. |
8.2 Rate of compliance with government regulations related to Kenya tags implementation. |
8.3 Number of reported cases of livestock diseases managed or prevented through the use of Kenya tags. |
9 Kenya Tags Market - Opportunity Assessment |
9.1 Kenya Tags Market Opportunity Assessment, By Material Type, 2021 & 2031F |
9.2 Kenya Tags Market Opportunity Assessment, By Tag Type, 2021 & 2031F |
9.3 Kenya Tags Market Opportunity Assessment, By End Use, 2021 & 2031F |
10 Kenya Tags Market - Competitive Landscape |
10.1 Kenya Tags Market Revenue Share, By Companies, 2021 |
10.2 Kenya Tags Market Competitive Benchmarking, By Operating and Technical Parameters |
11 Company Profiles |
12 Recommendations |
13 Disclaimer |
Global Go To Market Strategy - 2030
Export potential enables firms to identify high-growth global markets with greater confidence by combining advanced trade intelligence with a structured quantitative methodology. The framework analyzes emerging demand trends and country-level import patterns while integrating macroeconomic and trade datasets such as GDP and population forecasts, bilateral import–export flows, tariff structures, elasticity differentials between developed and developing economies, geographic distance, and import demand projections. Using weighted trade values from 2020–2024 as the base period to project country-to-country export potential for 2030, these inputs are operationalized through calculated drivers such as gravity model parameters, tariff impact factors, and projected GDP per-capita growth. Through an analysis of hidden potentials, demand hotspots, and market conditions that are most favorable to success, this method enables firms to focus on target countries, maximize returns, and global expansion with data, backed by accuracy.
By factoring in the projected importer demand gap that is currently unmet and could be potential opportunity, it identifies the potential for the Exporter (Country) among 190 countries, against the general trade analysis, which identifies the biggest importer or exporter.
To discover high-growth global markets and optimize your business strategy:
Click Here
Pricing
- Single User License$ 1,995
- Department License$ 2,400
- Site License$ 3,120
- Global License$ 3,795

Leadership Perspectives from Industry Events
Search
Thought Leadership and Analyst Meet


Our Clients
6WResearch In News
- India Air Conditioner Market Set for Strong Rebound in 2026 After Weather-Led Correction and GST-Driven Recovery: 6Wresearch
- ADAS in India: How Automatic Emergency Braking, Blind Spot Detection & Driver Monitoring are Transforming Road Safety
- Doha a strategic location for EV manufacturing hub: IPA Qatar
- Demand for luxury TVs surging in the GCC, says Samsung
- Empowering Growth: The Thriving Journey of Bangladesh’s Cable Industry
- Demand for luxury TVs surging in the GCC, says Samsung
Latest Reports
- Poland Fire Protection Systems Market (2026-2032)
- Cape Verde Portable Hand-Thrown Extinguisher Market (2026-2032)
- Canada Portable Hand-Thrown Extinguisher Market (2026-2032)
- Cameroon Portable Hand-Thrown Extinguisher Market (2026-2032)
- Burundi Portable Hand-Thrown Extinguisher Market (2026-2032)
- Burkina Faso Portable Hand-Thrown Extinguisher Market (2026-2032)
- Bulgaria Portable Hand-Thrown Extinguisher Market (2026-2032)
- Brunei Portable Hand-Thrown Extinguisher Market (2026-2032)
- Botswana Portable Hand-Thrown Extinguisher Market (2026-2032)
- Bosnia and Herzegovina Portable Hand-Thrown Extinguisher Market (2026-2032)
Industry Events and Analyst Meet

HIMTEX 2026

India Refining Summit 2026

India EV Show 2026

EV tech India Expo 2026

Auto Tech Asia 2026
Whitepaper
- Middle East & Africa Commercial Security Market Click here to view more.
- Middle East & Africa Fire Safety Systems & Equipment Market Click here to view more.
- GCC Drone Market Click here to view more.
- Middle East Lighting Fixture Market Click here to view more.
- GCC Physical & Perimeter Security Market Click here to view more.