Kenya Water Treatment Market (2026-2032) | Analysis, Value, Forecast, Size, Companies, Share, Revenue, Growth, Outlook, Industry, COVID-19 IMPACT & Trends
Market Forecast By Types (Distillation, Filtration, Disinfection, Reverse Osmosis), By Applications (Residential, Non-Residential), By Installations (Point Of Use , Point Of Entry) And Competitive Landscape
| Product Code: ETC007690 | Publication Date: Sep 2020 | Updated Date: Jun 2026 | Product Type: Report | |
| Publisher: 6Wresearch | Author: Ravi Bhandari | No. of Pages: 70 | No. of Figures: 35 | No. of Tables: 5 |
Kenya Water Treatment Market Summary
The kenya water treatment market was estimated at USD 371 Million in 2025 and is projected to reach USD 523 Million by 2032, growing at a CAGR of 6.0% from 2026 to 2032.
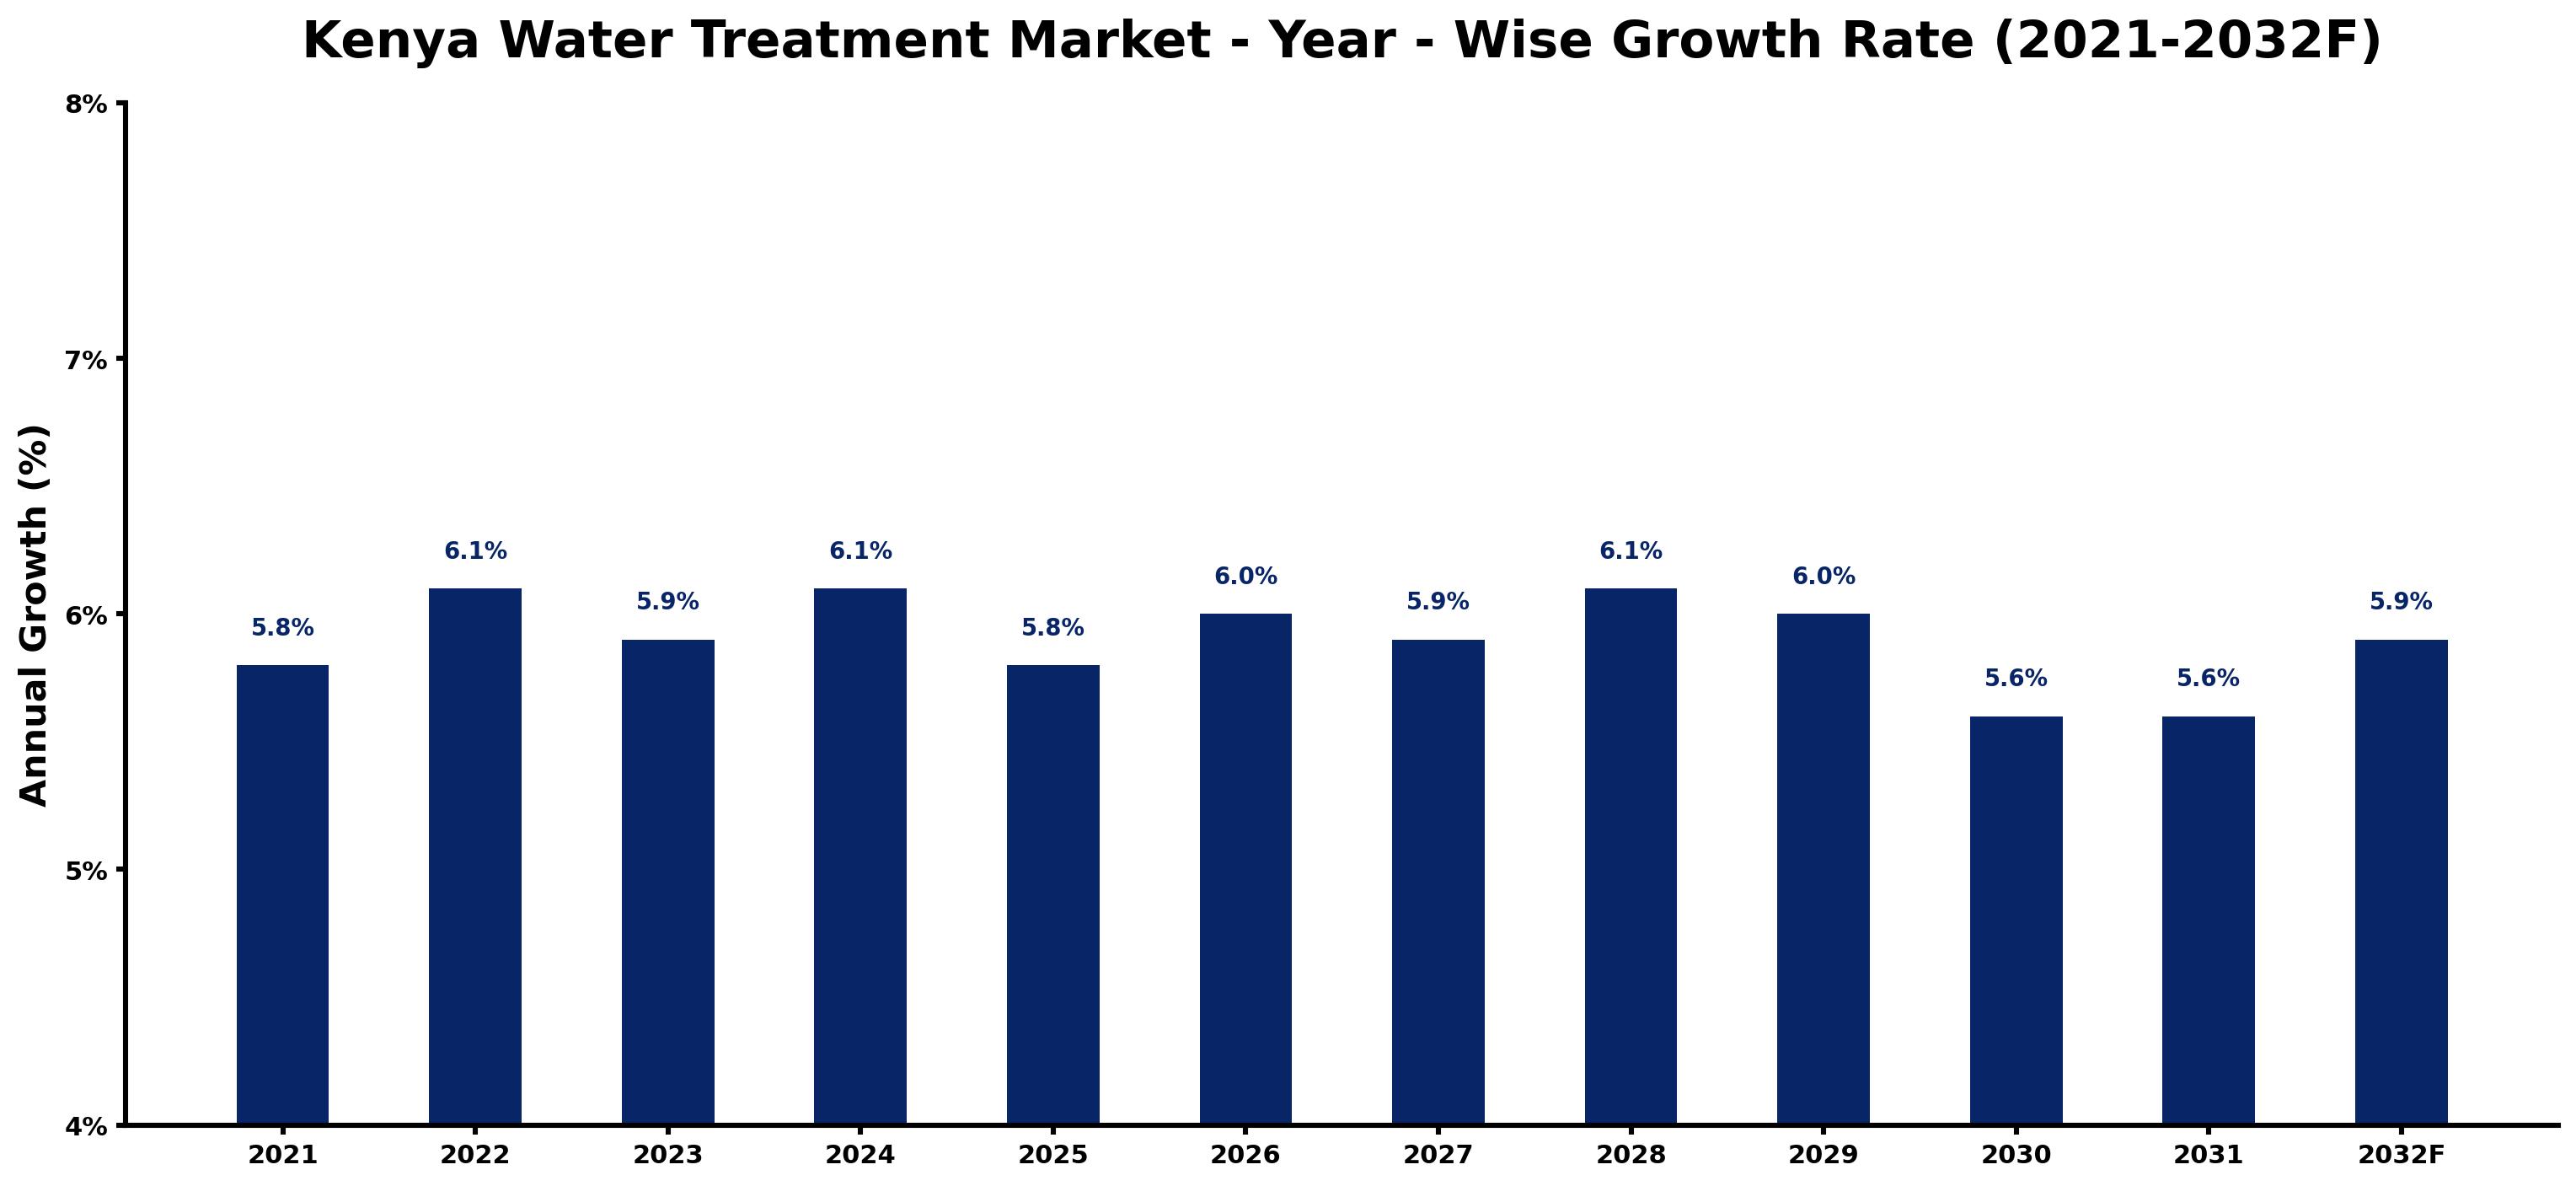
Kenya Water Treatment Market Growth Rate Analysis (2021-2032)
The Kenya water treatment market has exhibited stable growth, with yearly growth rates fluctuating between 5.6% and 6.1% from 2021 through 2032. The market saw a peak of 6.1% in both 2022 and 2024, largely driven by increased investments in infrastructure and advancements in treatment technologies. Consumer demand for clean water has surged due to urbanization and heightened awareness of water quality issues. However, slight declines to 5.8% in 2025 and 2030 can be attributed to shifting regulatory environments and the impact of global supply chain disruptions. As efforts towards energy transition and digitalization continue, the market is poised for sustained expansion, notably supported by government initiatives promoting sustainable water management practices.
Kenya Water Treatment Market Year-wise Growth Rate and Key Drivers
This graph highlights how the Kenya Water Treatment Market has steadily grown over the past five years, supported by major growth factors.
The table below presents the year wise growth rates along with the key drivers influencing the market
| Year | Growth Rate | Major Drivers |
| 2021 | 5.8% | Urbanization trends intensified, leading to higher investments in water treatment infrastructure. |
| 2022 | 6.1% | Regional water scarcity triggered demand for innovative purifying technologies and systems. |
| 2023 | 5.9% | Private sector partnerships emerged, enhancing efficiencies within water management services. |
| 2024 | 6.1% | Awareness campaigns boosted public understanding of water quality and health impacts. |
| 2025 | 5.8% | International funding opportunities expanded, particularly for sustainable water projects. |
| 2026 | 6.0% | Local businesses began prioritizing eco-friendly solutions, reshaping product development strategies. |
| 2027 | 5.9% | Technological innovations focused on mobile water treatment units gained significant traction. |
| 2028 | 6.1% | Increased population density in urban areas heightened pressure for reliable water supply. |
| 2029 | 6.0% | Collaborative efforts between NGOs and government improved community-based water initiatives. |
| 2030 | 5.6% | Emerging local manufacturing of water treatment technologies reduced dependency on imports. |
| 2031 | 5.6% | Economic growth generated greater disposable income, leading to higher spending on water services. |
| 2032 | 5.9% | Consumer preferences shifted towards brands emphasizing sustainability and social responsibility. |
Note - Market size estimations and growth projections presented in this report are based on 6Wresearch's advanced forecasting approach, validated with industry datasets as of June 2026.
Kenya Water Treatment Market Synopsis
The Kenya Water Treatment Market is projected to reach 6.0% and witness significant growth during the forecast period (2026-2032). This growth is largely driven by the increasing demand for clean and safe drinking water, the expanding urban population, and the pressing need to combat water pollution. As Kenya continues to develop economically, the importance of effective water treatment solutions becomes paramount, necessitating advancements in technology and infrastructure.
Kenya Water Treatment Market Growth Drivers
The landscape of the Kenya water treatment market is being shaped by several key growth drivers:
- Urbanization is rapidly transforming Kenyan cities, leading to increased water demand and consequently higher levels of contamination. The influx of populations into urban areas necessitates robust water treatment solutions to ensure access to quality drinking water.
- Government regulations regarding water quality are becoming increasingly stringent, pushing industries to adopt modern treatment technologies that comply with these standards. This regulatory push fosters innovation and investment in water treatment solutions.
- The industrial sector's expansion contributes significantly to water pollution, necessitating more effective treatment strategies. Industries are increasingly recognizing the importance of sustainable water practices, further driving the demand for advanced treatment solutions.
- Investment in water treatment infrastructure is critical. The government and private sector are channeling funds toward modernizing existing facilities and developing new treatment plants to meet the growing needs of the population.
- Public awareness regarding the importance of clean water is rising, leading to increased consumer demand for safe drinking water options and spurring the growth of home water treatment systems.
Kenya Water Treatment Market Challenges and Restraints
Despite the promising growth potential, the Kenya water treatment market faces several challenges:
- Limited infrastructure remains a significant barrier in many areas of Kenya, where communities still rely on untreated or inadequately treated water sources. This lack of facilities poses health risks and complicates efforts toward universal safe water access.
- Operational costs associated with establishing and maintaining treatment plants are high, particularly for smaller towns and rural regions. This financial strain limits the ability of local authorities to invest in necessary technologies.
- The shortage of skilled professionals in the water treatment sector further complicates the implementation of effective solutions. Training and retaining skilled personnel are vital for operational efficiency and the sustainability of water treatment projects.
- Regulatory enforcement is often inconsistent, leading to variations in water quality standards across regions. This inconsistency can hinder the establishment of reliable treatment protocols.
- Finally, the multifaceted nature of water pollution—stemming from industrial discharge, agricultural runoff, and urban waste—creates complexity in designing effective treatment systems that address the diverse contaminants present in water supplies.
Kenya Water Treatment Market Government Investment and Initiatives
The Kenyan government is actively fostering the growth of the water treatment market through a series of initiatives aimed at improving water quality and accessibility:
- Policies promoting investment in water treatment infrastructure are being implemented, which include incentives for private sector participation in water supply and treatment projects.
- Subsidies aimed at modernizing existing water treatment plants are being introduced, making it financially feasible for local authorities to upgrade outdated systems and adopt innovative technologies.
- Stringent quality standards are enforced for treated water, which compels treatment facilities to adhere to best practices, thereby improving public health outcomes.
- The government is encouraging public-private partnerships to leverage private sector expertise and funding, effectively bridging gaps in infrastructure and technological advancement.
- Investment in capacity-building programs for professionals in the water treatment sector is being prioritized, fostering a skilled workforce that can address the specific challenges faced by the industry.
Kenya Water Treatment Market Latest Developments (May 2025 - June 2026)
During the period from May 2025 to June 2026, the Kenya water treatment market has experienced notable shifts, reflecting emerging trends and industry directions:
- Innovations in water treatment technologies are on the rise, with a growing focus on sustainable practices and the integration of renewable energy sources in treatment processes.
- Local communities are increasingly adopting decentralized water treatment solutions, including small-scale and home systems, to address immediate water quality concerns.
- Collaboration between government agencies and non-governmental organizations has intensified to enhance water quality monitoring and increase awareness of water-related health issues.
- Funding from international organizations targeting water scarcity and pollution is gradually increasing, aimed at supporting infrastructure projects and capacity building within local communities.
- Finally, there is a renewed commitment to improving regulatory frameworks that govern water treatment processes, ensuring they are adaptive to evolving challenges in the sector.
Kenya Water Treatment Market - Key Attractiveness of the Report
- 10 Years of Market Numbers
- Historical Data Starting from 2022 to 2025
- Base Year: 2025
- Forecast Data until 2032
- Key Performance Indicators Impacting the Market
- Major Upcoming Developments and Projects
Key Highlights of the Report:
- Kenya Water Treatment Market Outlook
- Market Size of Kenya Water Treatment Market, 2025
- Forecast of Kenya Water Treatment Market, 2032F
- Historical Data and Forecast of Kenya Water Treatment Revenues & Volume for the Period 2022-2032F
- Kenya Water Treatment Market Trend Evolution
- Kenya Water Treatment Market Drivers and Challenges
- Kenya Water Treatment Price Trends
- Kenya Water Treatment Porter's Five Forces
- Kenya Water Treatment Industry Life Cycle
- Historical Data and Forecast of Kenya Water Treatment Market Revenues & Volume By Types for the Period 2022-2032F
- Historical Data and Forecast of Kenya Water Treatment Market Revenues & Volume By Distillation? for the Period 2022-2032F
- Historical Data and Forecast of Kenya Water Treatment Market Revenues & Volume By Filtration? for the Period 2022-2032F
- Historical Data and Forecast of Kenya Water Treatment Market Revenues & Volume By Disinfection for the Period 2022-2032F
- Historical Data and Forecast of Kenya Water Treatment Market Revenues & Volume By Reverse Osmosis for the Period 2022-2032F
- Historical Data and Forecast of Kenya Water Treatment Market Revenues & Volume By Applications for the Period 2022-2032F
- Historical Data and Forecast of Kenya Water Treatment Market Revenues & Volume By Residential? for the Period 2022-2032F
- Historical Data and Forecast of Kenya Water Treatment Market Revenues & Volume By Non-Residential? for the Period 2022-2032F
- Historical Data and Forecast of Kenya Water Treatment Market Revenues & Volume By Installations for the Period 2022-2032F
- Historical Data and Forecast of Kenya Water Treatment Market Revenues & Volume By Point Of Use for the Period 2022-2032F
- Historical Data and Forecast of Kenya Water Treatment Market Revenues & Volume By Point Of Entry for the Period 2022-2032F
- Kenya Water Treatment Import Export Trade Statistics
- Market Opportunity Assessment By Types
- Market Opportunity Assessment By Applications
- Market Opportunity Assessment By Installations
- Kenya Water Treatment Top Companies Market Share
- Kenya Water Treatment Competitive Benchmarking By Technical and Operational Parameters
- Kenya Water Treatment Company Profiles
- Kenya Water Treatment Key Strategic Recommendations
Frequently Asked Questions About the Market Study (FAQs):
The growth is primarily driven by urbanization, stringent governmental regulations on water quality, investment in infrastructure, and rising public awareness about safe drinking water.
Key challenges include limited infrastructure, high operational costs, a shortage of skilled professionals, inconsistent regulatory enforcement, and complex pollution sources.
The government is promoting investment through subsidies, enforcing stringent quality standards, encouraging public-private partnerships, and investing in capacity-building initiatives.
Recent trends include increased adoption of decentralized water treatment solutions, innovations in sustainable technologies, and enhanced collaborations between government and NGOs for water quality monitoring.
6Wresearch actively monitors the Kenya Water Treatment Market and publishes its comprehensive annual report, highlighting emerging trends, growth drivers, revenue analysis, and forecast outlook. Our insights help businesses to make data-backed strategic decisions with ongoing market dynamics. Our analysts track relevent industries related to the Kenya Water Treatment Market, allowing our clients with actionable intelligence and reliable forecasts tailored to emerging regional needs.
Yes, we provide customisation as per your requirements. To learn more, feel free to contact us on sales@6wresearch.com
1 Executive Summary |
2 Introduction |
2.1 Key Highlights of the Report |
2.2 Report Description |
2.3 Market Scope & Segmentation |
2.4 Research Methodology |
2.5 Assumptions |
3 Kenya Water Treatment Market Overview |
3.1 Kenya Country Macro Economic Indicators |
3.2 Kenya Water Treatment Market Revenues & Volume, 2022 & 2032F |
3.3 Kenya Water Treatment Market - Industry Life Cycle |
3.4 Kenya Water Treatment Market - Porter's Five Forces |
3.5 Kenya Water Treatment Market Revenues & Volume Share, By Types, 2022 & 2032F |
3.6 Kenya Water Treatment Market Revenues & Volume Share, By Applications, 2022 & 2032F |
3.7 Kenya Water Treatment Market Revenues & Volume Share, By Installations, 2022 & 2032F |
4 Kenya Water Treatment Market Dynamics |
4.1 Impact Analysis |
4.2 Market Drivers |
4.3 Market Restraints |
5 Kenya Water Treatment Market Trends |
6 Kenya Water Treatment Market, By Types |
6.1 Kenya Water Treatment Market, By Types |
6.1.1 Overview and Analysis |
6.1.2 Kenya Water Treatment Market Revenues & Volume, By Types, 2022-2032F |
6.1.3 Kenya Water Treatment Market Revenues & Volume, By Distillation , 2022-2032F |
6.1.4 Kenya Water Treatment Market Revenues & Volume, By Filtration , 2022-2032F |
6.1.5 Kenya Water Treatment Market Revenues & Volume, By Disinfection, 2022-2032F |
6.1.6 Kenya Water Treatment Market Revenues & Volume, By Reverse Osmosis, 2022-2032F |
6.2 Kenya Water Treatment Market, By Applications |
6.2.1 Overview and Analysis |
6.2.2 Kenya Water Treatment Market Revenues & Volume, By Residential , 2022-2032F |
6.2.3 Kenya Water Treatment Market Revenues & Volume, By Non-Residential , 2022-2032F |
6.3 Kenya Water Treatment Market, By Installations |
6.3.1 Overview and Analysis |
6.3.2 Kenya Water Treatment Market Revenues & Volume, By Point Of Use , 2022-2032F |
6.3.3 Kenya Water Treatment Market Revenues & Volume, By Point Of Entry, 2022-2032F |
7 Kenya Water Treatment Market Import-Export Trade Statistics |
7.1 Kenya Water Treatment Market Export to Major Countries |
7.2 Kenya Water Treatment Market Imports from Major Countries |
8 Kenya Water Treatment Market Key Performance Indicators |
9 Kenya Water Treatment Market - Opportunity Assessment |
9.1 Kenya Water Treatment Market Opportunity Assessment, By Types, 2022 & 2032F |
9.2 Kenya Water Treatment Market Opportunity Assessment, By Applications, 2022 & 2032F |
9.3 Kenya Water Treatment Market Opportunity Assessment, By Installations, 2022 & 2032F |
10 Kenya Water Treatment Market - Competitive Landscape |
10.1 Kenya Water Treatment Market Revenue Share, By Companies, 2025 |
10.2 Kenya Water Treatment Market Competitive Benchmarking, By Operating and Technical Parameters |
11 Company Profiles |
12 Recommendations |
13 Disclaimer |
Global Go To Market Strategy - 2030
Export potential enables firms to identify high-growth global markets with greater confidence by combining advanced trade intelligence with a structured quantitative methodology. The framework analyzes emerging demand trends and country-level import patterns while integrating macroeconomic and trade datasets such as GDP and population forecasts, bilateral import–export flows, tariff structures, elasticity differentials between developed and developing economies, geographic distance, and import demand projections. Using weighted trade values from 2020–2024 as the base period to project country-to-country export potential for 2030, these inputs are operationalized through calculated drivers such as gravity model parameters, tariff impact factors, and projected GDP per-capita growth. Through an analysis of hidden potentials, demand hotspots, and market conditions that are most favorable to success, this method enables firms to focus on target countries, maximize returns, and global expansion with data, backed by accuracy.
By factoring in the projected importer demand gap that is currently unmet and could be potential opportunity, it identifies the potential for the Exporter (Country) among 190 countries, against the general trade analysis, which identifies the biggest importer or exporter.
To discover high-growth global markets and optimize your business strategy:
Click Here
Pricing
- Single User License$ 1,995
- Department License$ 2,400
- Site License$ 3,120
- Global License$ 3,795

Leadership Perspectives from Industry Events
Search
Thought Leadership and Analyst Meet


Our Clients
6WResearch In News
- India Air Conditioner Market Set for Strong Rebound in 2026 After Weather-Led Correction and GST-Driven Recovery: 6Wresearch
- ADAS in India: How Automatic Emergency Braking, Blind Spot Detection & Driver Monitoring are Transforming Road Safety
- Doha a strategic location for EV manufacturing hub: IPA Qatar
- Demand for luxury TVs surging in the GCC, says Samsung
- Empowering Growth: The Thriving Journey of Bangladesh’s Cable Industry
- Demand for luxury TVs surging in the GCC, says Samsung
Latest Reports
- Nicaragua RPG Gaming Market (2026-2032)
- New Zealand RPG Gaming Market (2026-2032)
- Netherlands RPG Gaming Market (2026-2032)
- Nauru RPG Gaming Market (2026-2032)
- Namibia RPG Gaming Market (2026-2032)
- Mozambique RPG Gaming Market (2026-2032)
- Montenegro RPG Gaming Market (2026-2032)
- Mongolia RPG Gaming Market (2026-2032)
- Monaco RPG Gaming Market (2026-2032)
- Micronesia RPG Gaming Market (2026-2032)
Industry Events and Analyst Meet

HIMTEX 2026

India Refining Summit 2026

India EV Show 2026

EV tech India Expo 2026

Auto Tech Asia 2026
Whitepaper
- Middle East & Africa Commercial Security Market Click here to view more.
- Middle East & Africa Fire Safety Systems & Equipment Market Click here to view more.
- GCC Drone Market Click here to view more.
- Middle East Lighting Fixture Market Click here to view more.
- GCC Physical & Perimeter Security Market Click here to view more.