Latvia Chemical Pump Market (2026-2032) | Industry, Strategy, Restraints, Drivers, Demand, Outlook, Competitive, Investment Trends, Competition, Share, Strategic Insights, Forecast, Growth, Segmentation, Pricing Analysis, Challenges, Revenue, Value, Trends, Analysis, Consumer Insights, Companies, Segments, Opportunities, Size, Supply
Market Forecast By Product Type (Positive Displacement Pumps, Centrifugal Pumps, Peristaltic Pumps, Gear Pumps), By Technology Type (Diaphragm Pump Technology, Magnetic Drive Technology, Hose Pump Technology, Internal Gear Technology), By End User (Oil and Gas Industry, Water Treatment Plants, Food and Beverage Industry, Chemical Industry), By Application (Fluid Transfer, Chemical Dosing Filtration, Ingredient and Additive Mixing, Viscous Liquid Transfer) And Competitive Landscape
| Product Code: ETC11573173 | Publication Date: Apr 2025 | Updated Date: Apr 2026 | Product Type: Market Research Report | |
| Publisher: 6Wresearch | Author: Bhawna Singh | No. of Pages: 65 | No. of Figures: 34 | No. of Tables: 19 |
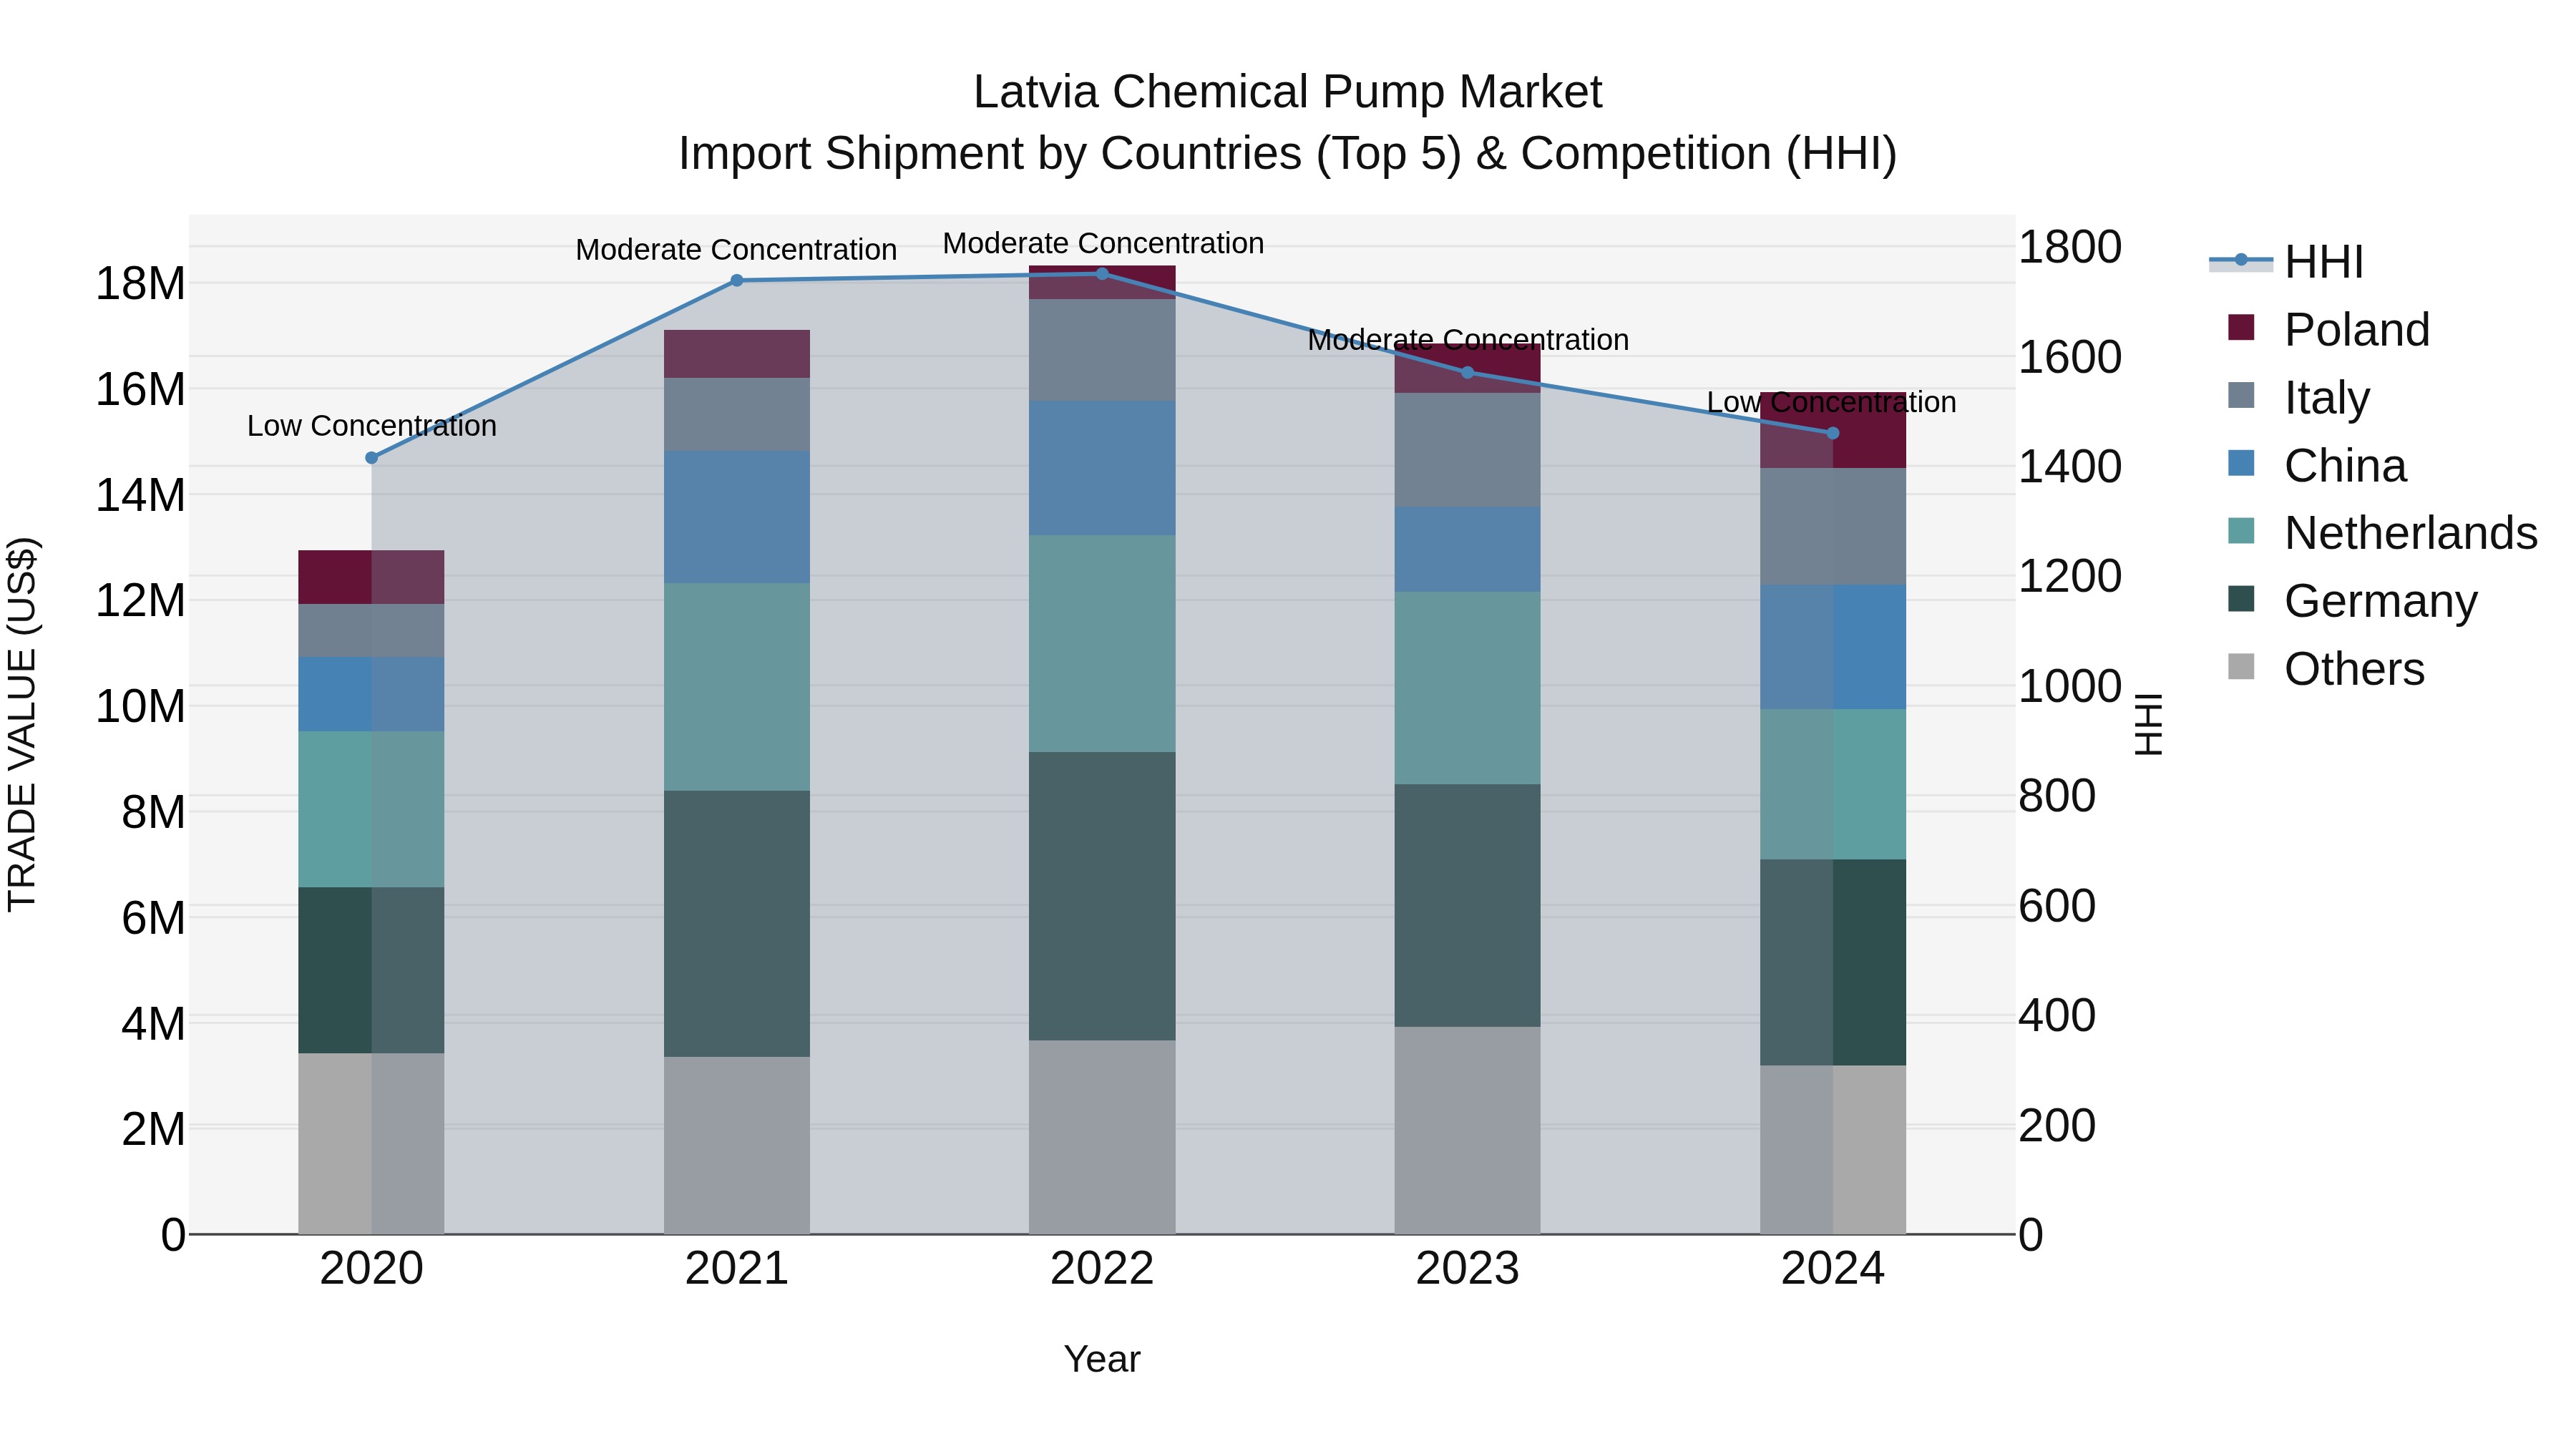
Latvia Chemical Pump Market Top 5 Importing Countries and Market Competition (HHI) Analysis
In 2024, Latvia saw a shift in chemical pump imports with top exporters being Germany, Netherlands, China, Italy, and Poland. The Herfindahl-Hirschman Index (HHI) decreased from moderate to low concentration, indicating a more diverse market. Despite a slight decline in growth rate from 2023 to 2024, the compound annual growth rate (CAGR) over the period of 2020-2024 remained positive at 5.34%. This suggests a steady increase in demand for chemical pumps in Latvia, with a more competitive market landscape and a variety of sources for imports.
Key Highlights of the Report:
- Latvia Chemical Pump Market Outlook
- Market Size of Latvia Chemical Pump Market, 2025
- Forecast of Latvia Chemical Pump Market, 2032
- Historical Data and Forecast of Latvia Chemical Pump Revenues & Volume for the Period 2022 - 2032F
- Latvia Chemical Pump Market Trend Evolution
- Latvia Chemical Pump Market Drivers and Challenges
- Latvia Chemical Pump Price Trends
- Latvia Chemical Pump Porter's Five Forces
- Latvia Chemical Pump Industry Life Cycle
- Historical Data and Forecast of Latvia Chemical Pump Market Revenues & Volume By Product Type for the Period 2022 - 2032F
- Historical Data and Forecast of Latvia Chemical Pump Market Revenues & Volume By Positive Displacement Pumps for the Period 2022 - 2032F
- Historical Data and Forecast of Latvia Chemical Pump Market Revenues & Volume By Centrifugal Pumps for the Period 2022 - 2032F
- Historical Data and Forecast of Latvia Chemical Pump Market Revenues & Volume By Peristaltic Pumps for the Period 2022 - 2032F
- Historical Data and Forecast of Latvia Chemical Pump Market Revenues & Volume By Gear Pumps for the Period 2022 - 2032F
- Historical Data and Forecast of Latvia Chemical Pump Market Revenues & Volume By Technology Type for the Period 2022 - 2032F
- Historical Data and Forecast of Latvia Chemical Pump Market Revenues & Volume By Diaphragm Pump Technology for the Period 2022 - 2032F
- Historical Data and Forecast of Latvia Chemical Pump Market Revenues & Volume By Magnetic Drive Technology for the Period 2022 - 2032F
- Historical Data and Forecast of Latvia Chemical Pump Market Revenues & Volume By Hose Pump Technology for the Period 2022 - 2032F
- Historical Data and Forecast of Latvia Chemical Pump Market Revenues & Volume By Internal Gear Technology for the Period 2022 - 2032F
- Historical Data and Forecast of Latvia Chemical Pump Market Revenues & Volume By End User for the Period 2022 - 2032F
- Historical Data and Forecast of Latvia Chemical Pump Market Revenues & Volume By Oil and Gas Industry for the Period 2022 - 2032F
- Historical Data and Forecast of Latvia Chemical Pump Market Revenues & Volume By Water Treatment Plants for the Period 2022 - 2032F
- Historical Data and Forecast of Latvia Chemical Pump Market Revenues & Volume By Food and Beverage Industry for the Period 2022 - 2032F
- Historical Data and Forecast of Latvia Chemical Pump Market Revenues & Volume By Chemical Industry for the Period 2022 - 2032F
- Historical Data and Forecast of Latvia Chemical Pump Market Revenues & Volume By Application for the Period 2022 - 2032F
- Historical Data and Forecast of Latvia Chemical Pump Market Revenues & Volume By Fluid Transfer for the Period 2022 - 2032F
- Historical Data and Forecast of Latvia Chemical Pump Market Revenues & Volume By Chemical Dosing Filtration for the Period 2022 - 2032F
- Historical Data and Forecast of Latvia Chemical Pump Market Revenues & Volume By Ingredient and Additive Mixing for the Period 2022 - 2032F
- Historical Data and Forecast of Latvia Chemical Pump Market Revenues & Volume By Viscous Liquid Transfer for the Period 2022 - 2032F
- Latvia Chemical Pump Import Export Trade Statistics
- Market Opportunity Assessment By Product Type
- Market Opportunity Assessment By Technology Type
- Market Opportunity Assessment By End User
- Market Opportunity Assessment By Application
- Latvia Chemical Pump Top Companies Market Share
- Latvia Chemical Pump Competitive Benchmarking By Technical and Operational Parameters
- Latvia Chemical Pump Company Profiles
- Latvia Chemical Pump Key Strategic Recommendations
Frequently Asked Questions About the Market Study (FAQs):
6Wresearch actively monitors the Latvia Chemical Pump Market and publishes its comprehensive annual report, highlighting emerging trends, growth drivers, revenue analysis, and forecast outlook. Our insights help businesses to make data-backed strategic decisions with ongoing market dynamics. Our analysts track relevent industries related to the Latvia Chemical Pump Market, allowing our clients with actionable intelligence and reliable forecasts tailored to emerging regional needs.
Yes, we provide customisation as per your requirements. To learn more, feel free to contact us on sales@6wresearch.com
1 Executive Summary |
2 Introduction |
2.1 Key Highlights of the Report |
2.2 Report Description |
2.3 Market Scope & Segmentation |
2.4 Research Methodology |
2.5 Assumptions |
3 Latvia Chemical Pump Market Overview |
3.1 Latvia Country Macro Economic Indicators |
3.2 Latvia Chemical Pump Market Revenues & Volume, 2022 & 2032F |
3.3 Latvia Chemical Pump Market - Industry Life Cycle |
3.4 Latvia Chemical Pump Market - Porter's Five Forces |
3.5 Latvia Chemical Pump Market Revenues & Volume Share, By Product Type, 2022 & 2032F |
3.6 Latvia Chemical Pump Market Revenues & Volume Share, By Technology Type, 2022 & 2032F |
3.7 Latvia Chemical Pump Market Revenues & Volume Share, By End User, 2022 & 2032F |
3.8 Latvia Chemical Pump Market Revenues & Volume Share, By Application, 2022 & 2032F |
4 Latvia Chemical Pump Market Dynamics |
4.1 Impact Analysis |
4.2 Market Drivers |
4.2.1 Increasing demand for chemical pumps in various industries such as chemical processing, water treatment, and pharmaceuticals. |
4.2.2 Emphasis on improving operational efficiency and reducing maintenance costs driving the adoption of advanced chemical pump technologies. |
4.2.3 Growing focus on environmental regulations and sustainability, leading to the need for more efficient and eco-friendly chemical pump solutions. |
4.3 Market Restraints |
4.3.1 High initial investment costs associated with purchasing and installing chemical pumps. |
4.3.2 Technical complexities and maintenance requirements of chemical pumps leading to operational challenges for end-users. |
4.3.3 Economic uncertainties and fluctuations impacting investment decisions in industrial equipment like chemical pumps. |
5 Latvia Chemical Pump Market Trends |
6 Latvia Chemical Pump Market, By Types |
6.1 Latvia Chemical Pump Market, By Product Type |
6.1.1 Overview and Analysis |
6.1.2 Latvia Chemical Pump Market Revenues & Volume, By Product Type, 2022 - 2032F |
6.1.3 Latvia Chemical Pump Market Revenues & Volume, By Positive Displacement Pumps, 2022 - 2032F |
6.1.4 Latvia Chemical Pump Market Revenues & Volume, By Centrifugal Pumps, 2022 - 2032F |
6.1.5 Latvia Chemical Pump Market Revenues & Volume, By Peristaltic Pumps, 2022 - 2032F |
6.1.6 Latvia Chemical Pump Market Revenues & Volume, By Gear Pumps, 2022 - 2032F |
6.2 Latvia Chemical Pump Market, By Technology Type |
6.2.1 Overview and Analysis |
6.2.2 Latvia Chemical Pump Market Revenues & Volume, By Diaphragm Pump Technology, 2022 - 2032F |
6.2.3 Latvia Chemical Pump Market Revenues & Volume, By Magnetic Drive Technology, 2022 - 2032F |
6.2.4 Latvia Chemical Pump Market Revenues & Volume, By Hose Pump Technology, 2022 - 2032F |
6.2.5 Latvia Chemical Pump Market Revenues & Volume, By Internal Gear Technology, 2022 - 2032F |
6.3 Latvia Chemical Pump Market, By End User |
6.3.1 Overview and Analysis |
6.3.2 Latvia Chemical Pump Market Revenues & Volume, By Oil and Gas Industry, 2022 - 2032F |
6.3.3 Latvia Chemical Pump Market Revenues & Volume, By Water Treatment Plants, 2022 - 2032F |
6.3.4 Latvia Chemical Pump Market Revenues & Volume, By Food and Beverage Industry, 2022 - 2032F |
6.3.5 Latvia Chemical Pump Market Revenues & Volume, By Chemical Industry, 2022 - 2032F |
6.4 Latvia Chemical Pump Market, By Application |
6.4.1 Overview and Analysis |
6.4.2 Latvia Chemical Pump Market Revenues & Volume, By Fluid Transfer, 2022 - 2032F |
6.4.3 Latvia Chemical Pump Market Revenues & Volume, By Chemical Dosing Filtration, 2022 - 2032F |
6.4.4 Latvia Chemical Pump Market Revenues & Volume, By Ingredient and Additive Mixing, 2022 - 2032F |
6.4.5 Latvia Chemical Pump Market Revenues & Volume, By Viscous Liquid Transfer, 2022 - 2032F |
7 Latvia Chemical Pump Market Import-Export Trade Statistics |
7.1 Latvia Chemical Pump Market Export to Major Countries |
7.2 Latvia Chemical Pump Market Imports from Major Countries |
8 Latvia Chemical Pump Market Key Performance Indicators |
8.1 Energy efficiency improvements in chemical pump systems. |
8.2 Reduction in downtime and maintenance costs. |
8.3 Increase in the adoption rate of smart and IoT-enabled chemical pump technologies. |
8.4 Growth in demand for aftermarket services and solutions. |
8.5 Number of successful product innovations and technological advancements in the chemical pump market. |
9 Latvia Chemical Pump Market - Opportunity Assessment |
9.1 Latvia Chemical Pump Market Opportunity Assessment, By Product Type, 2022 & 2032F |
9.2 Latvia Chemical Pump Market Opportunity Assessment, By Technology Type, 2022 & 2032F |
9.3 Latvia Chemical Pump Market Opportunity Assessment, By End User, 2022 & 2032F |
9.4 Latvia Chemical Pump Market Opportunity Assessment, By Application, 2022 & 2032F |
10 Latvia Chemical Pump Market - Competitive Landscape |
10.1 Latvia Chemical Pump Market Revenue Share, By Companies, 2025 |
10.2 Latvia Chemical Pump Market Competitive Benchmarking, By Operating and Technical Parameters |
11 Company Profiles |
12 Recommendations |
13 Disclaimer |
Export potential assessment - trade Analytics for 2030
Export potential enables firms to identify high-growth global markets with greater confidence by combining advanced trade intelligence with a structured quantitative methodology. The framework analyzes emerging demand trends and country-level import patterns while integrating macroeconomic and trade datasets such as GDP and population forecasts, bilateral import–export flows, tariff structures, elasticity differentials between developed and developing economies, geographic distance, and import demand projections. Using weighted trade values from 2020–2024 as the base period to project country-to-country export potential for 2030, these inputs are operationalized through calculated drivers such as gravity model parameters, tariff impact factors, and projected GDP per-capita growth. Through an analysis of hidden potentials, demand hotspots, and market conditions that are most favorable to success, this method enables firms to focus on target countries, maximize returns, and global expansion with data, backed by accuracy.
By factoring in the projected importer demand gap that is currently unmet and could be potential opportunity, it identifies the potential for the Exporter (Country) among 190 countries, against the general trade analysis, which identifies the biggest importer or exporter.
To discover high-growth global markets and optimize your business strategy:
Click Here
Pricing
- Single User License$ 1,995
- Department License$ 2,400
- Site License$ 3,120
- Global License$ 3,795

Search
Thought Leadership and Analyst Meet


Our Clients
Latest Reports
- China Electric Appliance Rental Market (2026-2032) | Trends, Revenue, Growth, Challenges, Size, Value, Outlook, Pricing, Strategy, Insights, Restraints, segmentation, Companies, Investment Opportunities, Analysis, Demand, Drivers, Competition, Forecast, Share
- Chile Electric Appliance Rental Market (2026-2032) | Outlook, Competition, Drivers, Strategy, Revenue, Analysis, Value, Pricing, Restraints, Size, Demand, Share, Growth, Forecast, Challenges, Insights, Investment Opportunities, Companies, Trends, segmentation
- Cambodia Electric Appliance Rental Market (2026-2032) | Companies, Analysis, Restraints, Pricing, Insights, Challenges, Outlook, Strategy, Forecast, Trends, Competition, Value, Revenue, Investment Opportunities, segmentation, Drivers, Size, Demand, Growth, Share
- Brazil Electric Appliance Rental Market (2026-2032) | Revenue, Strategy, Forecast, Companies, segmentation, Competition, Size, Investment Opportunities, Pricing, Restraints, Outlook, Challenges, Analysis, Drivers, Value, Demand, Insights, Trends, Growth, Share
- Bangladesh Electric Appliance Rental Market (2026-2032) | Drivers, Forecast, Investment Opportunities, Strategy, Insights, Demand, Challenges, Outlook, Trends, Competition, Value, Revenue, Size, Pricing, Analysis, Companies, Restraints, segmentation, Share, Growth
- Bahrain Electric Appliance Rental Market (2026-2032) | Outlook, Size, Competition, Restraints, Drivers, Value, Trends, Investment Opportunities, Insights, Forecast, Revenue, Strategy, Growth, Share, Demand, Analysis, Challenges, Companies, segmentation, Pricing
- Azerbaijan Electric Appliance Rental Market (2026-2032) | Trends, Investment Opportunities, Restraints, Insights, Strategy, Competition, Value, Growth, Demand, Drivers, Analysis, Forecast, Size, Share, Outlook, segmentation, Pricing, Challenges, Revenue, Companies
- Australia Electric Appliance Rental Market (2026-2032) | Challenges, Restraints, Forecast, Demand, Size, Competition, Pricing, Investment Opportunities, Revenue, Trends, Drivers, Growth, Outlook, Analysis, Strategy, Value, segmentation, Insights, Companies, Share
- Argentina Electric Appliance Rental Market (2026-2032) | Growth, Trends, Insights, Outlook, Forecast, Size, Drivers, Analysis, Restraints, Challenges, Share, Revenue, Investment Opportunities, Strategy, Demand, Value, Companies, segmentation, Competition, Pricing
- Algeria Electric Appliance Rental Market (2026-2032) | Share, Size, Value, Strategy, Competition, Outlook, Challenges, Companies, Trends, Pricing, Insights, Forecast, Investment Opportunities, Revenue, Growth, Restraints, segmentation, Analysis, Demand, Drivers
Industry Events and Analyst Meet

HIMTEX 2026

India Refining Summit 2026

India EV Show 2026

EV tech India Expo 2026

Auto Tech Asia 2026
Whitepaper
- Middle East & Africa Commercial Security Market Click here to view more.
- Middle East & Africa Fire Safety Systems & Equipment Market Click here to view more.
- GCC Drone Market Click here to view more.
- Middle East Lighting Fixture Market Click here to view more.
- GCC Physical & Perimeter Security Market Click here to view more.
6WResearch In News
- Doha a strategic location for EV manufacturing hub: IPA Qatar
- Demand for luxury TVs surging in the GCC, says Samsung
- Empowering Growth: The Thriving Journey of Bangladesh’s Cable Industry
- Demand for luxury TVs surging in the GCC, says Samsung
- Video call with a traditional healer? Once unthinkable, it’s now common in South Africa
- Intelligent Buildings To Smooth GCC’s Path To Net Zero