Latvia Computed Tomography Scanners Market (2026-2032) | Investment Trends, Pricing Analysis, Analysis, Outlook, Share, Consumer Insights, Trends, Strategy, Restraints, Industry, Opportunities, Competitive, Competition, Challenges, Companies, Growth, Drivers, Demand, Segmentation, Revenue, Value, Strategic Insights, Size, Segments, Forecast, Supply
Market Forecast By Scanner Type (Stationary CT Scanners, Mobile CT Scanners, Handheld CT Scanners, Hybrid PET-CT Scanners), By Technology (Spiral CT, Multi-Slice CT, Cone Beam CT, AI-Powered CT), By Application (Trauma & Emergency, Pulmonary Imaging, Dental Imaging, Cardiovascular), By End User (Hospitals, Diagnostic Centers, Dental Clinics, Research Institutions), By Software (3D Imaging Software, AI-Based Image Processing, Cloud-Based Image Storage, Machine Learning Integration) And Competitive Landscape
| Product Code: ETC11544949 | Publication Date: Apr 2025 | Updated Date: Apr 2026 | Product Type: Market Research Report | |
| Publisher: 6Wresearch | No. of Pages: 65 | No. of Figures: 34 | No. of Tables: 19 | |
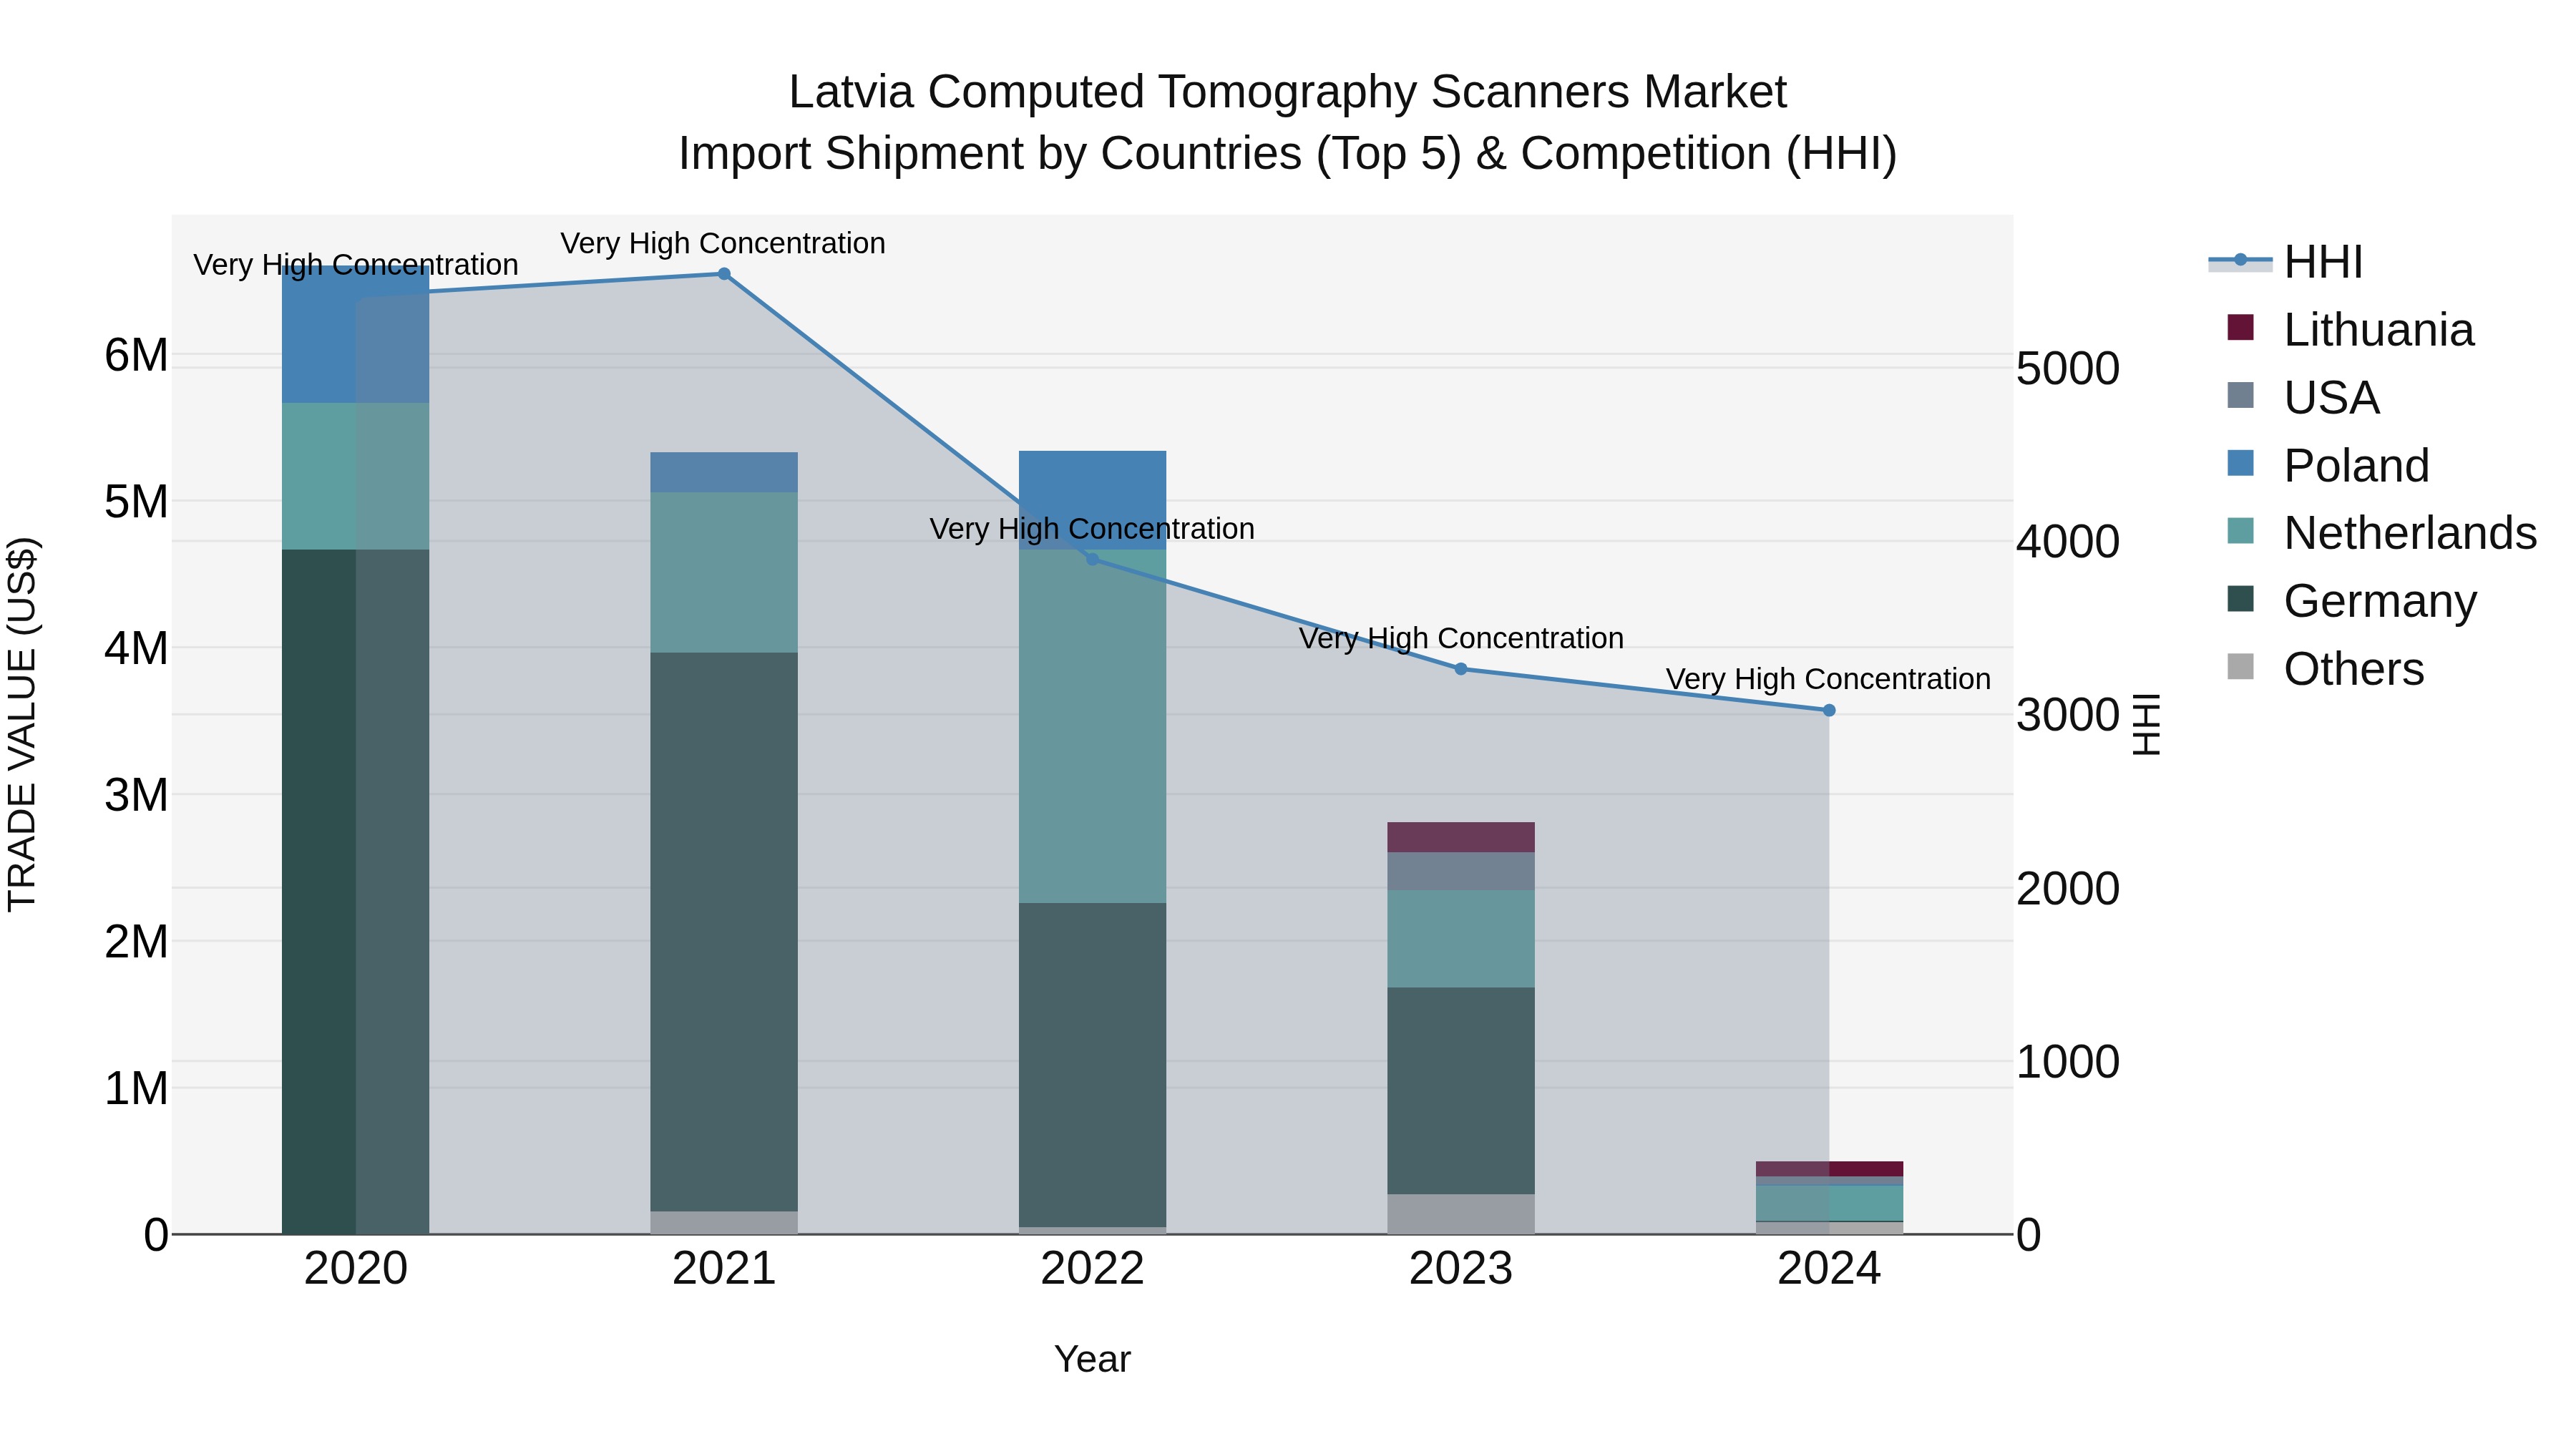
Latvia Computed Tomography Scanners Market Top 5 Importing Countries and Market Competition (HHI) Analysis
Despite a significant decline in the CAGR and growth rate from 2020 to 2024, Latvia`s import market for computed tomography scanners continued to show high concentration with top exporters including Netherlands, Lithuania, Metropolitan France, USA, and Poland. The high Herfindahl-Hirschman Index (HHI) in 2024 indicates a notable level of market concentration. This trend suggests that despite challenges in recent years, these top exporting countries remain key players in supplying computed tomography scanners to Latvia.
Key Highlights of the Report:
- Latvia Computed Tomography Scanners Market Outlook
- Market Size of Latvia Computed Tomography Scanners Market, 2025
- Forecast of Latvia Computed Tomography Scanners Market, 2032
- Historical Data and Forecast of Latvia Computed Tomography Scanners Revenues & Volume for the Period 2022 - 2032F
- Latvia Computed Tomography Scanners Market Trend Evolution
- Latvia Computed Tomography Scanners Market Drivers and Challenges
- Latvia Computed Tomography Scanners Price Trends
- Latvia Computed Tomography Scanners Porter's Five Forces
- Latvia Computed Tomography Scanners Industry Life Cycle
- Historical Data and Forecast of Latvia Computed Tomography Scanners Market Revenues & Volume By Scanner Type for the Period 2022 - 2032F
- Historical Data and Forecast of Latvia Computed Tomography Scanners Market Revenues & Volume By Stationary CT Scanners for the Period 2022 - 2032F
- Historical Data and Forecast of Latvia Computed Tomography Scanners Market Revenues & Volume By Mobile CT Scanners for the Period 2022 - 2032F
- Historical Data and Forecast of Latvia Computed Tomography Scanners Market Revenues & Volume By Handheld CT Scanners for the Period 2022 - 2032F
- Historical Data and Forecast of Latvia Computed Tomography Scanners Market Revenues & Volume By Hybrid PET-CT Scanners for the Period 2022 - 2032F
- Historical Data and Forecast of Latvia Computed Tomography Scanners Market Revenues & Volume By Technology for the Period 2022 - 2032F
- Historical Data and Forecast of Latvia Computed Tomography Scanners Market Revenues & Volume By Spiral CT for the Period 2022 - 2032F
- Historical Data and Forecast of Latvia Computed Tomography Scanners Market Revenues & Volume By Multi-Slice CT for the Period 2022 - 2032F
- Historical Data and Forecast of Latvia Computed Tomography Scanners Market Revenues & Volume By Cone Beam CT for the Period 2022 - 2032F
- Historical Data and Forecast of Latvia Computed Tomography Scanners Market Revenues & Volume By AI-Powered CT for the Period 2022 - 2032F
- Historical Data and Forecast of Latvia Computed Tomography Scanners Market Revenues & Volume By Application for the Period 2022 - 2032F
- Historical Data and Forecast of Latvia Computed Tomography Scanners Market Revenues & Volume By Trauma & Emergency for the Period 2022 - 2032F
- Historical Data and Forecast of Latvia Computed Tomography Scanners Market Revenues & Volume By Pulmonary Imaging for the Period 2022 - 2032F
- Historical Data and Forecast of Latvia Computed Tomography Scanners Market Revenues & Volume By Dental Imaging for the Period 2022 - 2032F
- Historical Data and Forecast of Latvia Computed Tomography Scanners Market Revenues & Volume By Cardiovascular for the Period 2022 - 2032F
- Historical Data and Forecast of Latvia Computed Tomography Scanners Market Revenues & Volume By End User for the Period 2022 - 2032F
- Historical Data and Forecast of Latvia Computed Tomography Scanners Market Revenues & Volume By Hospitals for the Period 2022 - 2032F
- Historical Data and Forecast of Latvia Computed Tomography Scanners Market Revenues & Volume By Diagnostic Centers for the Period 2022 - 2032F
- Historical Data and Forecast of Latvia Computed Tomography Scanners Market Revenues & Volume By Dental Clinics for the Period 2022 - 2032F
- Historical Data and Forecast of Latvia Computed Tomography Scanners Market Revenues & Volume By Research Institutions for the Period 2022 - 2032F
- Historical Data and Forecast of Latvia Computed Tomography Scanners Market Revenues & Volume By Software for the Period 2022 - 2032F
- Historical Data and Forecast of Latvia Computed Tomography Scanners Market Revenues & Volume By 3D Imaging Software for the Period 2022 - 2032F
- Historical Data and Forecast of Latvia Computed Tomography Scanners Market Revenues & Volume By AI-Based Image Processing for the Period 2022 - 2032F
- Historical Data and Forecast of Latvia Computed Tomography Scanners Market Revenues & Volume By Cloud-Based Image Storage for the Period 2022 - 2032F
- Historical Data and Forecast of Latvia Computed Tomography Scanners Market Revenues & Volume By Machine Learning Integration for the Period 2022 - 2032F
- Latvia Computed Tomography Scanners Import Export Trade Statistics
- Market Opportunity Assessment By Scanner Type
- Market Opportunity Assessment By Technology
- Market Opportunity Assessment By Application
- Market Opportunity Assessment By End User
- Market Opportunity Assessment By Software
- Latvia Computed Tomography Scanners Top Companies Market Share
- Latvia Computed Tomography Scanners Competitive Benchmarking By Technical and Operational Parameters
- Latvia Computed Tomography Scanners Company Profiles
- Latvia Computed Tomography Scanners Key Strategic Recommendations
Frequently Asked Questions About the Market Study (FAQs):
6Wresearch actively monitors the Latvia Computed Tomography Scanners Market and publishes its comprehensive annual report, highlighting emerging trends, growth drivers, revenue analysis, and forecast outlook. Our insights help businesses to make data-backed strategic decisions with ongoing market dynamics. Our analysts track relevent industries related to the Latvia Computed Tomography Scanners Market, allowing our clients with actionable intelligence and reliable forecasts tailored to emerging regional needs.
Yes, we provide customisation as per your requirements. To learn more, feel free to contact us on sales@6wresearch.com
1 Executive Summary |
2 Introduction |
2.1 Key Highlights of the Report |
2.2 Report Description |
2.3 Market Scope & Segmentation |
2.4 Research Methodology |
2.5 Assumptions |
3 Latvia Computed Tomography Scanners Market Overview |
3.1 Latvia Country Macro Economic Indicators |
3.2 Latvia Computed Tomography Scanners Market Revenues & Volume, 2022 & 2032F |
3.3 Latvia Computed Tomography Scanners Market - Industry Life Cycle |
3.4 Latvia Computed Tomography Scanners Market - Porter's Five Forces |
3.5 Latvia Computed Tomography Scanners Market Revenues & Volume Share, By Scanner Type, 2022 & 2032F |
3.6 Latvia Computed Tomography Scanners Market Revenues & Volume Share, By Technology, 2022 & 2032F |
3.7 Latvia Computed Tomography Scanners Market Revenues & Volume Share, By Application, 2022 & 2032F |
3.8 Latvia Computed Tomography Scanners Market Revenues & Volume Share, By End User, 2022 & 2032F |
3.9 Latvia Computed Tomography Scanners Market Revenues & Volume Share, By Software, 2022 & 2032F |
4 Latvia Computed Tomography Scanners Market Dynamics |
4.1 Impact Analysis |
4.2 Market Drivers |
4.2.1 Increasing prevalence of chronic diseases requiring diagnostic imaging, driving the demand for computed tomography scanners. |
4.2.2 Technological advancements leading to the development of more efficient and accurate CT scanners. |
4.2.3 Growing investments in healthcare infrastructure in Latvia, supporting the adoption of advanced medical equipment like CT scanners. |
4.3 Market Restraints |
4.3.1 High initial costs associated with the purchase and installation of computed tomography scanners. |
4.3.2 Limited reimbursement policies for CT scans in Latvia, affecting the affordability for patients and healthcare facilities. |
4.3.3 Regulatory hurdles and compliance requirements impacting the procurement and usage of CT scanners in the market. |
5 Latvia Computed Tomography Scanners Market Trends |
6 Latvia Computed Tomography Scanners Market, By Types |
6.1 Latvia Computed Tomography Scanners Market, By Scanner Type |
6.1.1 Overview and Analysis |
6.1.2 Latvia Computed Tomography Scanners Market Revenues & Volume, By Scanner Type, 2022 - 2032F |
6.1.3 Latvia Computed Tomography Scanners Market Revenues & Volume, By Stationary CT Scanners, 2022 - 2032F |
6.1.4 Latvia Computed Tomography Scanners Market Revenues & Volume, By Mobile CT Scanners, 2022 - 2032F |
6.1.5 Latvia Computed Tomography Scanners Market Revenues & Volume, By Handheld CT Scanners, 2022 - 2032F |
6.1.6 Latvia Computed Tomography Scanners Market Revenues & Volume, By Hybrid PET-CT Scanners, 2022 - 2032F |
6.2 Latvia Computed Tomography Scanners Market, By Technology |
6.2.1 Overview and Analysis |
6.2.2 Latvia Computed Tomography Scanners Market Revenues & Volume, By Spiral CT, 2022 - 2032F |
6.2.3 Latvia Computed Tomography Scanners Market Revenues & Volume, By Multi-Slice CT, 2022 - 2032F |
6.2.4 Latvia Computed Tomography Scanners Market Revenues & Volume, By Cone Beam CT, 2022 - 2032F |
6.2.5 Latvia Computed Tomography Scanners Market Revenues & Volume, By AI-Powered CT, 2022 - 2032F |
6.3 Latvia Computed Tomography Scanners Market, By Application |
6.3.1 Overview and Analysis |
6.3.2 Latvia Computed Tomography Scanners Market Revenues & Volume, By Trauma & Emergency, 2022 - 2032F |
6.3.3 Latvia Computed Tomography Scanners Market Revenues & Volume, By Pulmonary Imaging, 2022 - 2032F |
6.3.4 Latvia Computed Tomography Scanners Market Revenues & Volume, By Dental Imaging, 2022 - 2032F |
6.3.5 Latvia Computed Tomography Scanners Market Revenues & Volume, By Cardiovascular, 2022 - 2032F |
6.4 Latvia Computed Tomography Scanners Market, By End User |
6.4.1 Overview and Analysis |
6.4.2 Latvia Computed Tomography Scanners Market Revenues & Volume, By Hospitals, 2022 - 2032F |
6.4.3 Latvia Computed Tomography Scanners Market Revenues & Volume, By Diagnostic Centers, 2022 - 2032F |
6.4.4 Latvia Computed Tomography Scanners Market Revenues & Volume, By Dental Clinics, 2022 - 2032F |
6.4.5 Latvia Computed Tomography Scanners Market Revenues & Volume, By Research Institutions, 2022 - 2032F |
6.5 Latvia Computed Tomography Scanners Market, By Software |
6.5.1 Overview and Analysis |
6.5.2 Latvia Computed Tomography Scanners Market Revenues & Volume, By 3D Imaging Software, 2022 - 2032F |
6.5.3 Latvia Computed Tomography Scanners Market Revenues & Volume, By AI-Based Image Processing, 2022 - 2032F |
6.5.4 Latvia Computed Tomography Scanners Market Revenues & Volume, By Cloud-Based Image Storage, 2022 - 2032F |
6.5.5 Latvia Computed Tomography Scanners Market Revenues & Volume, By Machine Learning Integration, 2022 - 2032F |
7 Latvia Computed Tomography Scanners Market Import-Export Trade Statistics |
7.1 Latvia Computed Tomography Scanners Market Export to Major Countries |
7.2 Latvia Computed Tomography Scanners Market Imports from Major Countries |
8 Latvia Computed Tomography Scanners Market Key Performance Indicators |
8.1 Average waiting time for CT scans in healthcare facilities. |
8.2 Utilization rate of CT scanners in hospitals and diagnostic centers. |
8.3 Percentage of healthcare facilities offering 24/7 CT scanning services. |
8.4 Rate of adoption of new CT imaging technologies in the market. |
8.5 Patient satisfaction scores related to the quality and efficiency of CT scan services. |
9 Latvia Computed Tomography Scanners Market - Opportunity Assessment |
9.1 Latvia Computed Tomography Scanners Market Opportunity Assessment, By Scanner Type, 2022 & 2032F |
9.2 Latvia Computed Tomography Scanners Market Opportunity Assessment, By Technology, 2022 & 2032F |
9.3 Latvia Computed Tomography Scanners Market Opportunity Assessment, By Application, 2022 & 2032F |
9.4 Latvia Computed Tomography Scanners Market Opportunity Assessment, By End User, 2022 & 2032F |
9.5 Latvia Computed Tomography Scanners Market Opportunity Assessment, By Software, 2022 & 2032F |
10 Latvia Computed Tomography Scanners Market - Competitive Landscape |
10.1 Latvia Computed Tomography Scanners Market Revenue Share, By Companies, 2025 |
10.2 Latvia Computed Tomography Scanners Market Competitive Benchmarking, By Operating and Technical Parameters |
11 Company Profiles |
12 Recommendations |
13 Disclaimer |
Export potential assessment - trade Analytics for 2030
Export potential enables firms to identify high-growth global markets with greater confidence by combining advanced trade intelligence with a structured quantitative methodology. The framework analyzes emerging demand trends and country-level import patterns while integrating macroeconomic and trade datasets such as GDP and population forecasts, bilateral import–export flows, tariff structures, elasticity differentials between developed and developing economies, geographic distance, and import demand projections. Using weighted trade values from 2020–2024 as the base period to project country-to-country export potential for 2030, these inputs are operationalized through calculated drivers such as gravity model parameters, tariff impact factors, and projected GDP per-capita growth. Through an analysis of hidden potentials, demand hotspots, and market conditions that are most favorable to success, this method enables firms to focus on target countries, maximize returns, and global expansion with data, backed by accuracy.
By factoring in the projected importer demand gap that is currently unmet and could be potential opportunity, it identifies the potential for the Exporter (Country) among 190 countries, against the general trade analysis, which identifies the biggest importer or exporter.
To discover high-growth global markets and optimize your business strategy:
Click Here
Pricing
- Single User License$ 1,995
- Department License$ 2,400
- Site License$ 3,120
- Global License$ 3,795

Search
Thought Leadership and Analyst Meet


Our Clients
Latest Reports
- Taiwan Food Delivery Platform Market (2026-2032) | Companies, Outlook, Analysis, Trends, Value, Revenue, Segmentation, Share, Forecast, Competitive Landscape, Growth, Size & Forecast
- United Kingdom (UK) Long-term Care Insurance Market (2026-2032) | Growth, Share, Consumer Insights, Drivers, Opportunities, Competition, Pricing Analysis, Segments, Restraints, Companies, Competitive, Value, Outlook, Size, Demand, Analysis, Challenges, Strategic Insights, Investment Trends, Revenue, Trends, Supply, Forecast
- United Kingdom (UK) Long Term Care Market (2026-2032) | Companies, Outlook, Analysis, Trends, Value, Revenue, Segmentation, Share, Forecast, Competitive Landscape, Growth, Size & Forecast
- Iraq Insulation and Waterproofing Market (2026-2032) | Outlook, Drivers, Growth, Size, Share, Industry, Revenue, Trends, Demand, Competitive, Strategic Insights, Opportunities, Segments, Companies, Challenges, Strategy, Consumer Insights, Analysis, Investment Trends, Value, Segmentation, Forecast, Restraints
- India Switchgear Market Outlook (2026-2032) | Size, Share, Trends, Growth, Revenue, Forecast, Analysis, Value, Outlook
- Pakistan Contraceptive Implants Market (2025-2031) | Demand, Growth, Size, Share, Industry, Pricing Analysis, Competitive, Strategic Insights, Strategy, Consumer Insights, Analysis, Investment Trends, Opportunities, Revenue, Segments, Value, Segmentation, Supply, Forecast, Restraints, Outlook, Competition, Drivers, Trends, Companies, Challenges
- Sri Lanka Packaging Market (2026-2032) | Outlook, Competition, Drivers, Trends, Demand, Pricing Analysis, Competitive, Strategic Insights, Companies, Challenges, Strategy, Consumer Insights, Analysis, Investment Trends, Opportunities, Growth, Size, Share, Industry, Revenue, Segments, Value, Segmentation, Supply, Forecast, Restraints
- India Kids Watches Market (2026-2032) | Strategy, Consumer Insights, Analysis, Investment Trends, Opportunities, Growth, Size, Share, Industry, Revenue, Segments, Value, Segmentation, Supply, Forecast, Restraints, Outlook, Competition, Drivers, Trends, Demand, Pricing Analysis, Competitive, Strategic Insights, Companies, Challenges
- Saudi Arabia Core Assurance Service Market (2025-2031) | Strategy, Consumer Insights, Analysis, Investment Trends, Opportunities, Growth, Size, Share, Industry, Revenue, Segments, Value, Segmentation, Supply, Forecast, Restraints, Outlook, Competition, Drivers, Trends, Demand, Pricing Analysis, Competitive, Strategic Insights, Companies, Challenges
- Romania Uninterruptible Power Supply (UPS) Market (2026-2032) | Industry, Analysis, Revenue, Size, Forecast, Outlook, Value, Trends, Share, Growth & Companies
Industry Events and Analyst Meet

India EV Show 2026

EV tech India Expo 2026

Auto Tech Asia 2026

Battery Tech India 2026

Smart Production Solutions Guangzhou 2026
Whitepaper
- Middle East & Africa Commercial Security Market Click here to view more.
- Middle East & Africa Fire Safety Systems & Equipment Market Click here to view more.
- GCC Drone Market Click here to view more.
- Middle East Lighting Fixture Market Click here to view more.
- GCC Physical & Perimeter Security Market Click here to view more.
6WResearch In News
- Doha a strategic location for EV manufacturing hub: IPA Qatar
- Demand for luxury TVs surging in the GCC, says Samsung
- Empowering Growth: The Thriving Journey of Bangladesh’s Cable Industry
- Demand for luxury TVs surging in the GCC, says Samsung
- Video call with a traditional healer? Once unthinkable, it’s now common in South Africa
- Intelligent Buildings To Smooth GCC’s Path To Net Zero