Latvia Cyclohexane Market (2026-2032) | Segmentation, Analysis, Share, Size, Growth, Revenue, Value, Industry, Trends, Companies, Forecast & Outlook
Market Forecast By Application (Adipic acid, Caprolactam, Others), By End-use (Nylon 6, Nylon 66, Others) And Competitive Landscape
| Product Code: ETC4758794 | Publication Date: Nov 2023 | Updated Date: Apr 2026 | Product Type: Market Research Report | |
| Publisher: 6Wresearch | Author: Shubham Padhi | No. of Pages: 60 | No. of Figures: 30 | No. of Tables: 5 |
Latvia Cyclohexane Market Size (2020-2030)
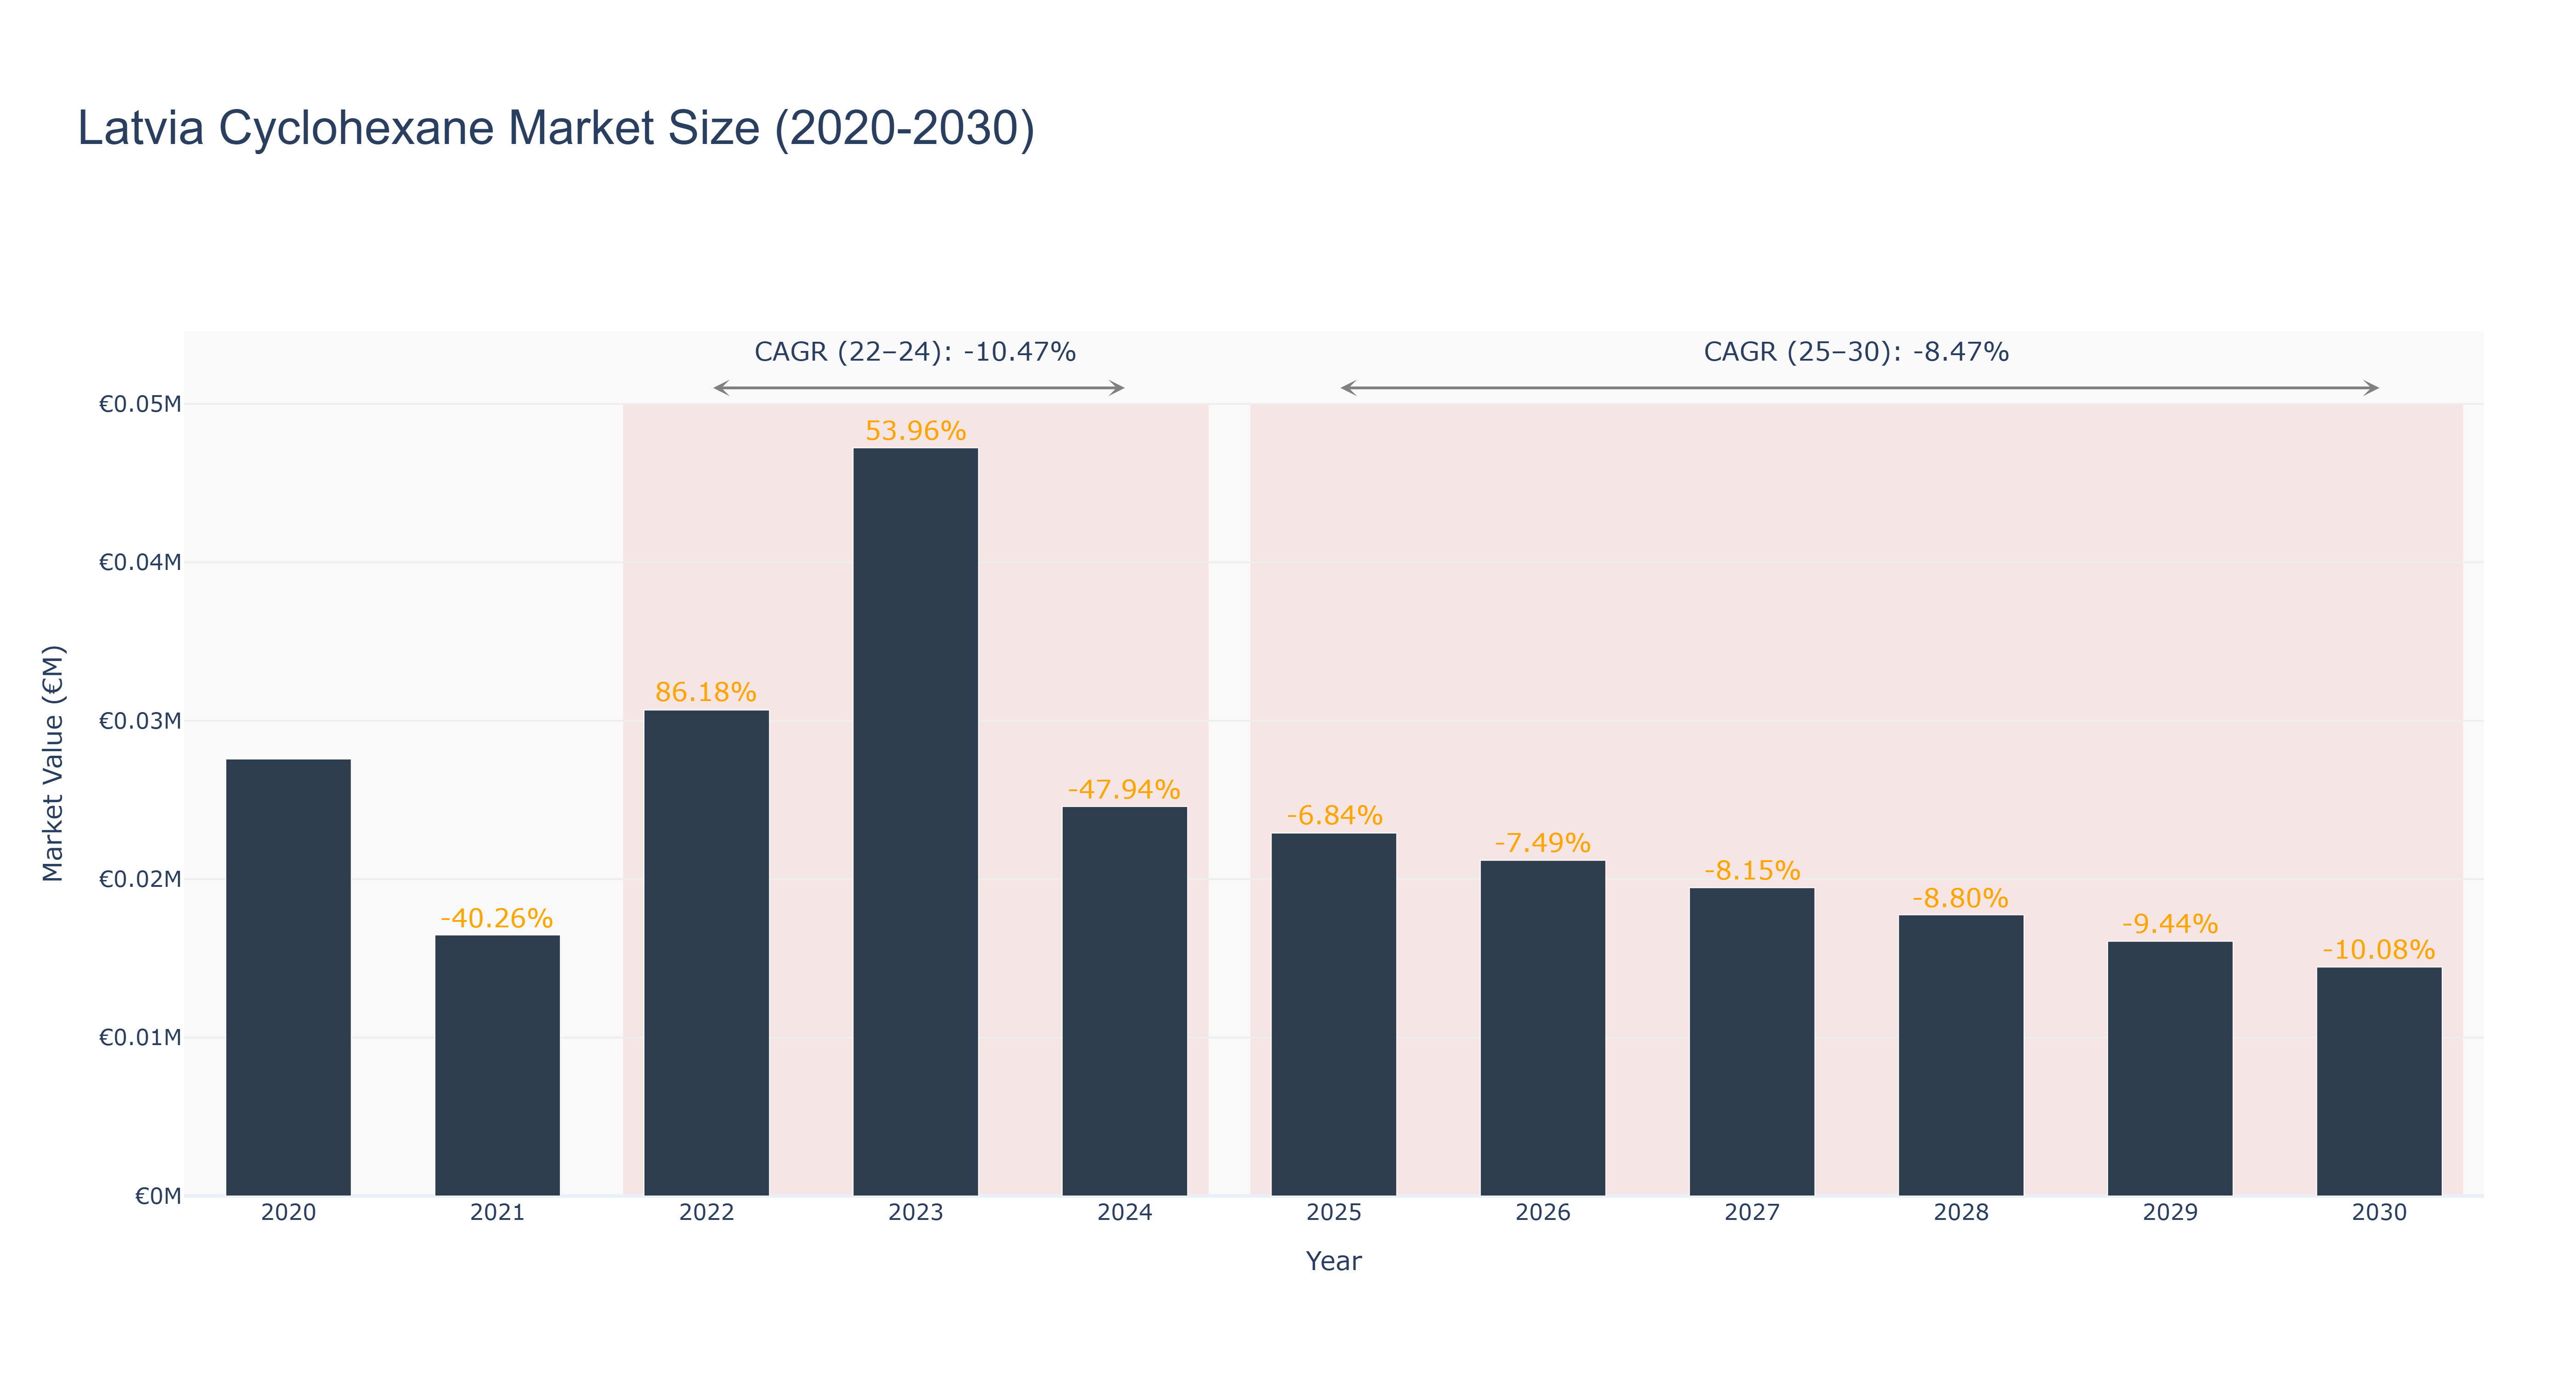
Latvia Cyclohexane Market has experienced fluctuations in market size over the years. The peak market size of €0.05 million was observed in 2023, followed by a decline to €0.02 million in 2024. The market is forecasted to continue shrinking, with a projected size of €0.01 million in 2030. The CAGR for the period 2022-24 was -10.47%, while for 2025-30 it is estimated at -8.47%. The market saw growth in 2022 due to increased demand from various industries, but subsequent declines can be attributed to economic uncertainties and changing consumer preferences. Looking ahead, Latvia is set to invest in renewable energy projects to reduce dependency on traditional sources, which could impact the cyclohexane market positively in the long run.
Latvia Cyclohexane Market: Production & Trade Performance (2019-2025)
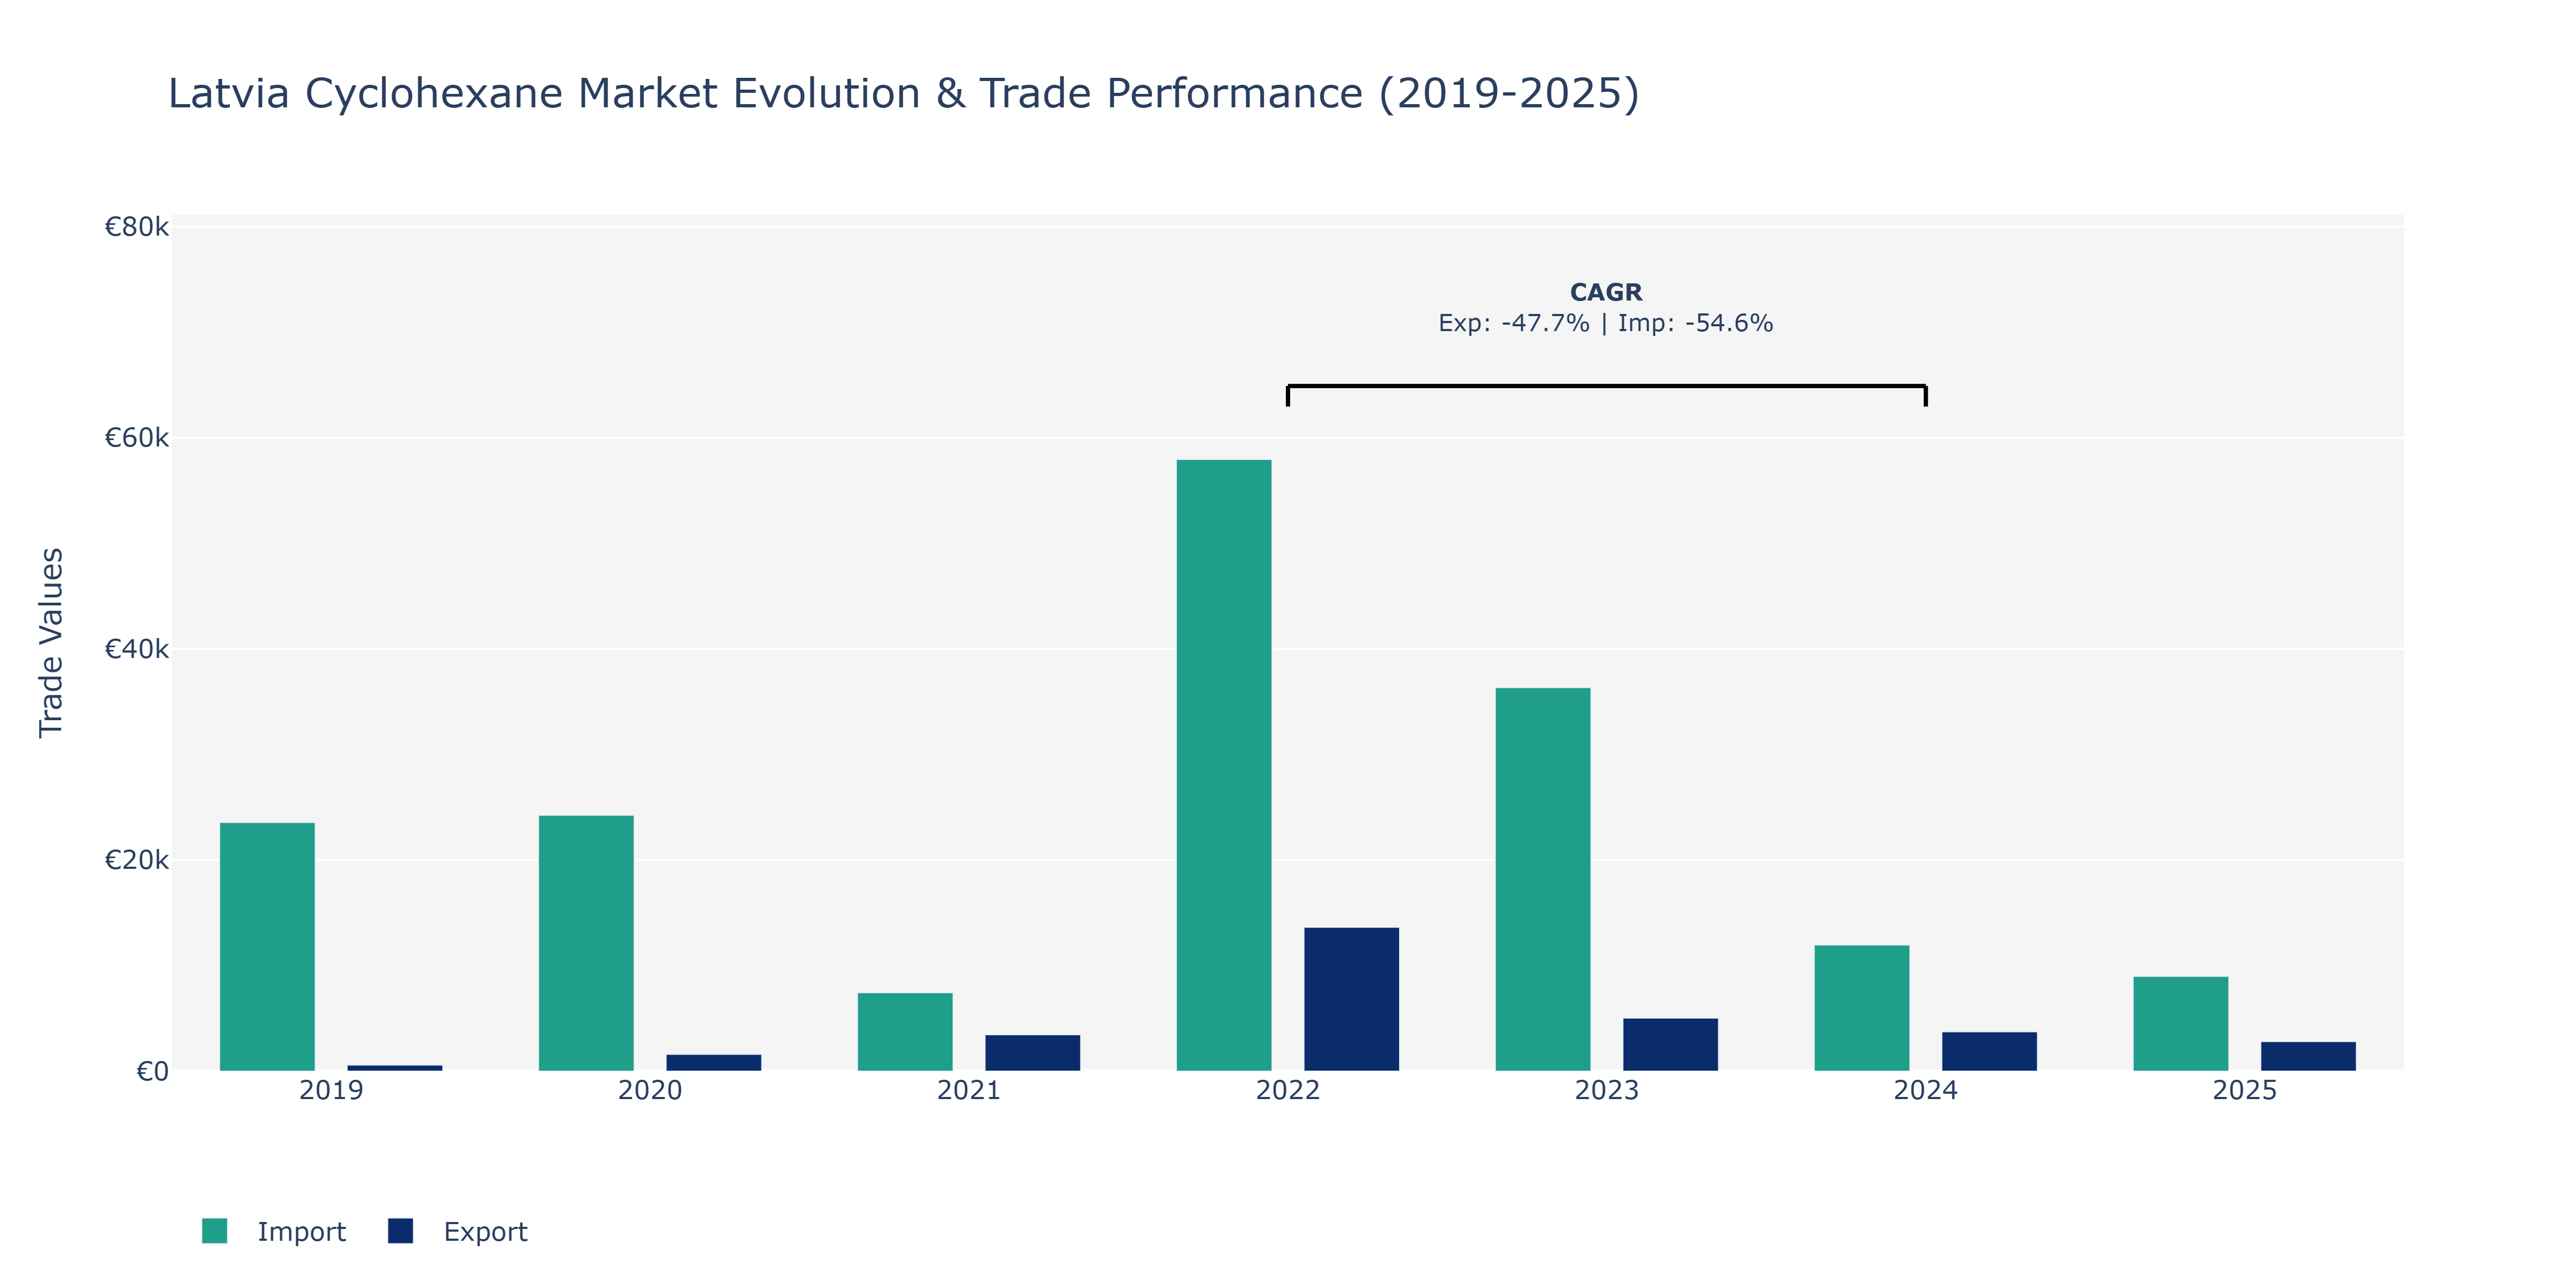
The Latvia Cyclohexane Market experienced notable fluctuations in both exports and imports from 2019 to 2025. In 2019, exports stood at €590 million while imports were significantly higher at €23.55 billion. The following year, exports surged to €1.59 billion, but imports remained relatively stable at €24.24 billion. The year 2021 saw a substantial increase in exports to €3.46 billion, while imports decreased to €7.43 billion. However, in 2022, there was a remarkable spike in exports to €13.63 billion, accompanied by a substantial increase in imports to €57.94 billion. The market then witnessed a decline in both exports and imports in 2023 and 2024. Exports decreased to €5.03 billion in 2023 and further dropped to €3.73 billion in 2024, while imports decreased to €36.33 billion in 2023 and €11.95 billion in 2024. By 2025, exports were at €2.81 billion, and imports were at €8.98 billion. These fluctuations can be attributed to various factors such as changes in global demand for cyclohexane, shifts in production capacities within the region, as well as macroeconomic conditions impacting trade flows. The decrease in CAGR for both exports and imports from 2022 to 2024 reflects a period of adjustment in the market, possibly influenced by regulatory changes or shifts in supply chains within the industry, reinforcing the need for market players to adapt to evolving dynamics and optimize their strategies to navigate such fluctuations effectively.
Key Highlights of the Report:
- Latvia Cyclohexane Market Outlook
- Market Size of Latvia Cyclohexane Market, 2025
- Forecast of Latvia Cyclohexane Market, 2032
- Historical Data and Forecast of Latvia Cyclohexane Revenues & Volume for the Period 2022 - 2032F
- Latvia Cyclohexane Market Trend Evolution
- Latvia Cyclohexane Market Drivers and Challenges
- Latvia Cyclohexane Price Trends
- Latvia Cyclohexane Porter`s Five Forces
- Latvia Cyclohexane Industry Life Cycle
- Historical Data and Forecast of Latvia Cyclohexane Market Revenues & Volume By Application for the Period 2022 - 2032F
- Historical Data and Forecast of Latvia Cyclohexane Market Revenues & Volume By Adipic acid for the Period 2022 - 2032F
- Historical Data and Forecast of Latvia Cyclohexane Market Revenues & Volume By Caprolactam for the Period 2022 - 2032F
- Historical Data and Forecast of Latvia Cyclohexane Market Revenues & Volume By Others for the Period 2022 - 2032F
- Historical Data and Forecast of Latvia Cyclohexane Market Revenues & Volume By End-use for the Period 2022 - 2032F
- Historical Data and Forecast of Latvia Cyclohexane Market Revenues & Volume By Nylon 6 for the Period 2022 - 2032F
- Historical Data and Forecast of Latvia Cyclohexane Market Revenues & Volume By Nylon 66 for the Period 2022 - 2032F
- Historical Data and Forecast of Latvia Cyclohexane Market Revenues & Volume By Others for the Period 2022 - 2032F
- Latvia Cyclohexane Import Export Trade Statistics
- Market Opportunity Assessment By Application
- Market Opportunity Assessment By End-use
- Latvia Cyclohexane Top Companies Market Share
- Latvia Cyclohexane Competitive Benchmarking By Technical and Operational Parameters
- Latvia Cyclohexane Company Profiles
- Latvia Cyclohexane Key Strategic Recommendations
Frequently Asked Questions About the Market Study (FAQs):
6Wresearch actively monitors the Latvia Cyclohexane Market and publishes its comprehensive annual report, highlighting emerging trends, growth drivers, revenue analysis, and forecast outlook. Our insights help businesses to make data-backed strategic decisions with ongoing market dynamics. Our analysts track relevent industries related to the Latvia Cyclohexane Market, allowing our clients with actionable intelligence and reliable forecasts tailored to emerging regional needs.
Yes, we provide customisation as per your requirements. To learn more, feel free to contact us on sales@6wresearch.com
1 Executive Summary |
2 Introduction |
2.1 Key Highlights of the Report |
2.2 Report Description |
2.3 Market Scope & Segmentation |
2.4 Research Methodology |
2.5 Assumptions |
3 Latvia Cyclohexane Market Overview |
3.1 Latvia Country Macro Economic Indicators |
3.2 Latvia Cyclohexane Market Revenues & Volume, 2022 & 2032F |
3.3 Latvia Cyclohexane Market - Industry Life Cycle |
3.4 Latvia Cyclohexane Market - Porter's Five Forces |
3.5 Latvia Cyclohexane Market Revenues & Volume Share, By Application, 2022 & 2032F |
3.6 Latvia Cyclohexane Market Revenues & Volume Share, By End-use, 2022 & 2032F |
4 Latvia Cyclohexane Market Dynamics |
4.1 Impact Analysis |
4.2 Market Drivers |
4.2.1 Increasing demand for cyclohexane in key end-use industries such as chemicals, plastics, and textiles. |
4.2.2 Growing focus on sustainable practices and the shift towards bio-based cyclohexane production. |
4.2.3 Favorable government regulations and policies supporting the growth of the cyclohexane market in Latvia. |
4.3 Market Restraints |
4.3.1 Volatility in raw material prices impacting the overall production cost of cyclohexane. |
4.3.2 Intense competition from alternative chemicals and substitutes affecting market penetration. |
4.3.3 Economic uncertainties and fluctuations in global market conditions leading to demand fluctuations. |
5 Latvia Cyclohexane Market Trends |
6 Latvia Cyclohexane Market Segmentations |
6.1 Latvia Cyclohexane Market, By Application |
6.1.1 Overview and Analysis |
6.1.2 Latvia Cyclohexane Market Revenues & Volume, By Adipic acid, 2022 - 2032F |
6.1.3 Latvia Cyclohexane Market Revenues & Volume, By Caprolactam, 2022 - 2032F |
6.1.4 Latvia Cyclohexane Market Revenues & Volume, By Others, 2022 - 2032F |
6.2 Latvia Cyclohexane Market, By End-use |
6.2.1 Overview and Analysis |
6.2.2 Latvia Cyclohexane Market Revenues & Volume, By Nylon 6, 2022 - 2032F |
6.2.3 Latvia Cyclohexane Market Revenues & Volume, By Nylon 66, 2022 - 2032F |
6.2.4 Latvia Cyclohexane Market Revenues & Volume, By Others, 2022 - 2032F |
7 Latvia Cyclohexane Market Import-Export Trade Statistics |
7.1 Latvia Cyclohexane Market Export to Major Countries |
7.2 Latvia Cyclohexane Market Imports from Major Countries |
8 Latvia Cyclohexane Market Key Performance Indicators |
8.1 Average selling price of cyclohexane in the Latvia market. |
8.2 Production capacity utilization rate of cyclohexane manufacturers in Latvia. |
8.3 Percentage of bio-based or sustainable cyclohexane production in the market. |
8.4 Research and development investments in innovative cyclohexane production technologies. |
8.5 Adoption rate of eco-friendly practices and certifications in the cyclohexane industry in Latvia. |
9 Latvia Cyclohexane Market - Opportunity Assessment |
9.1 Latvia Cyclohexane Market Opportunity Assessment, By Application, 2022 & 2032F |
9.2 Latvia Cyclohexane Market Opportunity Assessment, By End-use, 2022 & 2032F |
10 Latvia Cyclohexane Market - Competitive Landscape |
10.1 Latvia Cyclohexane Market Revenue Share, By Companies, 2025 |
10.2 Latvia Cyclohexane Market Competitive Benchmarking, By Operating and Technical Parameters |
11 Company Profiles |
12 Recommendations | 13 Disclaimer |
Global Go To Market Strategy - 2030
Export potential enables firms to identify high-growth global markets with greater confidence by combining advanced trade intelligence with a structured quantitative methodology. The framework analyzes emerging demand trends and country-level import patterns while integrating macroeconomic and trade datasets such as GDP and population forecasts, bilateral import–export flows, tariff structures, elasticity differentials between developed and developing economies, geographic distance, and import demand projections. Using weighted trade values from 2020–2024 as the base period to project country-to-country export potential for 2030, these inputs are operationalized through calculated drivers such as gravity model parameters, tariff impact factors, and projected GDP per-capita growth. Through an analysis of hidden potentials, demand hotspots, and market conditions that are most favorable to success, this method enables firms to focus on target countries, maximize returns, and global expansion with data, backed by accuracy.
By factoring in the projected importer demand gap that is currently unmet and could be potential opportunity, it identifies the potential for the Exporter (Country) among 190 countries, against the general trade analysis, which identifies the biggest importer or exporter.
To discover high-growth global markets and optimize your business strategy:
Click Here
Pricing
- Single User License$ 1,995
- Department License$ 2,400
- Site License$ 3,120
- Global License$ 3,795

Leadership Perspectives from Industry Events
Search
Thought Leadership and Analyst Meet


Our Clients
6WResearch In News
- Doha a strategic location for EV manufacturing hub: IPA Qatar
- Demand for luxury TVs surging in the GCC, says Samsung
- Empowering Growth: The Thriving Journey of Bangladesh’s Cable Industry
- Demand for luxury TVs surging in the GCC, says Samsung
- Video call with a traditional healer? Once unthinkable, it’s now common in South Africa
- Intelligent Buildings To Smooth GCC’s Path To Net Zero
Latest Reports
- Taiwan Airport Wireless Infrastructure Market (2026-2032)
- Vietnam Airport Wireless Infrastructure Market (2026-2032)
- Thailand Airport Wireless Infrastructure Market (2026-2032)
- South Korea Airport Wireless Infrastructure Market (2026-2032)
- Romania Airport Wireless Infrastructure Market (2026-2032)
- Qatar Airport Wireless Infrastructure Market (2026-2032)
- Philippines Airport Wireless Infrastructure Market (2026-2032)
- Japan Airport Wireless Infrastructure Market (2026-2032)
- Taiwan Airport Winter Services Market (2026-2032)
- Vietnam Airport Winter Services Market (2026-2032)
Industry Events and Analyst Meet

HIMTEX 2026

India Refining Summit 2026

India EV Show 2026

EV tech India Expo 2026

Auto Tech Asia 2026
Whitepaper
- Middle East & Africa Commercial Security Market Click here to view more.
- Middle East & Africa Fire Safety Systems & Equipment Market Click here to view more.
- GCC Drone Market Click here to view more.
- Middle East Lighting Fixture Market Click here to view more.
- GCC Physical & Perimeter Security Market Click here to view more.