Latvia Direct Reduced Iron (DRI) Market (2026-2032) | Growth, Size & Revenue, Segmentation, Forecast, Competitive Landscape, Value, Share, Outlook, Analysis, Industry, Companies, Trends
Market Forecast By Form (Pellets, Lumps), By Production Process (Gas-based, Coal-based), By Grade (Grade A (FeM 81% Min), Grade B (FeM 78 To 80 %), Grade C (FeM < 78%)) And Competitive Landscape
| Product Code: ETC7909481 | Publication Date: Sep 2024 | Updated Date: Apr 2026 | Product Type: Market Research Report | |
| Publisher: 6Wresearch | Author: Sumit Sagar | No. of Pages: 75 | No. of Figures: 35 | No. of Tables: 20 |
Latvia Direct Reduced Iron (Dri) Market Size (2020-2030)
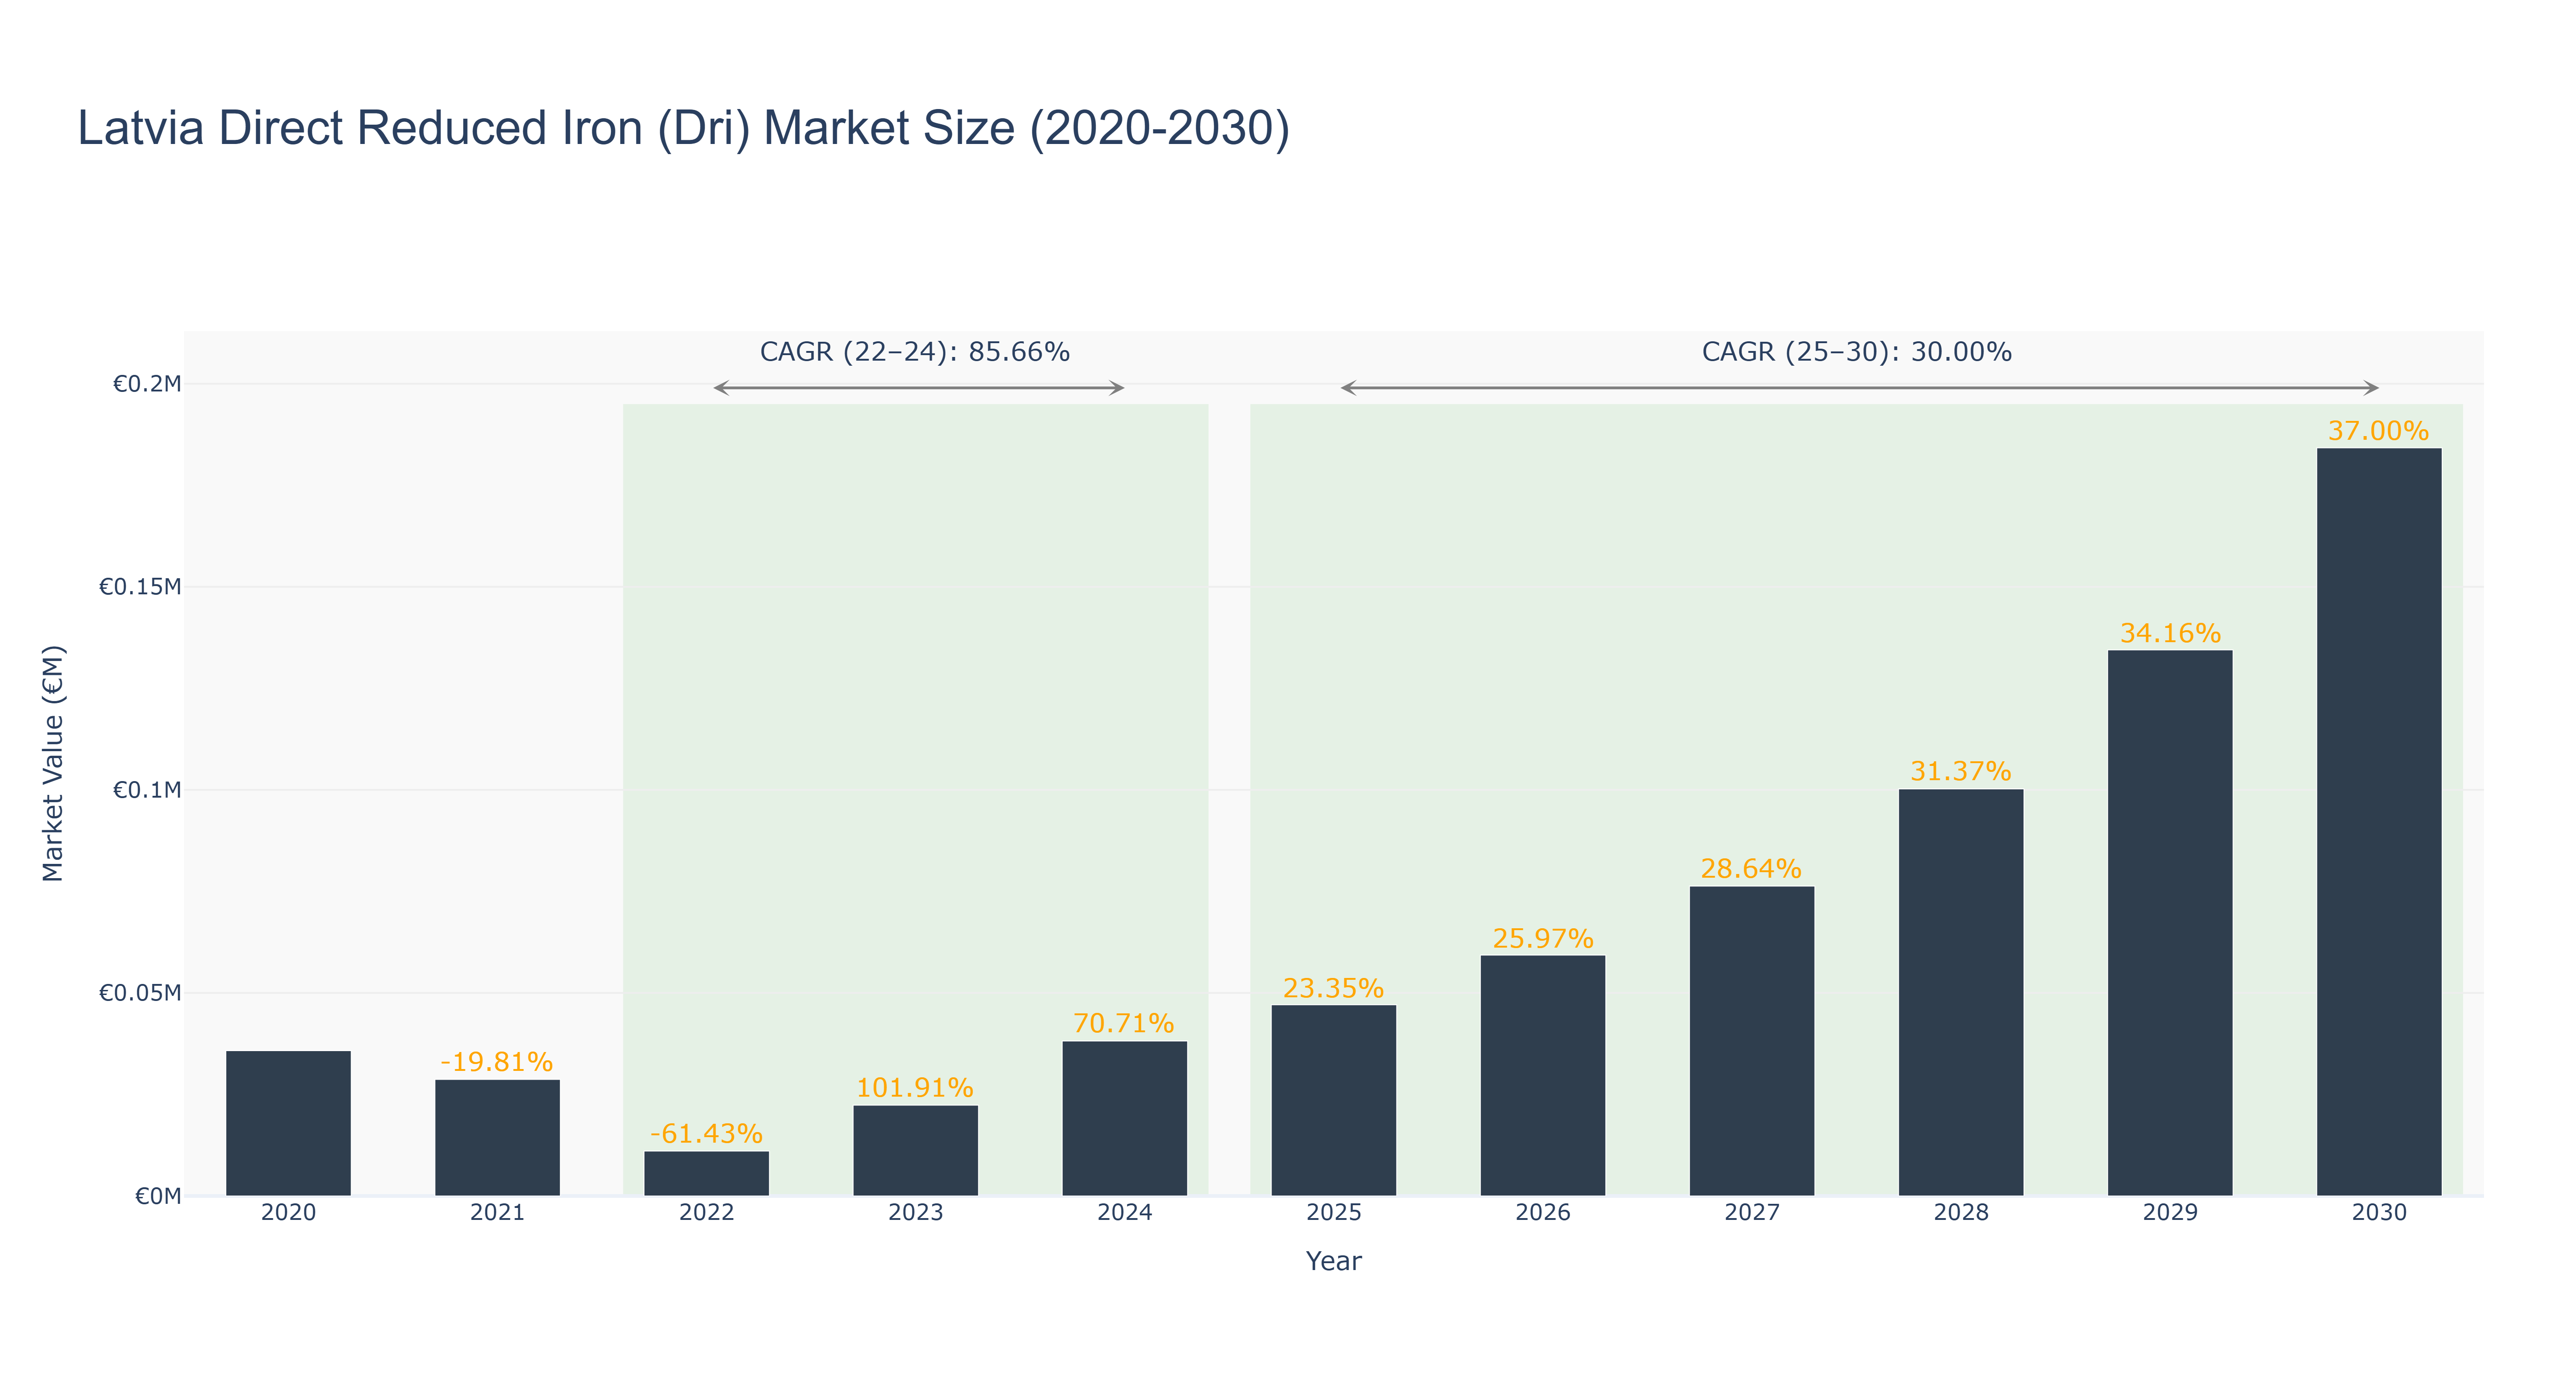
Latvia Direct Reduced Iron (Dri) Market has shown a fluctuating trend in recent years. The peak market size of €0.18 million was reached in 2030, with a steady growth trajectory from 2020 to 2024, where the market size increased from €0.04 million to €0.04 million. However, a significant decline was observed in 2022, dropping to €0.01 million, followed by a remarkable recovery and growth in the subsequent years. The CAGR for the period 2022-24 stood at 85.66%, while for 2025-30, it is projected at 30.0%. The downfall in 2022 can be attributed to external factors affecting the iron industry globally, leading to a temporary setback. The subsequent recovery and growth can be linked to increased demand for direct reduced iron as a cost-effective and environmentally friendly alternative to traditional iron production methods. Looking ahead, Latvia is set to embark on new infrastructure projects aimed at further boosting the direct reduced iron market, aligning with the country's sustainable development goals and economic growth plans.
Latvia Direct Reduced Iron (Dri) Market: Production & Trade Performance (2019-2025)
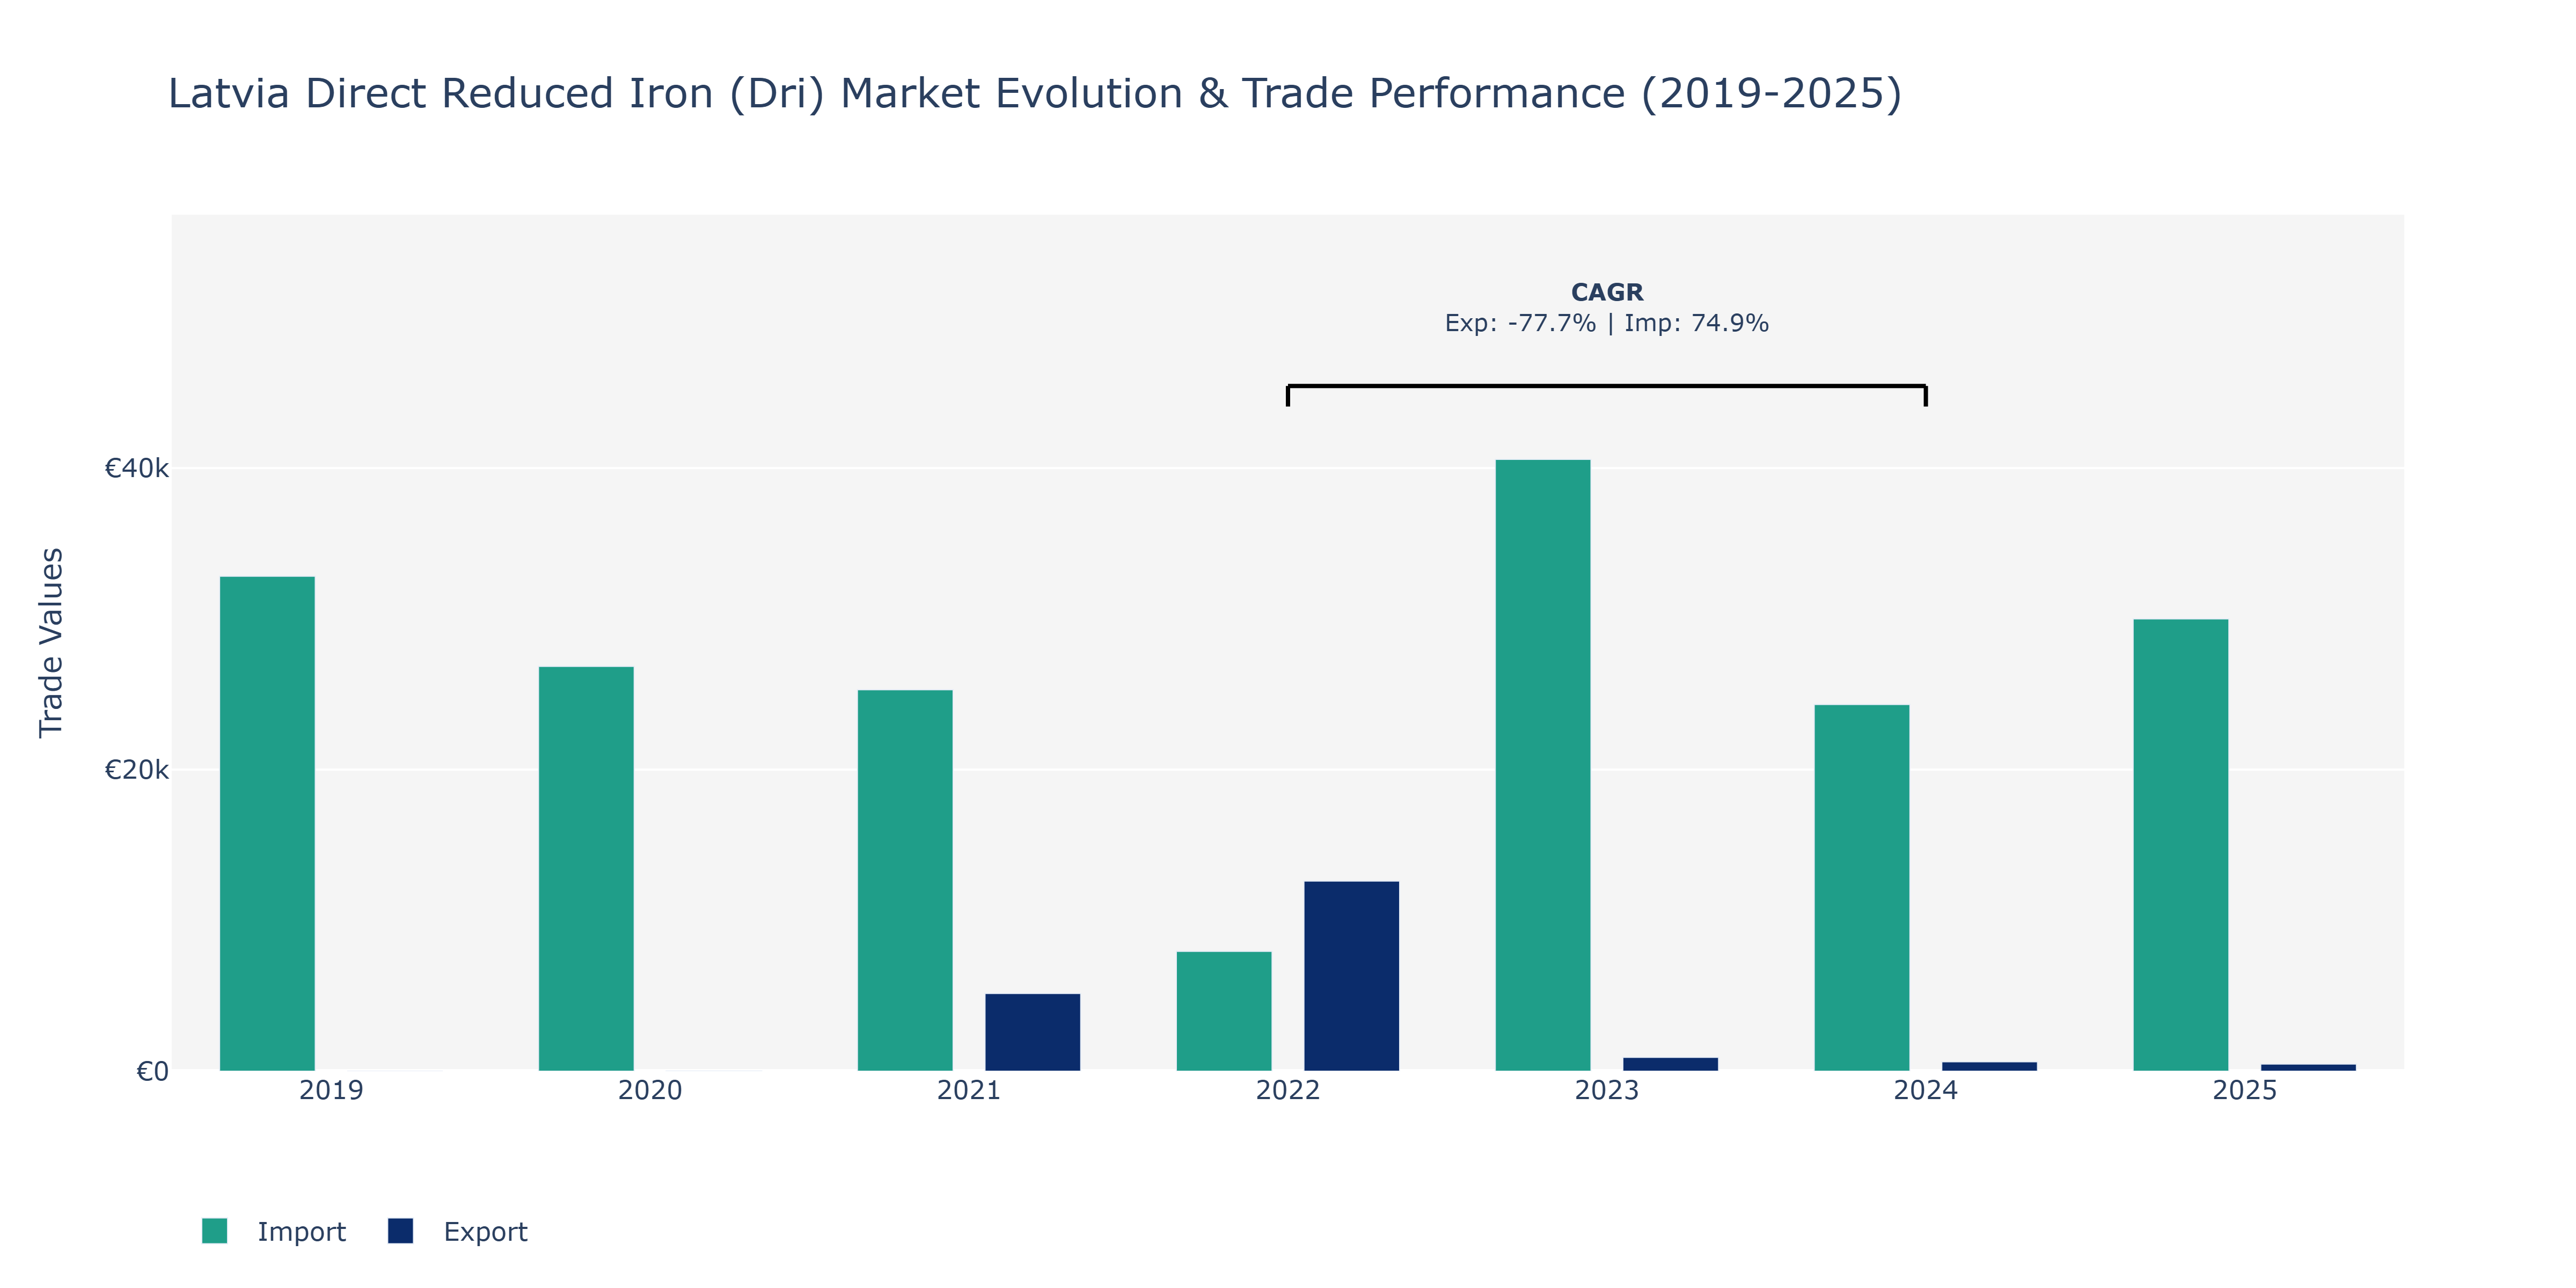
Between 2019 and 2025, Latvia's Direct Reduced Iron (DRI) market witnessed notable fluctuations in both exports and imports. In 2019, imports stood at €32.83 thousand, dropping sharply in 2020 to €26.85 thousand, possibly due to global economic uncertainties. However, exports showed a contrasting trend, starting at €11 thousand in 2020 and reaching €126.06 thousand in 2022, reflecting a significant increase in outbound trade. Conversely, imports surged to €40.58 thousand in 2023, potentially driven by increased domestic demand for raw materials. The market experienced a dip in exports and imports in 2024, with figures reaching €0.63 thousand and €24.32 thousand, respectively. This decline in exports could be attributed to global market conditions affecting demand, whereas the rise in imports in 2024 might be linked to infrastructure development projects. By 2025, exports and imports stabilized at €0.47 thousand and €29.99 thousand, respectively, indicating a potential equilibrium in the market. The observed fluctuations in trade volumes could be influenced by factors like changes in global iron ore prices, shifts in consumer demand for steel, and variations in production capacities of DRI manufacturers in Latvia.
Key Highlights of the Report:
- Latvia Direct Reduced Iron (DRI) Market Outlook
- Market Size of Latvia Direct Reduced Iron (DRI) Market, 2025
- Forecast of Latvia Direct Reduced Iron (DRI) Market, 2032
- Historical Data and Forecast of Latvia Direct Reduced Iron (DRI) Revenues & Volume for the Period 2022 - 2032
- Latvia Direct Reduced Iron (DRI) Market Trend Evolution
- Latvia Direct Reduced Iron (DRI) Market Drivers and Challenges
- Latvia Direct Reduced Iron (DRI) Price Trends
- Latvia Direct Reduced Iron (DRI) Porter's Five Forces
- Latvia Direct Reduced Iron (DRI) Industry Life Cycle
- Historical Data and Forecast of Latvia Direct Reduced Iron (DRI) Market Revenues & Volume By Form for the Period 2022 - 2032
- Historical Data and Forecast of Latvia Direct Reduced Iron (DRI) Market Revenues & Volume By Pellets for the Period 2022 - 2032
- Historical Data and Forecast of Latvia Direct Reduced Iron (DRI) Market Revenues & Volume By Lumps for the Period 2022 - 2032
- Historical Data and Forecast of Latvia Direct Reduced Iron (DRI) Market Revenues & Volume By Production Process for the Period 2022 - 2032
- Historical Data and Forecast of Latvia Direct Reduced Iron (DRI) Market Revenues & Volume By Gas-based for the Period 2022 - 2032
- Historical Data and Forecast of Latvia Direct Reduced Iron (DRI) Market Revenues & Volume By Coal-based for the Period 2022 - 2032
- Historical Data and Forecast of Latvia Direct Reduced Iron (DRI) Market Revenues & Volume By Grade for the Period 2022 - 2032
- Historical Data and Forecast of Latvia Direct Reduced Iron (DRI) Market Revenues & Volume By Grade A (FeM 81% Min) for the Period 2022 - 2032
- Historical Data and Forecast of Latvia Direct Reduced Iron (DRI) Market Revenues & Volume By Grade B (FeM 78 To 80 %) for the Period 2022 - 2032
- Historical Data and Forecast of Latvia Direct Reduced Iron (DRI) Market Revenues & Volume By Grade C (FeM < 78%) for the Period 2022 - 2032
- Latvia Direct Reduced Iron (DRI) Import Export Trade Statistics
- Market Opportunity Assessment By Form
- Market Opportunity Assessment By Production Process
- Market Opportunity Assessment By Grade
- Latvia Direct Reduced Iron (DRI) Top Companies Market Share
- Latvia Direct Reduced Iron (DRI) Competitive Benchmarking By Technical and Operational Parameters
- Latvia Direct Reduced Iron (DRI) Company Profiles
- Latvia Direct Reduced Iron (DRI) Key Strategic Recommendations
Frequently Asked Questions About the Market Study (FAQs):
6Wresearch actively monitors the Latvia Direct Reduced Iron (DRI) Market and publishes its comprehensive annual report, highlighting emerging trends, growth drivers, revenue analysis, and forecast outlook. Our insights help businesses to make data-backed strategic decisions with ongoing market dynamics. Our analysts track relevent industries related to the Latvia Direct Reduced Iron (DRI) Market, allowing our clients with actionable intelligence and reliable forecasts tailored to emerging regional needs.
Yes, we provide customisation as per your requirements. To learn more, feel free to contact us on sales@6wresearch.com
1 Executive Summary |
2 Introduction |
2.1 Key Highlights of the Report |
2.2 Report Description |
2.3 Market Scope & Segmentation |
2.4 Research Methodology |
2.5 Assumptions |
3 Latvia Direct Reduced Iron (DRI) Market Overview |
3.1 Latvia Country Macro Economic Indicators |
3.2 Latvia Direct Reduced Iron (DRI) Market Revenues & Volume, 2022 & 2032F |
3.3 Latvia Direct Reduced Iron (DRI) Market - Industry Life Cycle |
3.4 Latvia Direct Reduced Iron (DRI) Market - Porter's Five Forces |
3.5 Latvia Direct Reduced Iron (DRI) Market Revenues & Volume Share, By Form, 2022 & 2032F |
3.6 Latvia Direct Reduced Iron (DRI) Market Revenues & Volume Share, By Production Process, 2022 & 2032F |
3.7 Latvia Direct Reduced Iron (DRI) Market Revenues & Volume Share, By Grade, 2022 & 2032F |
4 Latvia Direct Reduced Iron (DRI) Market Dynamics |
4.1 Impact Analysis |
4.2 Market Drivers |
4.2.1 Increasing demand for steel production globally, leading to a higher demand for direct reduced iron (DRI) as a raw material. |
4.2.2 Government initiatives promoting the use of DRI due to its environmental benefits compared to traditional ironmaking processes. |
4.2.3 Growth in construction and infrastructure projects driving the demand for steel and subsequently DRI. |
4.3 Market Restraints |
4.3.1 Fluctuating prices of raw materials such as natural gas and iron ore, which can impact the production cost of DRI. |
4.3.2 Competition from alternative ironmaking processes like blast furnace route, affecting the market penetration of DRI. |
4.3.3 Regulatory challenges or uncertainties related to environmental policies impacting the production and usage of DRI. |
5 Latvia Direct Reduced Iron (DRI) Market Trends |
6 Latvia Direct Reduced Iron (DRI) Market, By Types |
6.1 Latvia Direct Reduced Iron (DRI) Market, By Form |
6.1.1 Overview and Analysis |
6.1.2 Latvia Direct Reduced Iron (DRI) Market Revenues & Volume, By Form, 2022 - 2032F |
6.1.3 Latvia Direct Reduced Iron (DRI) Market Revenues & Volume, By Pellets, 2022 - 2032F |
6.1.4 Latvia Direct Reduced Iron (DRI) Market Revenues & Volume, By Lumps, 2022 - 2032F |
6.2 Latvia Direct Reduced Iron (DRI) Market, By Production Process |
6.2.1 Overview and Analysis |
6.2.2 Latvia Direct Reduced Iron (DRI) Market Revenues & Volume, By Gas-based, 2022 - 2032F |
6.2.3 Latvia Direct Reduced Iron (DRI) Market Revenues & Volume, By Coal-based, 2022 - 2032F |
6.3 Latvia Direct Reduced Iron (DRI) Market, By Grade |
6.3.1 Overview and Analysis |
6.3.2 Latvia Direct Reduced Iron (DRI) Market Revenues & Volume, By Grade A (FeM 81% Min), 2022 - 2032F |
6.3.3 Latvia Direct Reduced Iron (DRI) Market Revenues & Volume, By Grade B (FeM 78 To 80 %), 2022 - 2032F |
6.3.4 Latvia Direct Reduced Iron (DRI) Market Revenues & Volume, By Grade C (FeM < 78%), 2022 - 2032F |
7 Latvia Direct Reduced Iron (DRI) Market Import-Export Trade Statistics |
7.1 Latvia Direct Reduced Iron (DRI) Market Export to Major Countries |
7.2 Latvia Direct Reduced Iron (DRI) Market Imports from Major Countries |
8 Latvia Direct Reduced Iron (DRI) Market Key Performance Indicators |
8.1 Energy efficiency metrics in DRI production processes. |
8.2 Adoption rate of DRI technology in steel manufacturing plants. |
8.3 Carbon emissions reduction targets achieved through the use of DRI. |
8.4 Investment trends in DRI production capacity expansion or technology upgrades. |
8.5 Percentage of steel produced using DRI compared to traditional methods. |
9 Latvia Direct Reduced Iron (DRI) Market - Opportunity Assessment |
9.1 Latvia Direct Reduced Iron (DRI) Market Opportunity Assessment, By Form, 2022 & 2032F |
9.2 Latvia Direct Reduced Iron (DRI) Market Opportunity Assessment, By Production Process, 2022 & 2032F |
9.3 Latvia Direct Reduced Iron (DRI) Market Opportunity Assessment, By Grade, 2022 & 2032F |
10 Latvia Direct Reduced Iron (DRI) Market - Competitive Landscape |
10.1 Latvia Direct Reduced Iron (DRI) Market Revenue Share, By Companies, 2025 |
10.2 Latvia Direct Reduced Iron (DRI) Market Competitive Benchmarking, By Operating and Technical Parameters |
11 Company Profiles |
12 Recommendations |
13 Disclaimer |
Global Go To Market Strategy - 2030
Export potential enables firms to identify high-growth global markets with greater confidence by combining advanced trade intelligence with a structured quantitative methodology. The framework analyzes emerging demand trends and country-level import patterns while integrating macroeconomic and trade datasets such as GDP and population forecasts, bilateral import–export flows, tariff structures, elasticity differentials between developed and developing economies, geographic distance, and import demand projections. Using weighted trade values from 2020–2024 as the base period to project country-to-country export potential for 2030, these inputs are operationalized through calculated drivers such as gravity model parameters, tariff impact factors, and projected GDP per-capita growth. Through an analysis of hidden potentials, demand hotspots, and market conditions that are most favorable to success, this method enables firms to focus on target countries, maximize returns, and global expansion with data, backed by accuracy.
By factoring in the projected importer demand gap that is currently unmet and could be potential opportunity, it identifies the potential for the Exporter (Country) among 190 countries, against the general trade analysis, which identifies the biggest importer or exporter.
To discover high-growth global markets and optimize your business strategy:
Click Here
Pricing
- Single User License$ 1,995
- Department License$ 2,400
- Site License$ 3,120
- Global License$ 3,795

Leadership Perspectives from Industry Events
Search
Thought Leadership and Analyst Meet


Our Clients
6WResearch In News
- Doha a strategic location for EV manufacturing hub: IPA Qatar
- Demand for luxury TVs surging in the GCC, says Samsung
- Empowering Growth: The Thriving Journey of Bangladesh’s Cable Industry
- Demand for luxury TVs surging in the GCC, says Samsung
- Video call with a traditional healer? Once unthinkable, it’s now common in South Africa
- Intelligent Buildings To Smooth GCC’s Path To Net Zero
Latest Reports
- Taiwan Airport Wireless Infrastructure Market (2026-2032)
- Vietnam Airport Wireless Infrastructure Market (2026-2032)
- Thailand Airport Wireless Infrastructure Market (2026-2032)
- South Korea Airport Wireless Infrastructure Market (2026-2032)
- Romania Airport Wireless Infrastructure Market (2026-2032)
- Qatar Airport Wireless Infrastructure Market (2026-2032)
- Philippines Airport Wireless Infrastructure Market (2026-2032)
- Japan Airport Wireless Infrastructure Market (2026-2032)
- Taiwan Airport Winter Services Market (2026-2032)
- Vietnam Airport Winter Services Market (2026-2032)
Industry Events and Analyst Meet

HIMTEX 2026

India Refining Summit 2026

India EV Show 2026

EV tech India Expo 2026

Auto Tech Asia 2026
Whitepaper
- Middle East & Africa Commercial Security Market Click here to view more.
- Middle East & Africa Fire Safety Systems & Equipment Market Click here to view more.
- GCC Drone Market Click here to view more.
- Middle East Lighting Fixture Market Click here to view more.
- GCC Physical & Perimeter Security Market Click here to view more.