Latvia Potassium Nitrate Market (2026-2032) | Forecast, Industry, Trends, Companies, Share, Value, Growth, Analysis, Revenue, Outlook, Size & Segmentation
Market Forecast By Raw Material (Potassium Chloride, Ammonium Nitrate, Sodium Nitrate), By End Use Industry (Agricultural Industry, General Industries, Pharmaceuticals, Food Industry) And Competitive Landscape
| Product Code: ETC4691230 | Publication Date: Nov 2023 | Updated Date: Apr 2026 | Product Type: Market Research Report | |
| Publisher: 6Wresearch | Author: Shubham Padhi | No. of Pages: 60 | No. of Figures: 30 | No. of Tables: 5 |
Latvia Potassium Nitrate Market Size (2020-2030)
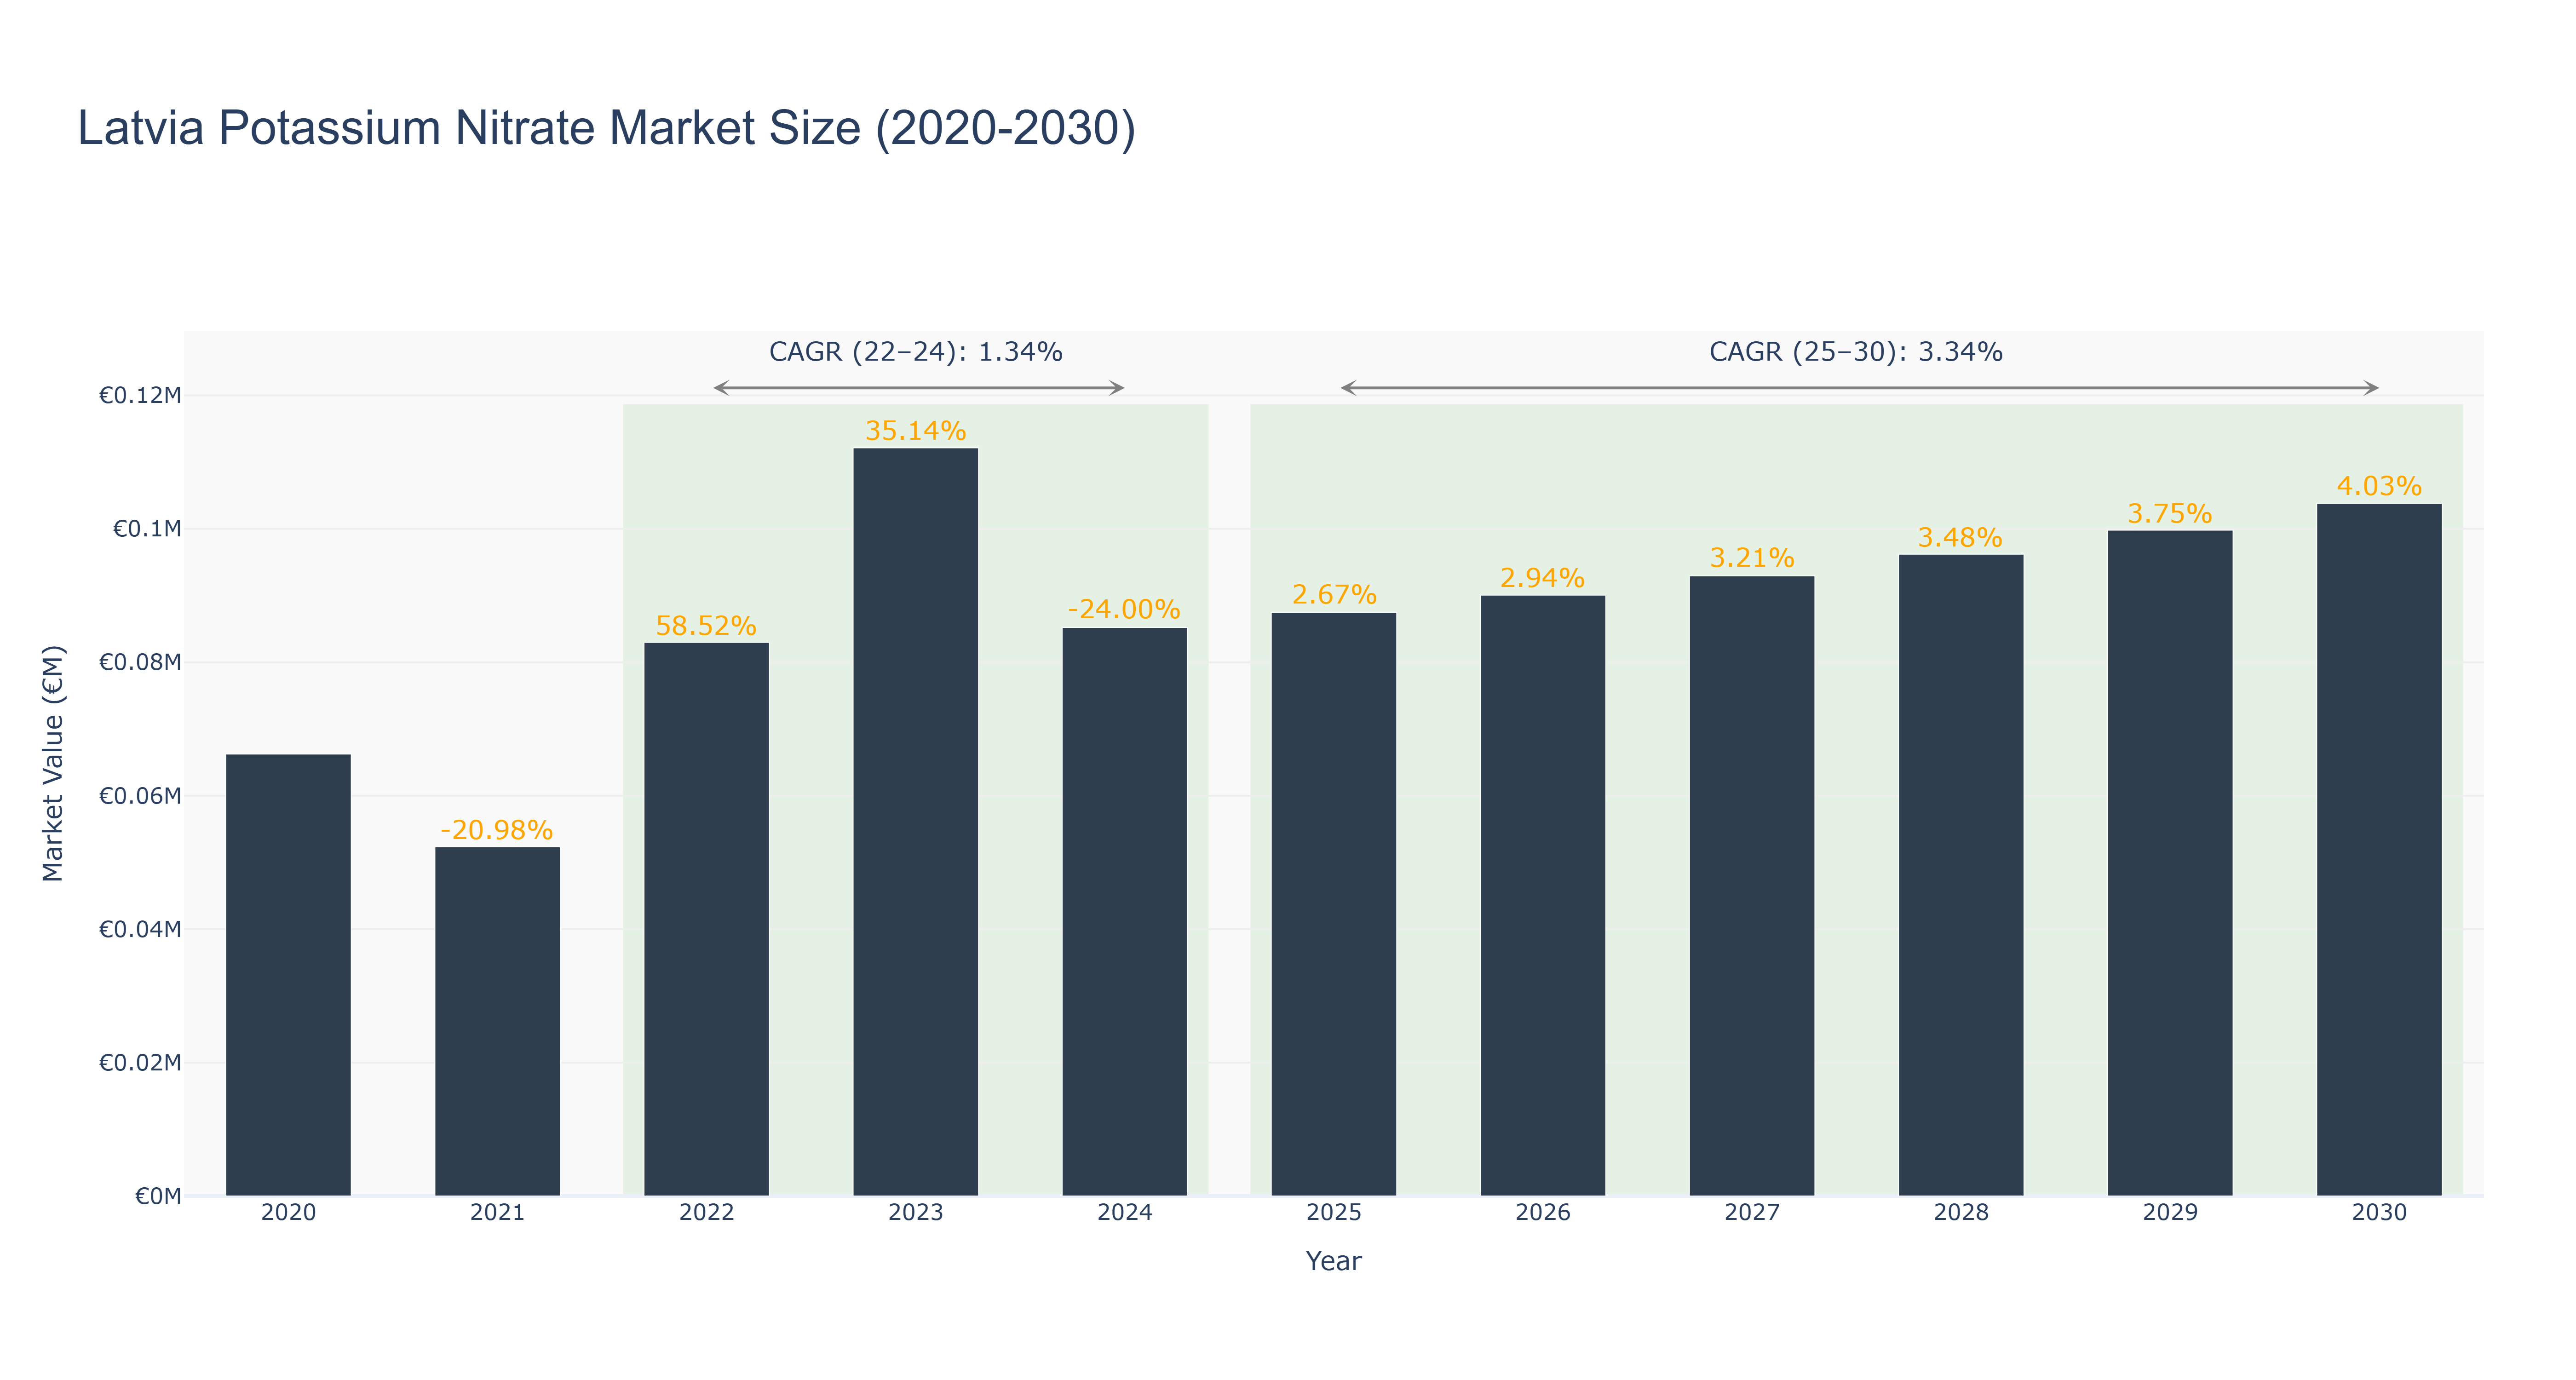
Latvia Potassium Nitrate Market has shown a fluctuating trend over the years. The peak market size was €0.11 million in 2023, followed by a slight decrease in 2024 to €0.09 million. The market is forecasted to grow steadily from 2025 to 2030, with an expected CAGR of 3.34%. The CAGR from 2022 to 2024 was 1.34%. The decline in 2024 could be attributed to market saturation and economic downturn, while the subsequent growth can be linked to increasing demand for agricultural products and technological advancements in the industry. Looking ahead, recent developments in sustainable agriculture practices and government initiatives to promote fertilizer usage are expected to drive further growth in the Latvia Potassium Nitrate Market.
Latvia Potassium Nitrate Market: Production & Trade Performance (2019-2025)
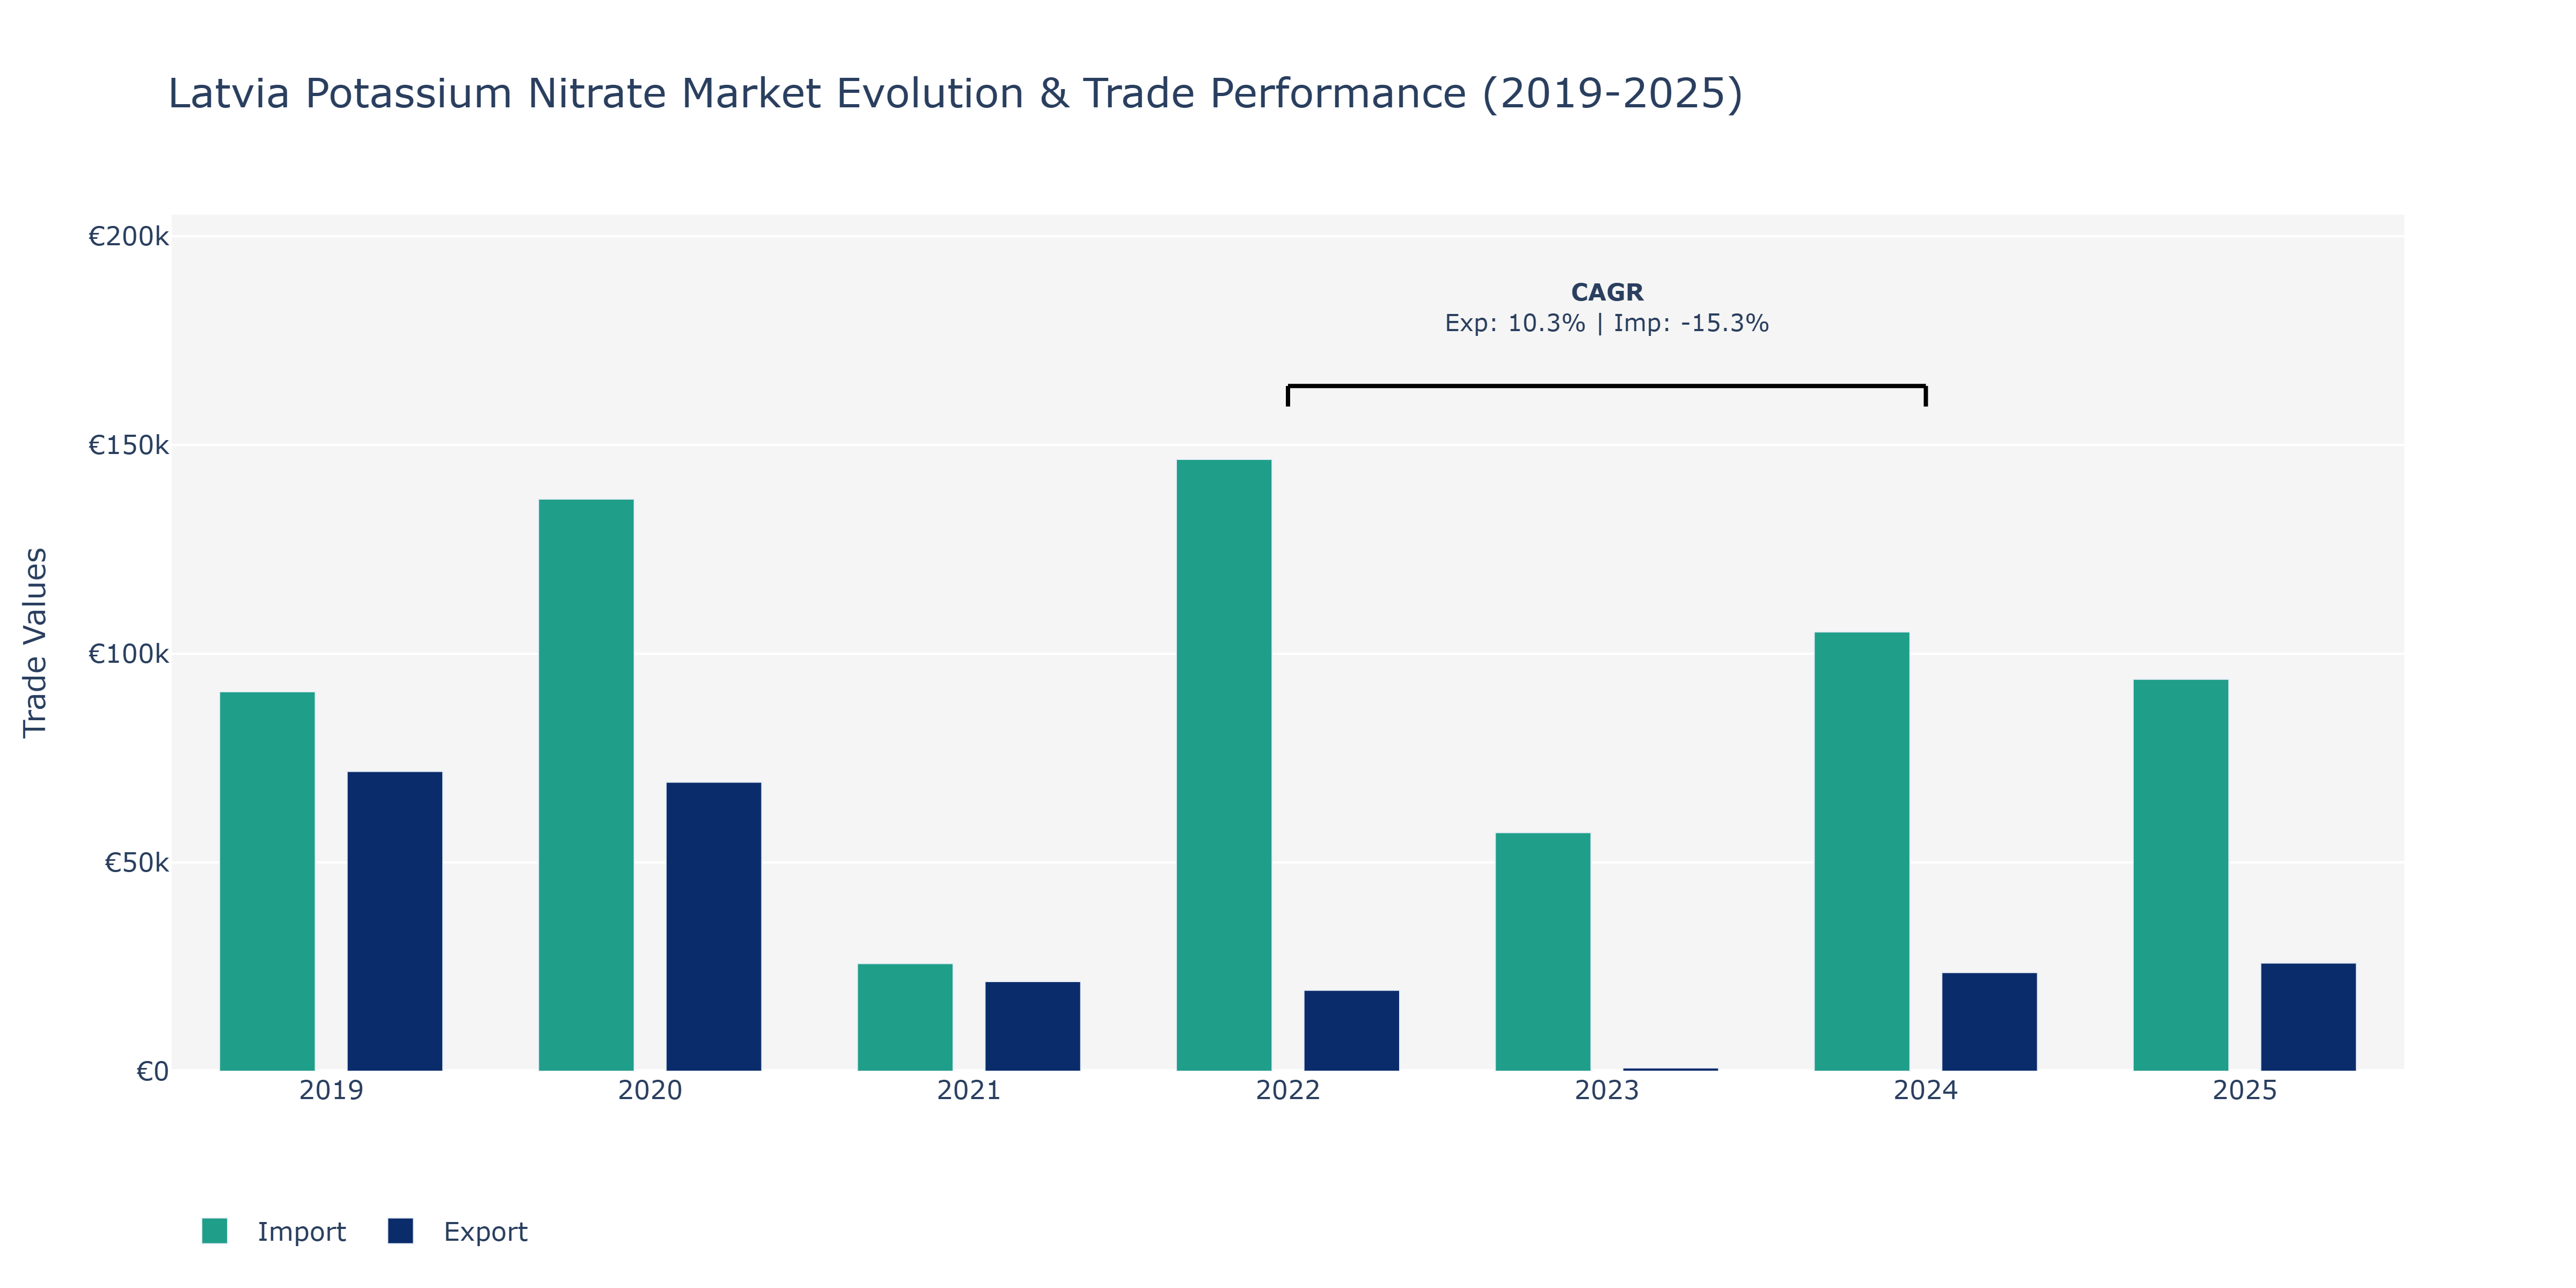
In the Latvia Potassium Nitrate Market, exports exhibited a fluctuating trend from 2019 to 2025. The peak point was observed in 2019 at €71.8 thousand, followed by a significant decline in 2021 to €21.46 thousand. This sharp decrease could be attributed to various factors such as changes in global demand, price fluctuations, or supply chain disruptions. However, a notable recovery was seen in 2024 when exports surged to €23.61 thousand. On the other hand, imports showcased a contrasting pattern, reaching their peak in 2020 at €137.04 thousand and then experiencing a steady decline through 2023. This downward trend might be linked to shifts in domestic production capabilities, changes in international trade agreements, or evolving market dynamics impacting import strategies. The recovery in exports in 2024 might indicate strategic initiatives or market interventions that positively influenced trade flows. Further research into export diversification strategies and import optimization efforts could provide additional insights into these fluctuating patterns in the market.
Key Highlights of the Report:
- Latvia Potassium Nitrate Market Outlook
- Market Size of Latvia Potassium Nitrate Market, 2025
- Forecast of Latvia Potassium Nitrate Market, 2032
- Historical Data and Forecast of Latvia Potassium Nitrate Revenues & Volume for the Period 2022 - 2032F
- Latvia Potassium Nitrate Market Trend Evolution
- Latvia Potassium Nitrate Market Drivers and Challenges
- Latvia Potassium Nitrate Price Trends
- Latvia Potassium Nitrate Porter`s Five Forces
- Latvia Potassium Nitrate Industry Life Cycle
- Historical Data and Forecast of Latvia Potassium Nitrate Market Revenues & Volume By Raw Material for the Period 2022 - 2032F
- Historical Data and Forecast of Latvia Potassium Nitrate Market Revenues & Volume By Potassium Chloride for the Period 2022 - 2032F
- Historical Data and Forecast of Latvia Potassium Nitrate Market Revenues & Volume By Ammonium Nitrate for the Period 2022 - 2032F
- Historical Data and Forecast of Latvia Potassium Nitrate Market Revenues & Volume By Sodium Nitrate for the Period 2022 - 2032F
- Historical Data and Forecast of Latvia Potassium Nitrate Market Revenues & Volume By End Use Industry for the Period 2022 - 2032F
- Historical Data and Forecast of Latvia Potassium Nitrate Market Revenues & Volume By Agricultural Industry for the Period 2022 - 2032F
- Historical Data and Forecast of Latvia Potassium Nitrate Market Revenues & Volume By General Industries for the Period 2022 - 2032F
- Historical Data and Forecast of Latvia Potassium Nitrate Market Revenues & Volume By Pharmaceuticals for the Period 2022 - 2032F
- Historical Data and Forecast of Latvia Potassium Nitrate Market Revenues & Volume By Food Industry for the Period 2022 - 2032F
- Latvia Potassium Nitrate Import Export Trade Statistics
- Market Opportunity Assessment By Raw Material
- Market Opportunity Assessment By End Use Industry
- Latvia Potassium Nitrate Top Companies Market Share
- Latvia Potassium Nitrate Competitive Benchmarking By Technical and Operational Parameters
- Latvia Potassium Nitrate Company Profiles
- Latvia Potassium Nitrate Key Strategic Recommendations
Frequently Asked Questions About the Market Study (FAQs):
6Wresearch actively monitors the Latvia Potassium Nitrate Market and publishes its comprehensive annual report, highlighting emerging trends, growth drivers, revenue analysis, and forecast outlook. Our insights help businesses to make data-backed strategic decisions with ongoing market dynamics. Our analysts track relevent industries related to the Latvia Potassium Nitrate Market, allowing our clients with actionable intelligence and reliable forecasts tailored to emerging regional needs.
Yes, we provide customisation as per your requirements. To learn more, feel free to contact us on sales@6wresearch.com
1 Executive Summary |
2 Introduction |
2.1 Key Highlights of the Report |
2.2 Report Description |
2.3 Market Scope & Segmentation |
2.4 Research Methodology |
2.5 Assumptions |
3 Latvia Potassium Nitrate Market Overview |
3.1 Latvia Country Macro Economic Indicators |
3.2 Latvia Potassium Nitrate Market Revenues & Volume, 2022 & 2032F |
3.3 Latvia Potassium Nitrate Market - Industry Life Cycle |
3.4 Latvia Potassium Nitrate Market - Porter's Five Forces |
3.5 Latvia Potassium Nitrate Market Revenues & Volume Share, By Raw Material, 2022 & 2032F |
3.6 Latvia Potassium Nitrate Market Revenues & Volume Share, By End Use Industry, 2022 & 2032F |
4 Latvia Potassium Nitrate Market Dynamics |
4.1 Impact Analysis |
4.2 Market Drivers |
4.3 Market Restraints |
5 Latvia Potassium Nitrate Market Trends |
6 Latvia Potassium Nitrate Market Segmentations |
6.1 Latvia Potassium Nitrate Market, By Raw Material |
6.1.1 Overview and Analysis |
6.1.2 Latvia Potassium Nitrate Market Revenues & Volume, By Potassium Chloride, 2022 - 2032F |
6.1.3 Latvia Potassium Nitrate Market Revenues & Volume, By Ammonium Nitrate, 2022 - 2032F |
6.1.4 Latvia Potassium Nitrate Market Revenues & Volume, By Sodium Nitrate, 2022 - 2032F |
6.2 Latvia Potassium Nitrate Market, By End Use Industry |
6.2.1 Overview and Analysis |
6.2.2 Latvia Potassium Nitrate Market Revenues & Volume, By Agricultural Industry, 2022 - 2032F |
6.2.3 Latvia Potassium Nitrate Market Revenues & Volume, By General Industries, 2022 - 2032F |
6.2.4 Latvia Potassium Nitrate Market Revenues & Volume, By Pharmaceuticals, 2022 - 2032F |
6.2.5 Latvia Potassium Nitrate Market Revenues & Volume, By Food Industry, 2022 - 2032F |
7 Latvia Potassium Nitrate Market Import-Export Trade Statistics |
7.1 Latvia Potassium Nitrate Market Export to Major Countries |
7.2 Latvia Potassium Nitrate Market Imports from Major Countries |
8 Latvia Potassium Nitrate Market Key Performance Indicators |
9 Latvia Potassium Nitrate Market - Opportunity Assessment |
9.1 Latvia Potassium Nitrate Market Opportunity Assessment, By Raw Material, 2022 & 2032F |
9.2 Latvia Potassium Nitrate Market Opportunity Assessment, By End Use Industry, 2022 & 2032F |
10 Latvia Potassium Nitrate Market - Competitive Landscape |
10.1 Latvia Potassium Nitrate Market Revenue Share, By Companies, 2025 |
10.2 Latvia Potassium Nitrate Market Competitive Benchmarking, By Operating and Technical Parameters |
11 Company Profiles |
12 Recommendations | 13 Disclaimer |
Global Go To Market Strategy - 2030
Export potential enables firms to identify high-growth global markets with greater confidence by combining advanced trade intelligence with a structured quantitative methodology. The framework analyzes emerging demand trends and country-level import patterns while integrating macroeconomic and trade datasets such as GDP and population forecasts, bilateral import–export flows, tariff structures, elasticity differentials between developed and developing economies, geographic distance, and import demand projections. Using weighted trade values from 2020–2024 as the base period to project country-to-country export potential for 2030, these inputs are operationalized through calculated drivers such as gravity model parameters, tariff impact factors, and projected GDP per-capita growth. Through an analysis of hidden potentials, demand hotspots, and market conditions that are most favorable to success, this method enables firms to focus on target countries, maximize returns, and global expansion with data, backed by accuracy.
By factoring in the projected importer demand gap that is currently unmet and could be potential opportunity, it identifies the potential for the Exporter (Country) among 190 countries, against the general trade analysis, which identifies the biggest importer or exporter.
To discover high-growth global markets and optimize your business strategy:
Click Here
Pricing
- Single User License$ 1,995
- Department License$ 2,400
- Site License$ 3,120
- Global License$ 3,795

Leadership Perspectives from Industry Events
Search
Thought Leadership and Analyst Meet


Our Clients
6WResearch In News
- Doha a strategic location for EV manufacturing hub: IPA Qatar
- Demand for luxury TVs surging in the GCC, says Samsung
- Empowering Growth: The Thriving Journey of Bangladesh’s Cable Industry
- Demand for luxury TVs surging in the GCC, says Samsung
- Video call with a traditional healer? Once unthinkable, it’s now common in South Africa
- Intelligent Buildings To Smooth GCC’s Path To Net Zero
Latest Reports
- Taiwan Airport Wireless Infrastructure Market (2026-2032)
- Vietnam Airport Wireless Infrastructure Market (2026-2032)
- Thailand Airport Wireless Infrastructure Market (2026-2032)
- South Korea Airport Wireless Infrastructure Market (2026-2032)
- Romania Airport Wireless Infrastructure Market (2026-2032)
- Qatar Airport Wireless Infrastructure Market (2026-2032)
- Philippines Airport Wireless Infrastructure Market (2026-2032)
- Japan Airport Wireless Infrastructure Market (2026-2032)
- Taiwan Airport Winter Services Market (2026-2032)
- Vietnam Airport Winter Services Market (2026-2032)
Industry Events and Analyst Meet

HIMTEX 2026

India Refining Summit 2026

India EV Show 2026

EV tech India Expo 2026

Auto Tech Asia 2026
Whitepaper
- Middle East & Africa Commercial Security Market Click here to view more.
- Middle East & Africa Fire Safety Systems & Equipment Market Click here to view more.
- GCC Drone Market Click here to view more.
- Middle East Lighting Fixture Market Click here to view more.
- GCC Physical & Perimeter Security Market Click here to view more.