Latvia Retail Fuel Station Market (2025-2031) | Supply, Segments, Pricing Analysis, Drivers, Industry, Trends, Consumer Insights, Size, Analysis, Competition, Revenue, Forecast, Strategy, Segmentation, Restraints, Investment Trends, Challenges, Companies, Value, Competitive, Strategic Insights, Opportunities, Growth, Demand, Share, Outlook
Market Forecast By Type (Conventional, Alternative, Hybrid), By Fuel Type (Petrol, Diesel, CNG, EV Charging, Multiple Fuel Options), By Technology (Dispenser & Metering, Renewable Energy Integration, Smart Payment Systems), By End Use (Gas Stations, Urban Areas, Highways) And Competitive Landscape
| Product Code: ETC10437109 | Publication Date: Apr 2025 | Updated Date: Apr 2026 | Product Type: Market Research Report | |
| Publisher: 6Wresearch | Author: Bhawna Singh | No. of Pages: 65 | No. of Figures: 34 | No. of Tables: 19 |
Latvia Retail Fuel Station Market Size (2020-2030)
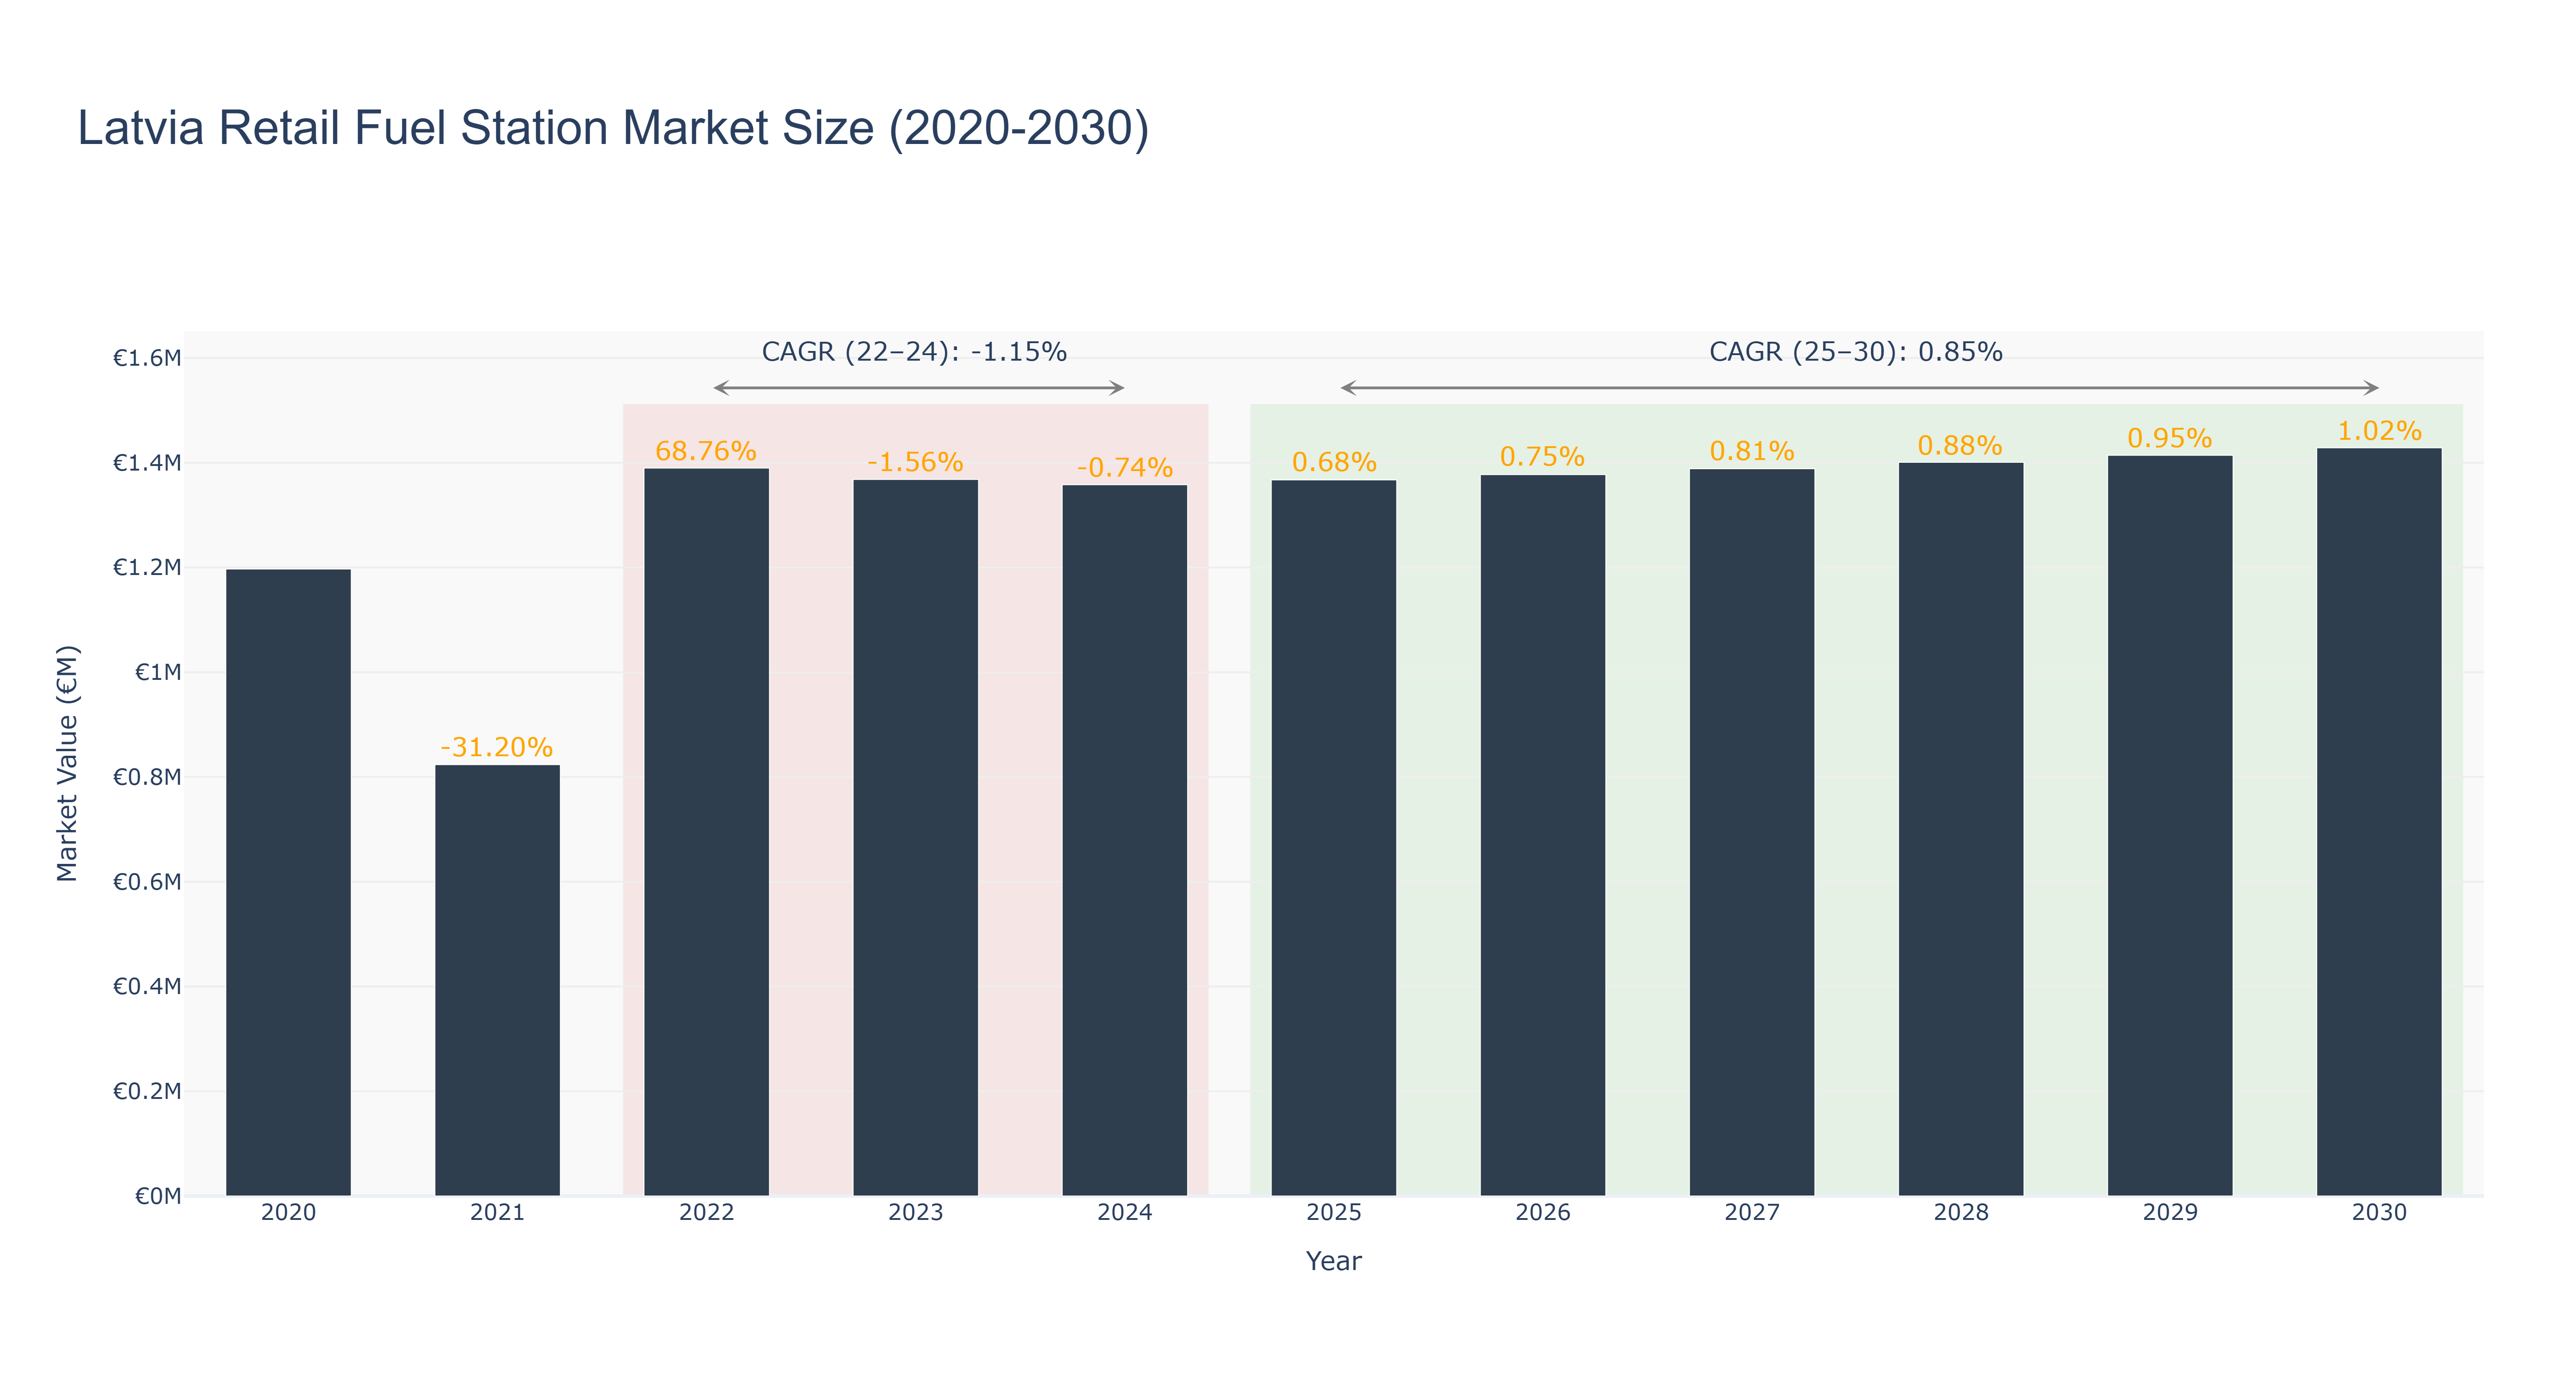
Latvia Retail Fuel Station Market has shown a fluctuating trend in recent years. The peak market size was €1.43 million in 2030, with a steady growth rate. From 2020 to 2024, the market size decreased from €1.20 million to €1.36 million, experiencing a slight decline attributed to economic uncertainties and changing consumer preferences. However, the forecasted market size from 2025 to 2030 is expected to increase steadily, with a CAGR of 0.85% from 2025 to 2030. The recent developments in the market include the introduction of eco-friendly fuel options and digital payment systems, aiming to enhance customer experience and sustainability. Looking ahead, upcoming infrastructure projects to improve fuel station accessibility and efficiency are anticipated to further drive market growth in Latvia.
Latvia Retail Fuel Station Market: Production & Trade Performance (2019-2025)
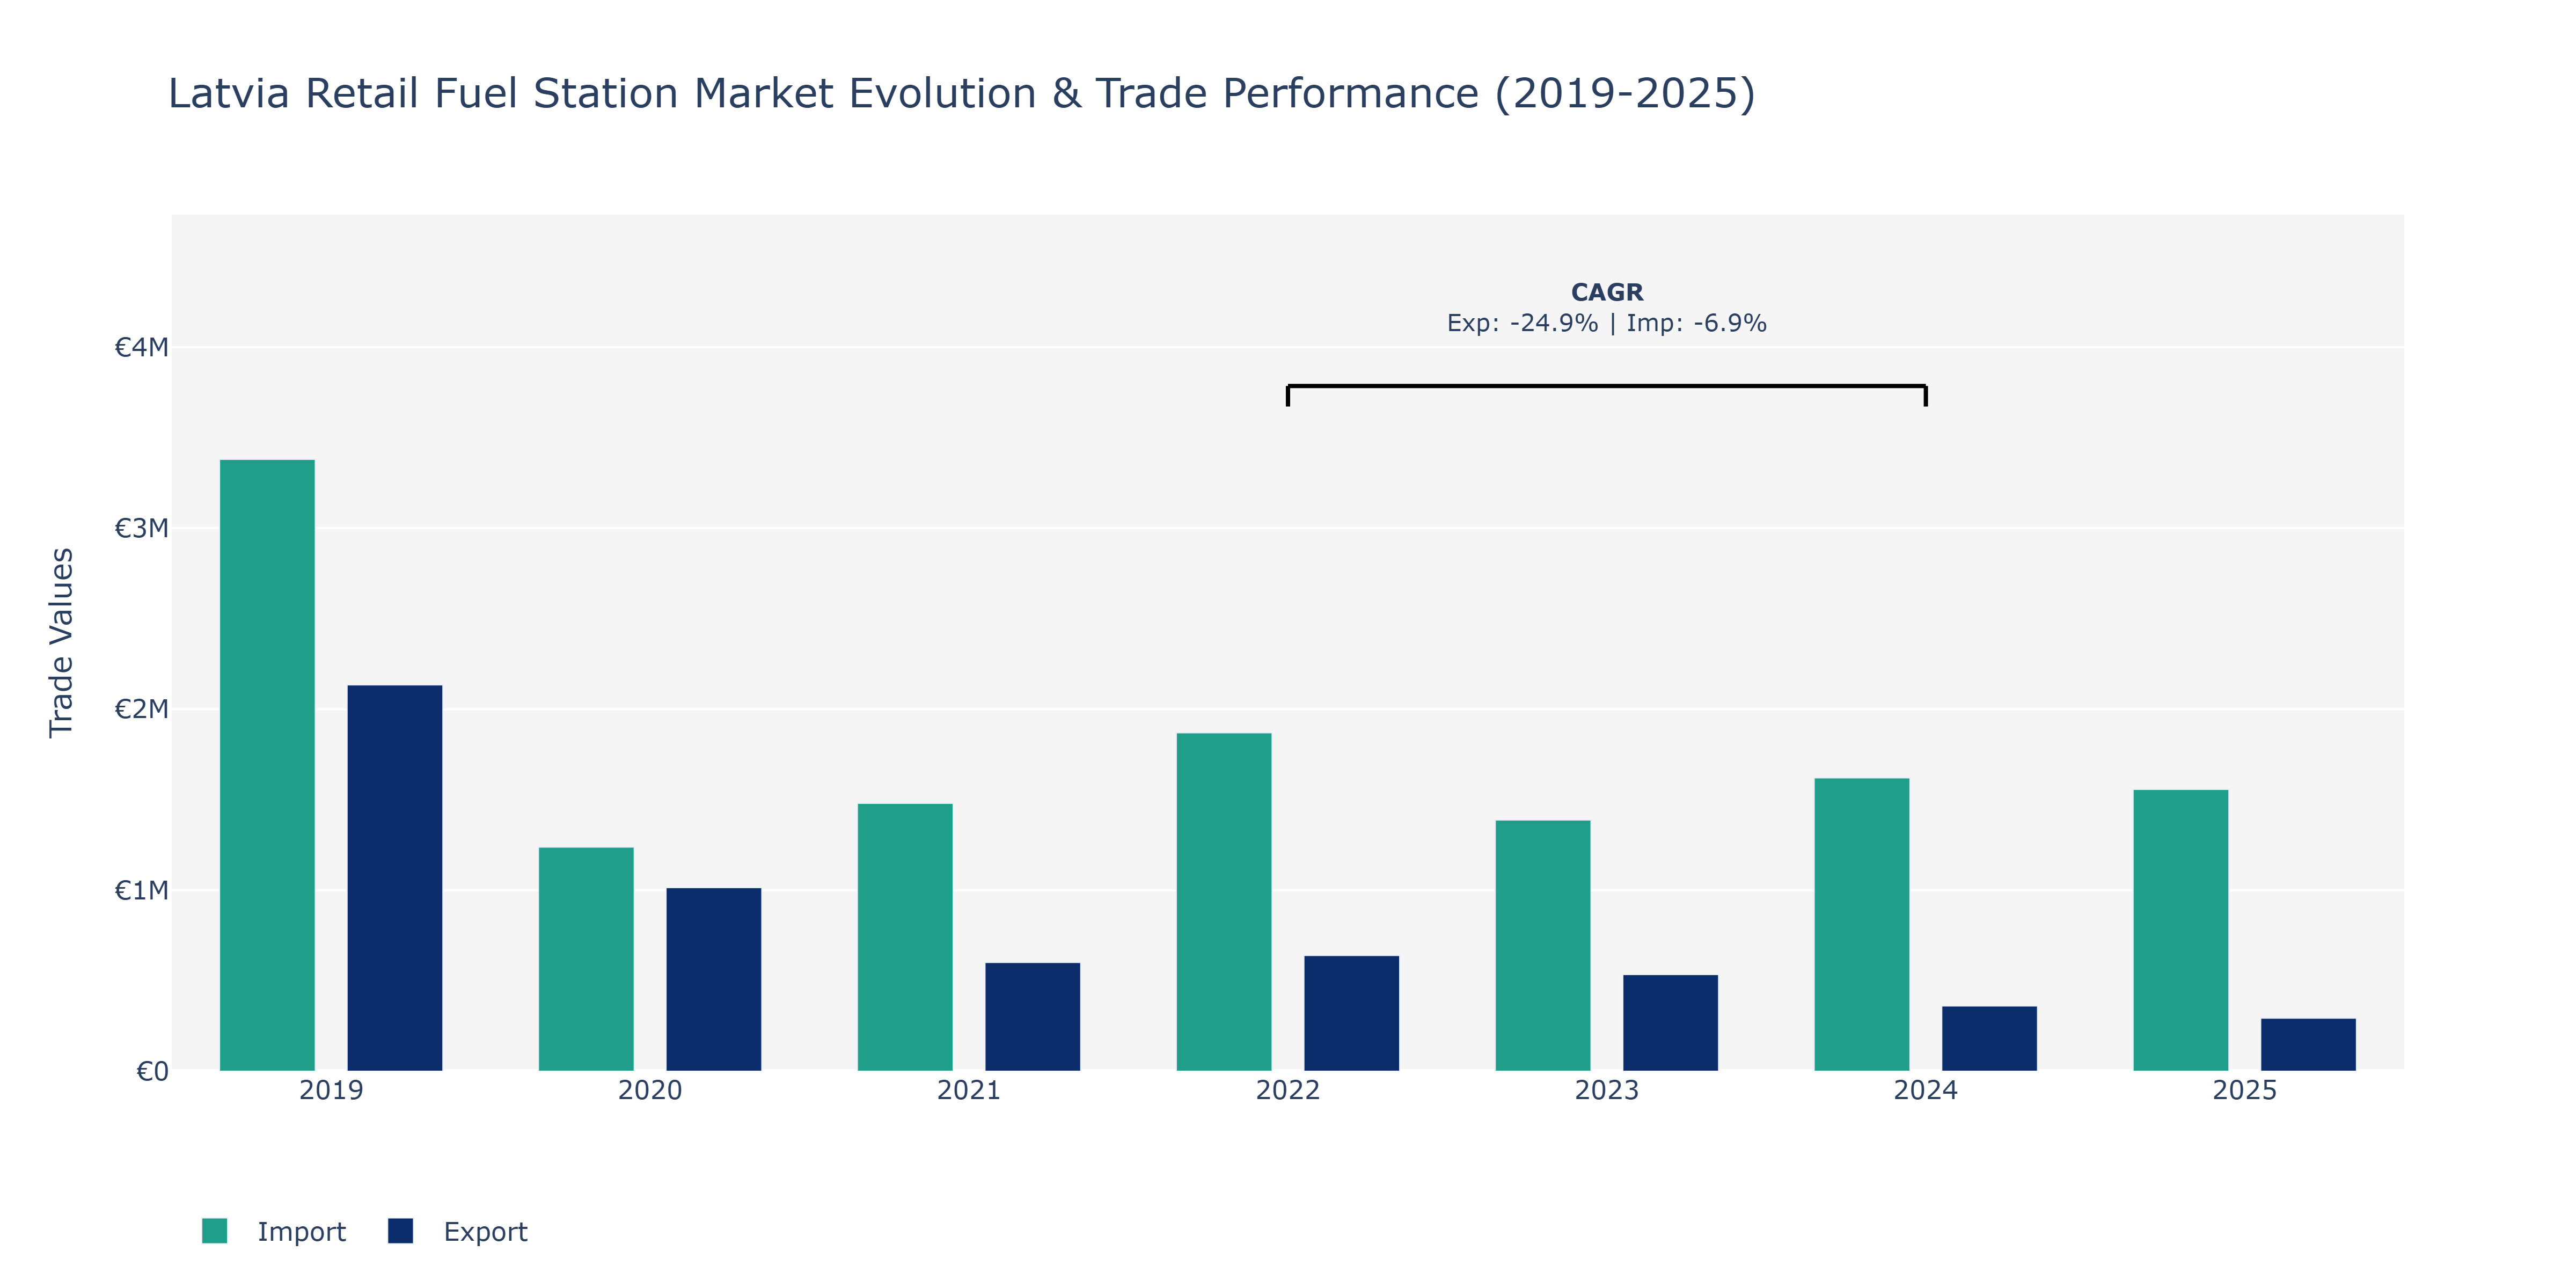
During the period from 2019 to 2025, Latvia's Retail Fuel Station Market witnessed fluctuations in both exports and imports. In 2019, exports amounted to €2.13 million, peaking at their highest point, while imports reached €3.38 million, marking the peak for the period under review. However, there was a significant decline in exports to €0.29 million by 2025, indicating a downward trend. Imports also experienced a decline, reaching €1.56 million in 2025. These fluctuations could be attributed to various factors such as changes in global oil prices, shifts in consumer demand for fuel types, and regulatory developments impacting trade agreements. The negative export and import CAGRs for the years 2022 to 2024 further reflect challenges faced by the industry, potentially influenced by geopolitical factors impacting trade volumes and economic conditions. The market may benefit from strategies focusing on cost efficiency, supply chain optimization, and diversification to navigate these challenges effectively.
Key Highlights of the Report:
- Latvia Retail Fuel Station Market Outlook
- Market Size of Latvia Retail Fuel Station Market,2024
- Forecast of Latvia Retail Fuel Station Market, 2031
- Historical Data and Forecast of Latvia Retail Fuel Station Revenues & Volume for the Period 2021-2031
- Latvia Retail Fuel Station Market Trend Evolution
- Latvia Retail Fuel Station Market Drivers and Challenges
- Latvia Retail Fuel Station Price Trends
- Latvia Retail Fuel Station Porter's Five Forces
- Latvia Retail Fuel Station Industry Life Cycle
- Historical Data and Forecast of Latvia Retail Fuel Station Market Revenues & Volume By Type for the Period 2021-2031
- Historical Data and Forecast of Latvia Retail Fuel Station Market Revenues & Volume By Conventional for the Period 2021-2031
- Historical Data and Forecast of Latvia Retail Fuel Station Market Revenues & Volume By Alternative for the Period 2021-2031
- Historical Data and Forecast of Latvia Retail Fuel Station Market Revenues & Volume By Hybrid for the Period 2021-2031
- Historical Data and Forecast of Latvia Retail Fuel Station Market Revenues & Volume By Fuel Type for the Period 2021-2031
- Historical Data and Forecast of Latvia Retail Fuel Station Market Revenues & Volume By Petrol, Diesel for the Period 2021-2031
- Historical Data and Forecast of Latvia Retail Fuel Station Market Revenues & Volume By CNG, EV Charging for the Period 2021-2031
- Historical Data and Forecast of Latvia Retail Fuel Station Market Revenues & Volume By Multiple Fuel Options for the Period 2021-2031
- Historical Data and Forecast of Latvia Retail Fuel Station Market Revenues & Volume By Technology for the Period 2021-2031
- Historical Data and Forecast of Latvia Retail Fuel Station Market Revenues & Volume By Dispenser & Metering for the Period 2021-2031
- Historical Data and Forecast of Latvia Retail Fuel Station Market Revenues & Volume By Renewable Energy Integration for the Period 2021-2031
- Historical Data and Forecast of Latvia Retail Fuel Station Market Revenues & Volume By Smart Payment Systems for the Period 2021-2031
- Historical Data and Forecast of Latvia Retail Fuel Station Market Revenues & Volume By End Use for the Period 2021-2031
- Historical Data and Forecast of Latvia Retail Fuel Station Market Revenues & Volume By Gas Stations for the Period 2021-2031
- Historical Data and Forecast of Latvia Retail Fuel Station Market Revenues & Volume By Urban Areas for the Period 2021-2031
- Historical Data and Forecast of Latvia Retail Fuel Station Market Revenues & Volume By Highways for the Period 2021-2031
- Latvia Retail Fuel Station Import Export Trade Statistics
- Market Opportunity Assessment By Type
- Market Opportunity Assessment By Fuel Type
- Market Opportunity Assessment By Technology
- Market Opportunity Assessment By End Use
- Latvia Retail Fuel Station Top Companies Market Share
- Latvia Retail Fuel Station Competitive Benchmarking By Technical and Operational Parameters
- Latvia Retail Fuel Station Company Profiles
- Latvia Retail Fuel Station Key Strategic Recommendations
Frequently Asked Questions About the Market Study (FAQs):
6Wresearch actively monitors the Latvia Retail Fuel Station Market and publishes its comprehensive annual report, highlighting emerging trends, growth drivers, revenue analysis, and forecast outlook. Our insights help businesses to make data-backed strategic decisions with ongoing market dynamics. Our analysts track relevent industries related to the Latvia Retail Fuel Station Market, allowing our clients with actionable intelligence and reliable forecasts tailored to emerging regional needs.
Yes, we provide customisation as per your requirements. To learn more, feel free to contact us on sales@6wresearch.com
1 Executive Summary |
2 Introduction |
2.1 Key Highlights of the Report |
2.2 Report Description |
2.3 Market Scope & Segmentation |
2.4 Research Methodology |
2.5 Assumptions |
3 Latvia Retail Fuel Station Market Overview |
3.1 Latvia Country Macro Economic Indicators |
3.2 Latvia Retail Fuel Station Market Revenues & Volume, 2021 & 2031F |
3.3 Latvia Retail Fuel Station Market - Industry Life Cycle |
3.4 Latvia Retail Fuel Station Market - Porter's Five Forces |
3.5 Latvia Retail Fuel Station Market Revenues & Volume Share, By Type, 2021 & 2031F |
3.6 Latvia Retail Fuel Station Market Revenues & Volume Share, By Fuel Type, 2021 & 2031F |
3.7 Latvia Retail Fuel Station Market Revenues & Volume Share, By Technology, 2021 & 2031F |
3.8 Latvia Retail Fuel Station Market Revenues & Volume Share, By End Use, 2021 & 2031F |
4 Latvia Retail Fuel Station Market Dynamics |
4.1 Impact Analysis |
4.2 Market Drivers |
4.2.1 Increasing demand for automobiles in Latvia |
4.2.2 Growth in the transportation and logistics sector |
4.2.3 Government initiatives promoting cleaner and more efficient fuel options |
4.3 Market Restraints |
4.3.1 Fluctuating crude oil prices impacting fuel costs |
4.3.2 Competition from alternative transportation modes like electric vehicles |
4.3.3 Regulatory challenges and compliance requirements |
5 Latvia Retail Fuel Station Market Trends |
6 Latvia Retail Fuel Station Market, By Types |
6.1 Latvia Retail Fuel Station Market, By Type |
6.1.1 Overview and Analysis |
6.1.2 Latvia Retail Fuel Station Market Revenues & Volume, By Type, 2021 - 2031F |
6.1.3 Latvia Retail Fuel Station Market Revenues & Volume, By Conventional, 2021 - 2031F |
6.1.4 Latvia Retail Fuel Station Market Revenues & Volume, By Alternative, 2021 - 2031F |
6.1.5 Latvia Retail Fuel Station Market Revenues & Volume, By Hybrid, 2021 - 2031F |
6.2 Latvia Retail Fuel Station Market, By Fuel Type |
6.2.1 Overview and Analysis |
6.2.2 Latvia Retail Fuel Station Market Revenues & Volume, By Petrol, Diesel, 2021 - 2031F |
6.2.3 Latvia Retail Fuel Station Market Revenues & Volume, By CNG, EV Charging, 2021 - 2031F |
6.2.4 Latvia Retail Fuel Station Market Revenues & Volume, By Multiple Fuel Options, 2021 - 2031F |
6.3 Latvia Retail Fuel Station Market, By Technology |
6.3.1 Overview and Analysis |
6.3.2 Latvia Retail Fuel Station Market Revenues & Volume, By Dispenser & Metering, 2021 - 2031F |
6.3.3 Latvia Retail Fuel Station Market Revenues & Volume, By Renewable Energy Integration, 2021 - 2031F |
6.3.4 Latvia Retail Fuel Station Market Revenues & Volume, By Smart Payment Systems, 2021 - 2031F |
6.4 Latvia Retail Fuel Station Market, By End Use |
6.4.1 Overview and Analysis |
6.4.2 Latvia Retail Fuel Station Market Revenues & Volume, By Gas Stations, 2021 - 2031F |
6.4.3 Latvia Retail Fuel Station Market Revenues & Volume, By Urban Areas, 2021 - 2031F |
6.4.4 Latvia Retail Fuel Station Market Revenues & Volume, By Highways, 2021 - 2031F |
7 Latvia Retail Fuel Station Market Import-Export Trade Statistics |
7.1 Latvia Retail Fuel Station Market Export to Major Countries |
7.2 Latvia Retail Fuel Station Market Imports from Major Countries |
8 Latvia Retail Fuel Station Market Key Performance Indicators |
8.1 Average transaction value per customer |
8.2 Number of loyalty program sign-ups |
8.3 Percentage of revenue from non-fuel sales |
8.4 Customer satisfaction scores |
8.5 Average wait time at fuel stations |
9 Latvia Retail Fuel Station Market - Opportunity Assessment |
9.1 Latvia Retail Fuel Station Market Opportunity Assessment, By Type, 2021 & 2031F |
9.2 Latvia Retail Fuel Station Market Opportunity Assessment, By Fuel Type, 2021 & 2031F |
9.3 Latvia Retail Fuel Station Market Opportunity Assessment, By Technology, 2021 & 2031F |
9.4 Latvia Retail Fuel Station Market Opportunity Assessment, By End Use, 2021 & 2031F |
10 Latvia Retail Fuel Station Market - Competitive Landscape |
10.1 Latvia Retail Fuel Station Market Revenue Share, By Companies, 2024 |
10.2 Latvia Retail Fuel Station Market Competitive Benchmarking, By Operating and Technical Parameters |
11 Company Profiles |
12 Recommendations |
13 Disclaimer |
Export potential assessment - trade Analytics for 2030
Export potential enables firms to identify high-growth global markets with greater confidence by combining advanced trade intelligence with a structured quantitative methodology. The framework analyzes emerging demand trends and country-level import patterns while integrating macroeconomic and trade datasets such as GDP and population forecasts, bilateral import–export flows, tariff structures, elasticity differentials between developed and developing economies, geographic distance, and import demand projections. Using weighted trade values from 2020–2024 as the base period to project country-to-country export potential for 2030, these inputs are operationalized through calculated drivers such as gravity model parameters, tariff impact factors, and projected GDP per-capita growth. Through an analysis of hidden potentials, demand hotspots, and market conditions that are most favorable to success, this method enables firms to focus on target countries, maximize returns, and global expansion with data, backed by accuracy.
By factoring in the projected importer demand gap that is currently unmet and could be potential opportunity, it identifies the potential for the Exporter (Country) among 190 countries, against the general trade analysis, which identifies the biggest importer or exporter.
To discover high-growth global markets and optimize your business strategy:
Click Here
Pricing
- Single User License$ 1,995
- Department License$ 2,400
- Site License$ 3,120
- Global License$ 3,795

Search
Thought Leadership and Analyst Meet


Our Clients
Latest Reports
- China Electric Appliance Rental Market (2026-2032) | Trends, Revenue, Growth, Challenges, Size, Value, Outlook, Pricing, Strategy, Insights, Restraints, segmentation, Companies, Investment Opportunities, Analysis, Demand, Drivers, Competition, Forecast, Share
- Chile Electric Appliance Rental Market (2026-2032) | Outlook, Competition, Drivers, Strategy, Revenue, Analysis, Value, Pricing, Restraints, Size, Demand, Share, Growth, Forecast, Challenges, Insights, Investment Opportunities, Companies, Trends, segmentation
- Cambodia Electric Appliance Rental Market (2026-2032) | Companies, Analysis, Restraints, Pricing, Insights, Challenges, Outlook, Strategy, Forecast, Trends, Competition, Value, Revenue, Investment Opportunities, segmentation, Drivers, Size, Demand, Growth, Share
- Brazil Electric Appliance Rental Market (2026-2032) | Revenue, Strategy, Forecast, Companies, segmentation, Competition, Size, Investment Opportunities, Pricing, Restraints, Outlook, Challenges, Analysis, Drivers, Value, Demand, Insights, Trends, Growth, Share
- Bangladesh Electric Appliance Rental Market (2026-2032) | Drivers, Forecast, Investment Opportunities, Strategy, Insights, Demand, Challenges, Outlook, Trends, Competition, Value, Revenue, Size, Pricing, Analysis, Companies, Restraints, segmentation, Share, Growth
- Bahrain Electric Appliance Rental Market (2026-2032) | Outlook, Size, Competition, Restraints, Drivers, Value, Trends, Investment Opportunities, Insights, Forecast, Revenue, Strategy, Growth, Share, Demand, Analysis, Challenges, Companies, segmentation, Pricing
- Azerbaijan Electric Appliance Rental Market (2026-2032) | Trends, Investment Opportunities, Restraints, Insights, Strategy, Competition, Value, Growth, Demand, Drivers, Analysis, Forecast, Size, Share, Outlook, segmentation, Pricing, Challenges, Revenue, Companies
- Australia Electric Appliance Rental Market (2026-2032) | Challenges, Restraints, Forecast, Demand, Size, Competition, Pricing, Investment Opportunities, Revenue, Trends, Drivers, Growth, Outlook, Analysis, Strategy, Value, segmentation, Insights, Companies, Share
- Argentina Electric Appliance Rental Market (2026-2032) | Growth, Trends, Insights, Outlook, Forecast, Size, Drivers, Analysis, Restraints, Challenges, Share, Revenue, Investment Opportunities, Strategy, Demand, Value, Companies, segmentation, Competition, Pricing
- Algeria Electric Appliance Rental Market (2026-2032) | Share, Size, Value, Strategy, Competition, Outlook, Challenges, Companies, Trends, Pricing, Insights, Forecast, Investment Opportunities, Revenue, Growth, Restraints, segmentation, Analysis, Demand, Drivers
Industry Events and Analyst Meet

HIMTEX 2026

India Refining Summit 2026

India EV Show 2026

EV tech India Expo 2026

Auto Tech Asia 2026
Whitepaper
- Middle East & Africa Commercial Security Market Click here to view more.
- Middle East & Africa Fire Safety Systems & Equipment Market Click here to view more.
- GCC Drone Market Click here to view more.
- Middle East Lighting Fixture Market Click here to view more.
- GCC Physical & Perimeter Security Market Click here to view more.
6WResearch In News
- Doha a strategic location for EV manufacturing hub: IPA Qatar
- Demand for luxury TVs surging in the GCC, says Samsung
- Empowering Growth: The Thriving Journey of Bangladesh’s Cable Industry
- Demand for luxury TVs surging in the GCC, says Samsung
- Video call with a traditional healer? Once unthinkable, it’s now common in South Africa
- Intelligent Buildings To Smooth GCC’s Path To Net Zero