Latvia Soda Ash Technical Material Market (2026-2032) | Trends, Supply, Outlook, Drivers, Size, Demand, Consumer Insights, Value, Strategic Insights, Forecast, Industry, Segmentation, Opportunities, Companies, Revenue, Pricing Analysis, Competition, Investment Trends, Strategy, Share, Challenges, Restraints, Growth, Analysis, Competitive, Segments
Market Forecast By Type (Dense Soda Ash, Light Soda Ash, Natural Soda Ash, Synthetic Soda Ash, Heavy Soda Ash), By Grade (Industrial, Food-Grade, Pharmaceutical, High-Purity, Technical), By Application (Glass Manufacturing, Detergent Production, Water Treatment, Textile Processing, Chemical Processing), By Manufacturing Process (Solvay Process, Leblanc Process, Trona Mining, Carbonation, Brine Purification), By End User (Glass & Ceramics, Soaps & Detergents, Pharmaceuticals, Textile & Dyes, Pulp & Paper) And Competitive Landscape
| Product Code: ETC10852213 | Publication Date: Apr 2025 | Updated Date: Apr 2026 | Product Type: Market Research Report | |
| Publisher: 6Wresearch | No. of Pages: 65 | No. of Figures: 34 | No. of Tables: 19 | |
Latvia Soda Ash Technical Material Market Size (2020-2030)
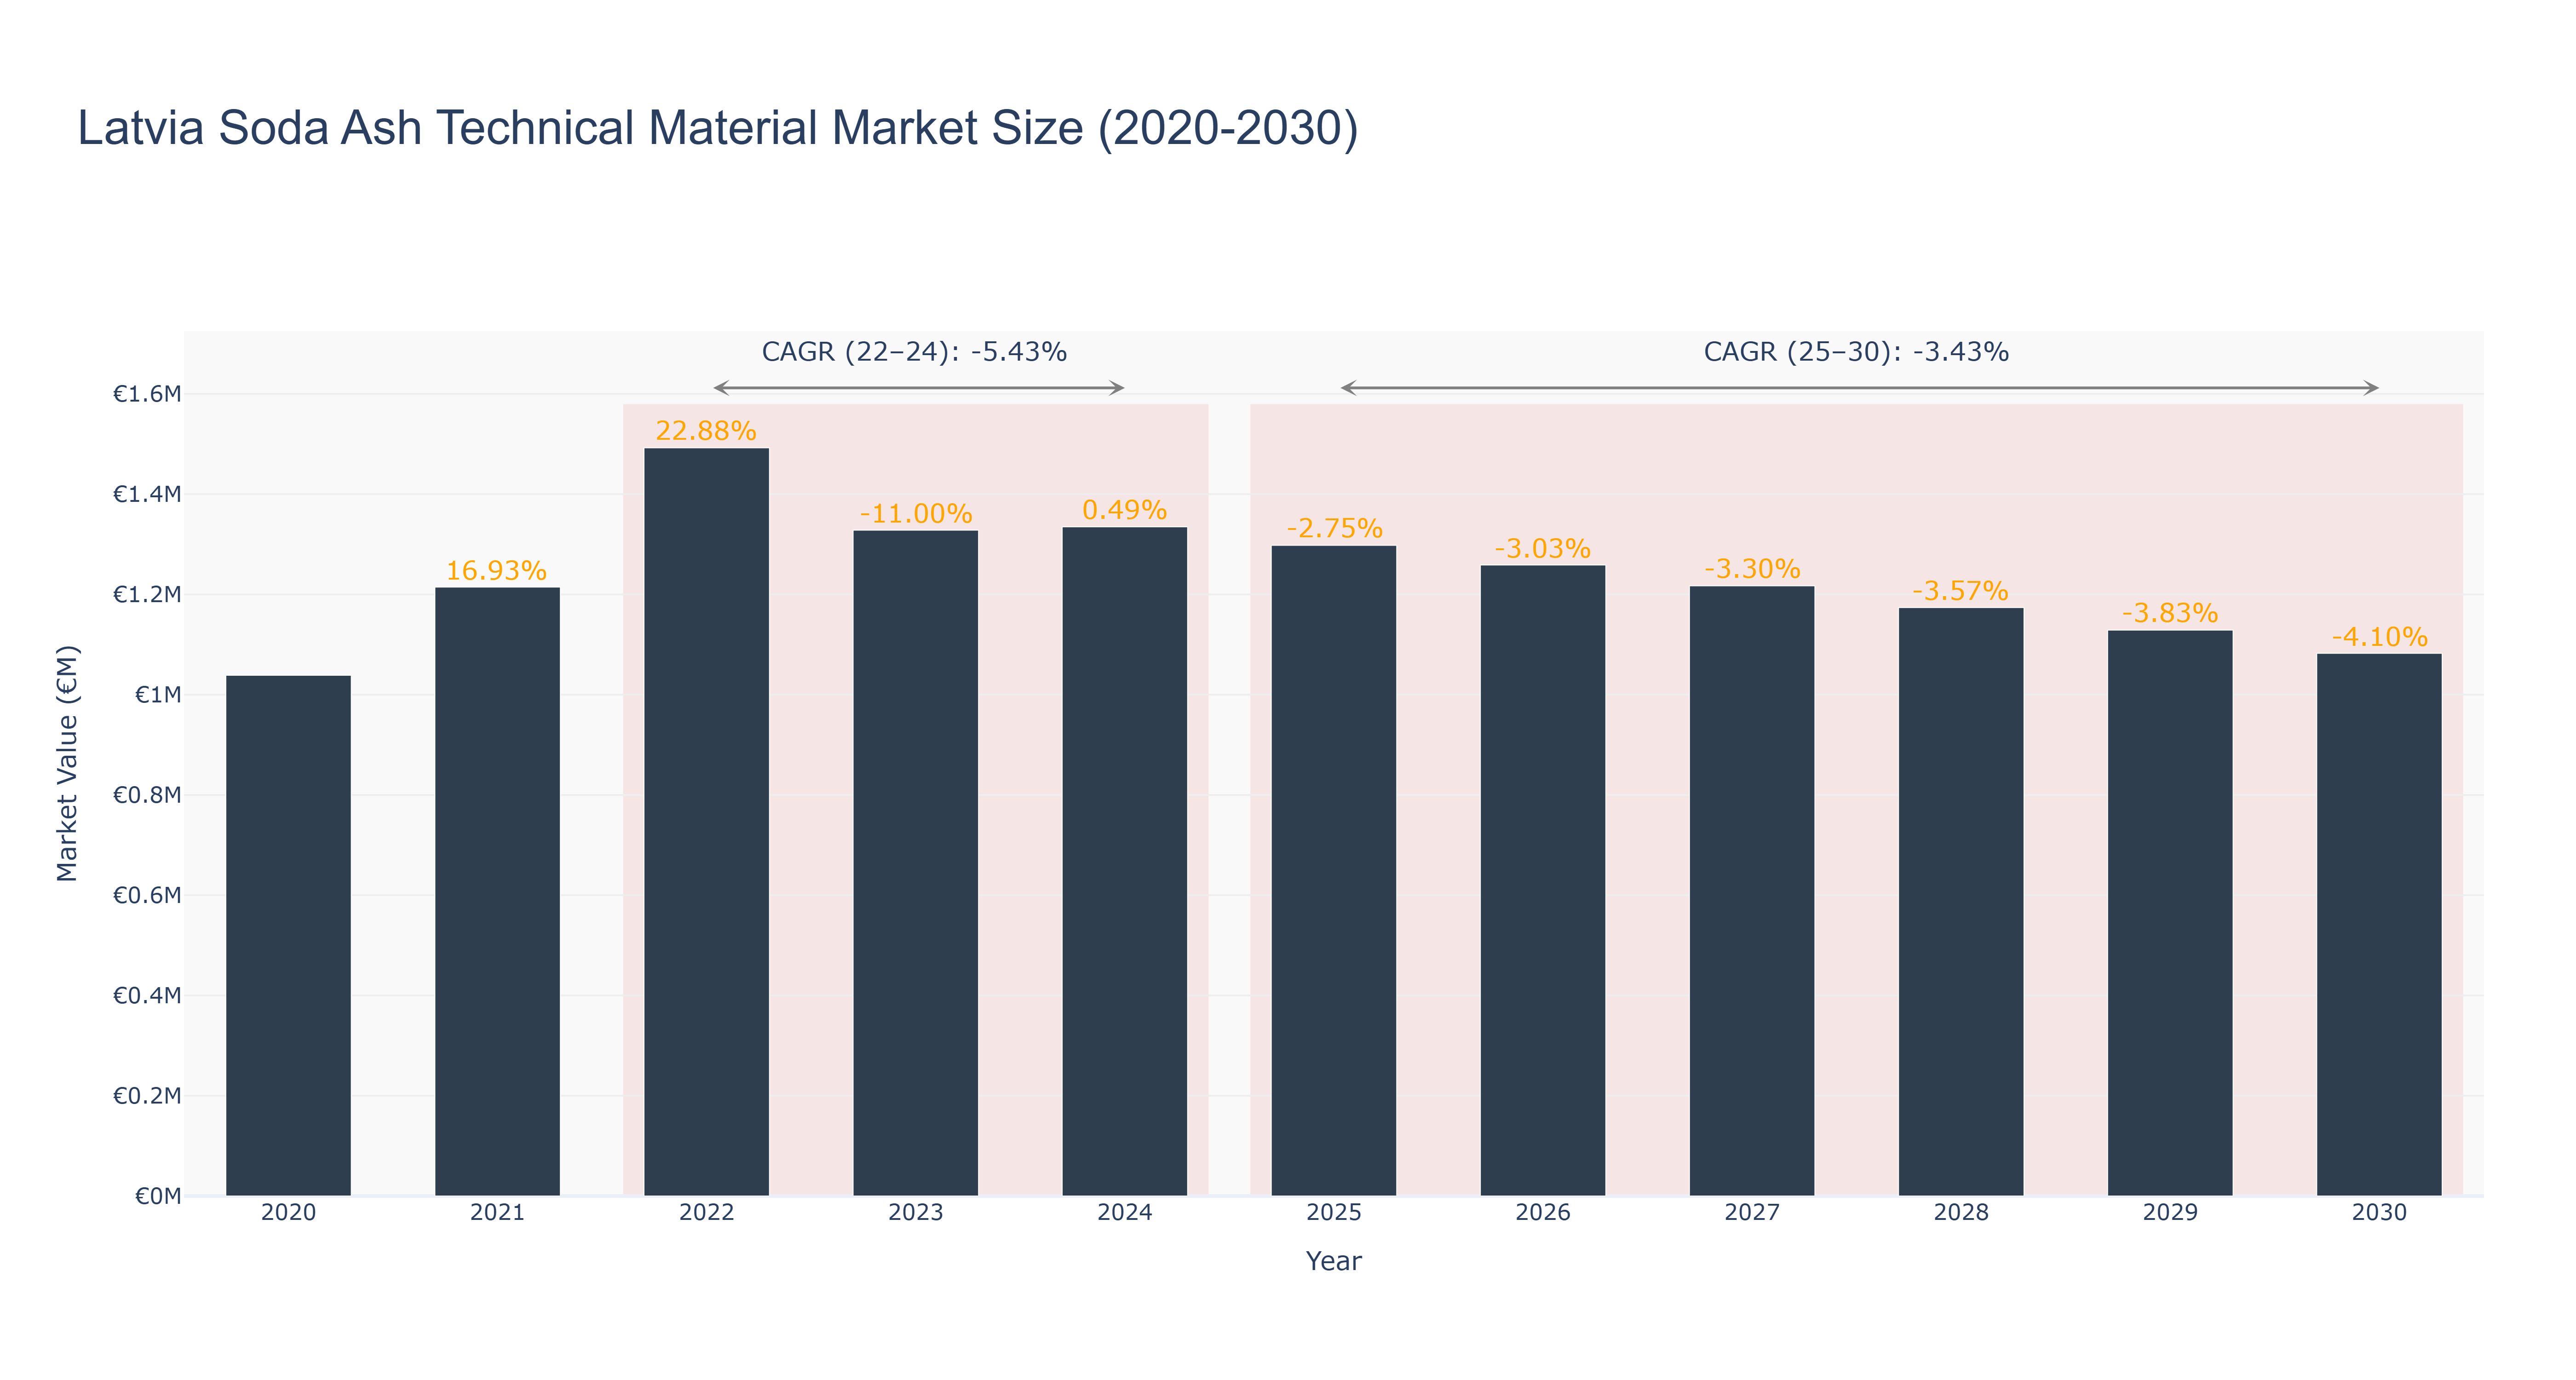
Latvia Soda Ash Technical Material Market has experienced fluctuations in market size over the years. The peak market size of €1.49 million was recorded in 2022, followed by a decline to €1.33 million in 2023, with a slight increase in 2024. The forecasted trend shows a continued decrease in market size from €1.30 million in 2025 to an estimated €1.08 million in 2030. The market has seen a negative Compound Annual Growth Rate (CAGR) of -5.43% from 2022 to 2024 and -3.43% from 2025 to 2030. The downward trend can be attributed to various factors such as changing consumer preferences, economic conditions, and competitive pressures. To counter this trend, upcoming developments in sustainable production methods and technological advancements are expected to drive growth in the Latvia Soda Ash Technical Material Market in the coming years.
Latvia Soda Ash Technical Material Market: Production & Trade Performance (2019-2025)
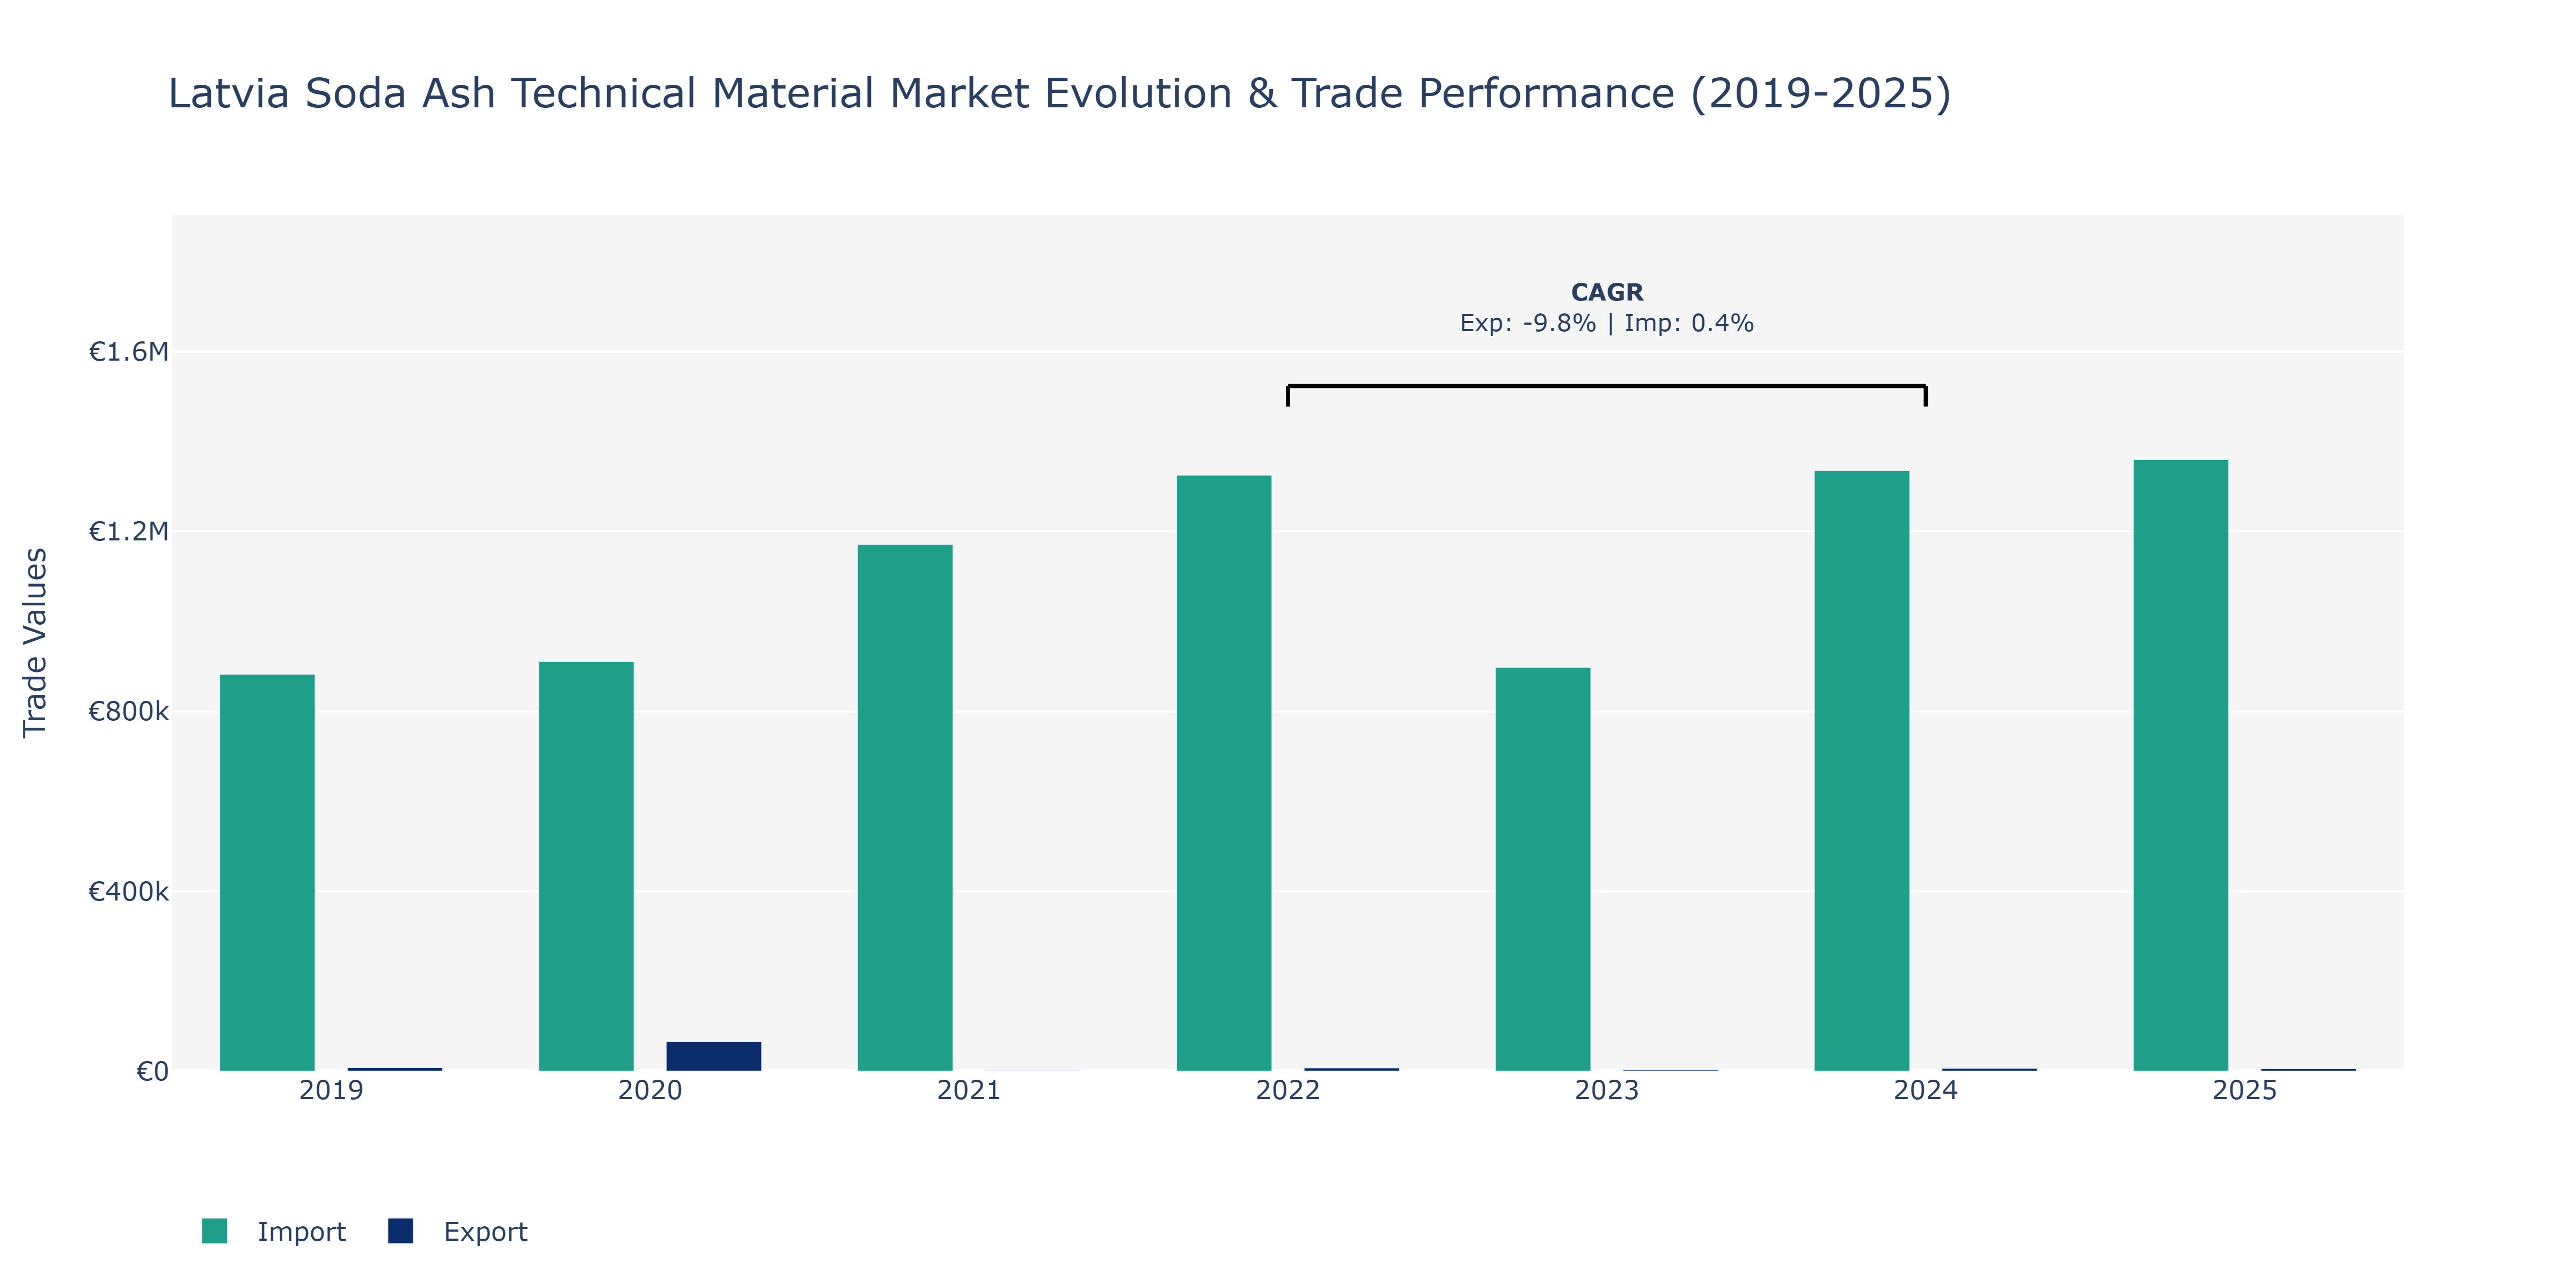
In the Latvia Soda Ash Technical Material Market, exports experienced notable fluctuations during the period under review. Starting at €8.22 thousand in 2019, exports saw a substantial increase to €65.67 thousand in 2020 before declining sharply to €2.48 thousand in 2021. The Export value gradually recovered in the following years, reaching €6.43 thousand in 2024 and €6.02 thousand in 2025. On the other hand, imports consistently grew over the years, from €882.57 thousand in 2019 to a peak of €1.36 million in 2025. The market's export dynamics could be attributed to global demand shifts for soda ash and technical materials, impacting Latvia's production and trade. The import growth indicates the country's increasing reliance on foreign sources for meeting its industrial needs, possibly due to domestic supply constraints or cost-effective procurement strategies. Such trends emphasize the importance of monitoring market demands and supply chain resilience in the soda ash industry to ensure sustainable growth and competitiveness.
Key Highlights of the Report:
- Latvia Soda Ash Technical Material Market Outlook
- Market Size of Latvia Soda Ash Technical Material Market, 2025
- Forecast of Latvia Soda Ash Technical Material Market, 2032
- Historical Data and Forecast of Latvia Soda Ash Technical Material Revenues & Volume for the Period 2022 - 2032F
- Latvia Soda Ash Technical Material Market Trend Evolution
- Latvia Soda Ash Technical Material Market Drivers and Challenges
- Latvia Soda Ash Technical Material Price Trends
- Latvia Soda Ash Technical Material Porter's Five Forces
- Latvia Soda Ash Technical Material Industry Life Cycle
- Historical Data and Forecast of Latvia Soda Ash Technical Material Market Revenues & Volume By Type for the Period 2022 - 2032F
- Historical Data and Forecast of Latvia Soda Ash Technical Material Market Revenues & Volume By Dense Soda Ash for the Period 2022 - 2032F
- Historical Data and Forecast of Latvia Soda Ash Technical Material Market Revenues & Volume By Light Soda Ash for the Period 2022 - 2032F
- Historical Data and Forecast of Latvia Soda Ash Technical Material Market Revenues & Volume By Natural Soda Ash for the Period 2022 - 2032F
- Historical Data and Forecast of Latvia Soda Ash Technical Material Market Revenues & Volume By Synthetic Soda Ash for the Period 2022 - 2032F
- Historical Data and Forecast of Latvia Soda Ash Technical Material Market Revenues & Volume By Heavy Soda Ash for the Period 2022 - 2032F
- Historical Data and Forecast of Latvia Soda Ash Technical Material Market Revenues & Volume By Grade for the Period 2022 - 2032F
- Historical Data and Forecast of Latvia Soda Ash Technical Material Market Revenues & Volume By Industrial for the Period 2022 - 2032F
- Historical Data and Forecast of Latvia Soda Ash Technical Material Market Revenues & Volume By Food-Grade for the Period 2022 - 2032F
- Historical Data and Forecast of Latvia Soda Ash Technical Material Market Revenues & Volume By Pharmaceutical for the Period 2022 - 2032F
- Historical Data and Forecast of Latvia Soda Ash Technical Material Market Revenues & Volume By High-Purity for the Period 2022 - 2032F
- Historical Data and Forecast of Latvia Soda Ash Technical Material Market Revenues & Volume By Technical for the Period 2022 - 2032F
- Historical Data and Forecast of Latvia Soda Ash Technical Material Market Revenues & Volume By Application for the Period 2022 - 2032F
- Historical Data and Forecast of Latvia Soda Ash Technical Material Market Revenues & Volume By Glass Manufacturing for the Period 2022 - 2032F
- Historical Data and Forecast of Latvia Soda Ash Technical Material Market Revenues & Volume By Detergent Production for the Period 2022 - 2032F
- Historical Data and Forecast of Latvia Soda Ash Technical Material Market Revenues & Volume By Water Treatment for the Period 2022 - 2032F
- Historical Data and Forecast of Latvia Soda Ash Technical Material Market Revenues & Volume By Textile Processing for the Period 2022 - 2032F
- Historical Data and Forecast of Latvia Soda Ash Technical Material Market Revenues & Volume By Chemical Processing for the Period 2022 - 2032F
- Historical Data and Forecast of Latvia Soda Ash Technical Material Market Revenues & Volume By Manufacturing Process for the Period 2022 - 2032F
- Historical Data and Forecast of Latvia Soda Ash Technical Material Market Revenues & Volume By Solvay Process for the Period 2022 - 2032F
- Historical Data and Forecast of Latvia Soda Ash Technical Material Market Revenues & Volume By Leblanc Process for the Period 2022 - 2032F
- Historical Data and Forecast of Latvia Soda Ash Technical Material Market Revenues & Volume By Trona Mining for the Period 2022 - 2032F
- Historical Data and Forecast of Latvia Soda Ash Technical Material Market Revenues & Volume By Carbonation for the Period 2022 - 2032F
- Historical Data and Forecast of Latvia Soda Ash Technical Material Market Revenues & Volume By Brine Purification for the Period 2022 - 2032F
- Historical Data and Forecast of Latvia Soda Ash Technical Material Market Revenues & Volume By End User for the Period 2022 - 2032F
- Historical Data and Forecast of Latvia Soda Ash Technical Material Market Revenues & Volume By Glass & Ceramics for the Period 2022 - 2032F
- Historical Data and Forecast of Latvia Soda Ash Technical Material Market Revenues & Volume By Soaps & Detergents for the Period 2022 - 2032F
- Historical Data and Forecast of Latvia Soda Ash Technical Material Market Revenues & Volume By Pharmaceuticals for the Period 2022 - 2032F
- Historical Data and Forecast of Latvia Soda Ash Technical Material Market Revenues & Volume By Textile & Dyes for the Period 2022 - 2032F
- Historical Data and Forecast of Latvia Soda Ash Technical Material Market Revenues & Volume By Pulp & Paper for the Period 2022 - 2032F
- Latvia Soda Ash Technical Material Import Export Trade Statistics
- Market Opportunity Assessment By Type
- Market Opportunity Assessment By Grade
- Market Opportunity Assessment By Application
- Market Opportunity Assessment By Manufacturing Process
- Market Opportunity Assessment By End User
- Latvia Soda Ash Technical Material Top Companies Market Share
- Latvia Soda Ash Technical Material Competitive Benchmarking By Technical and Operational Parameters
- Latvia Soda Ash Technical Material Company Profiles
- Latvia Soda Ash Technical Material Key Strategic Recommendations
Frequently Asked Questions About the Market Study (FAQs):
6Wresearch actively monitors the Latvia Soda Ash Technical Material Market and publishes its comprehensive annual report, highlighting emerging trends, growth drivers, revenue analysis, and forecast outlook. Our insights help businesses to make data-backed strategic decisions with ongoing market dynamics. Our analysts track relevent industries related to the Latvia Soda Ash Technical Material Market, allowing our clients with actionable intelligence and reliable forecasts tailored to emerging regional needs.
Yes, we provide customisation as per your requirements. To learn more, feel free to contact us on sales@6wresearch.com
1 Executive Summary |
2 Introduction |
2.1 Key Highlights of the Report |
2.2 Report Description |
2.3 Market Scope & Segmentation |
2.4 Research Methodology |
2.5 Assumptions |
3 Latvia Soda Ash Technical Material Market Overview |
3.1 Latvia Country Macro Economic Indicators |
3.2 Latvia Soda Ash Technical Material Market Revenues & Volume, 2022 & 2032F |
3.3 Latvia Soda Ash Technical Material Market - Industry Life Cycle |
3.4 Latvia Soda Ash Technical Material Market - Porter's Five Forces |
3.5 Latvia Soda Ash Technical Material Market Revenues & Volume Share, By Type, 2022 & 2032F |
3.6 Latvia Soda Ash Technical Material Market Revenues & Volume Share, By Grade, 2022 & 2032F |
3.7 Latvia Soda Ash Technical Material Market Revenues & Volume Share, By Application, 2022 & 2032F |
3.8 Latvia Soda Ash Technical Material Market Revenues & Volume Share, By Manufacturing Process, 2022 & 2032F |
3.9 Latvia Soda Ash Technical Material Market Revenues & Volume Share, By End User, 2022 & 2032F |
4 Latvia Soda Ash Technical Material Market Dynamics |
4.1 Impact Analysis |
4.2 Market Drivers |
4.2.1 Increasing demand for glass production in Latvia |
4.2.2 Growing use of soda ash in the detergent manufacturing industry |
4.2.3 Favorable government regulations supporting the industrial sector |
4.3 Market Restraints |
4.3.1 Fluctuating raw material prices impacting production costs |
4.3.2 Competition from alternative chemical substitutes |
4.3.3 Environmental concerns related to soda ash production processes |
5 Latvia Soda Ash Technical Material Market Trends |
6 Latvia Soda Ash Technical Material Market, By Types |
6.1 Latvia Soda Ash Technical Material Market, By Type |
6.1.1 Overview and Analysis |
6.1.2 Latvia Soda Ash Technical Material Market Revenues & Volume, By Type, 2022 - 2032F |
6.1.3 Latvia Soda Ash Technical Material Market Revenues & Volume, By Dense Soda Ash, 2022 - 2032F |
6.1.4 Latvia Soda Ash Technical Material Market Revenues & Volume, By Light Soda Ash, 2022 - 2032F |
6.1.5 Latvia Soda Ash Technical Material Market Revenues & Volume, By Natural Soda Ash, 2022 - 2032F |
6.1.6 Latvia Soda Ash Technical Material Market Revenues & Volume, By Synthetic Soda Ash, 2022 - 2032F |
6.1.7 Latvia Soda Ash Technical Material Market Revenues & Volume, By Heavy Soda Ash, 2022 - 2032F |
6.2 Latvia Soda Ash Technical Material Market, By Grade |
6.2.1 Overview and Analysis |
6.2.2 Latvia Soda Ash Technical Material Market Revenues & Volume, By Industrial, 2022 - 2032F |
6.2.3 Latvia Soda Ash Technical Material Market Revenues & Volume, By Food-Grade, 2022 - 2032F |
6.2.4 Latvia Soda Ash Technical Material Market Revenues & Volume, By Pharmaceutical, 2022 - 2032F |
6.2.5 Latvia Soda Ash Technical Material Market Revenues & Volume, By High-Purity, 2022 - 2032F |
6.2.6 Latvia Soda Ash Technical Material Market Revenues & Volume, By Technical, 2022 - 2032F |
6.3 Latvia Soda Ash Technical Material Market, By Application |
6.3.1 Overview and Analysis |
6.3.2 Latvia Soda Ash Technical Material Market Revenues & Volume, By Glass Manufacturing, 2022 - 2032F |
6.3.3 Latvia Soda Ash Technical Material Market Revenues & Volume, By Detergent Production, 2022 - 2032F |
6.3.4 Latvia Soda Ash Technical Material Market Revenues & Volume, By Water Treatment, 2022 - 2032F |
6.3.5 Latvia Soda Ash Technical Material Market Revenues & Volume, By Textile Processing, 2022 - 2032F |
6.3.6 Latvia Soda Ash Technical Material Market Revenues & Volume, By Chemical Processing, 2022 - 2032F |
6.4 Latvia Soda Ash Technical Material Market, By Manufacturing Process |
6.4.1 Overview and Analysis |
6.4.2 Latvia Soda Ash Technical Material Market Revenues & Volume, By Solvay Process, 2022 - 2032F |
6.4.3 Latvia Soda Ash Technical Material Market Revenues & Volume, By Leblanc Process, 2022 - 2032F |
6.4.4 Latvia Soda Ash Technical Material Market Revenues & Volume, By Trona Mining, 2022 - 2032F |
6.4.5 Latvia Soda Ash Technical Material Market Revenues & Volume, By Carbonation, 2022 - 2032F |
6.4.6 Latvia Soda Ash Technical Material Market Revenues & Volume, By Brine Purification, 2022 - 2032F |
6.5 Latvia Soda Ash Technical Material Market, By End User |
6.5.1 Overview and Analysis |
6.5.2 Latvia Soda Ash Technical Material Market Revenues & Volume, By Glass & Ceramics, 2022 - 2032F |
6.5.3 Latvia Soda Ash Technical Material Market Revenues & Volume, By Soaps & Detergents, 2022 - 2032F |
6.5.4 Latvia Soda Ash Technical Material Market Revenues & Volume, By Pharmaceuticals, 2022 - 2032F |
6.5.5 Latvia Soda Ash Technical Material Market Revenues & Volume, By Textile & Dyes, 2022 - 2032F |
6.5.6 Latvia Soda Ash Technical Material Market Revenues & Volume, By Pulp & Paper, 2022 - 2032F |
7 Latvia Soda Ash Technical Material Market Import-Export Trade Statistics |
7.1 Latvia Soda Ash Technical Material Market Export to Major Countries |
7.2 Latvia Soda Ash Technical Material Market Imports from Major Countries |
8 Latvia Soda Ash Technical Material Market Key Performance Indicators |
8.1 Energy efficiency improvements in soda ash production |
8.2 Adoption rate of sustainable practices in manufacturing |
8.3 Research and development investments in new soda ash applications |
9 Latvia Soda Ash Technical Material Market - Opportunity Assessment |
9.1 Latvia Soda Ash Technical Material Market Opportunity Assessment, By Type, 2022 & 2032F |
9.2 Latvia Soda Ash Technical Material Market Opportunity Assessment, By Grade, 2022 & 2032F |
9.3 Latvia Soda Ash Technical Material Market Opportunity Assessment, By Application, 2022 & 2032F |
9.4 Latvia Soda Ash Technical Material Market Opportunity Assessment, By Manufacturing Process, 2022 & 2032F |
9.5 Latvia Soda Ash Technical Material Market Opportunity Assessment, By End User, 2022 & 2032F |
10 Latvia Soda Ash Technical Material Market - Competitive Landscape |
10.1 Latvia Soda Ash Technical Material Market Revenue Share, By Companies, 2025 |
10.2 Latvia Soda Ash Technical Material Market Competitive Benchmarking, By Operating and Technical Parameters |
11 Company Profiles |
12 Recommendations |
13 Disclaimer |
Export potential assessment - trade Analytics for 2030
Export potential enables firms to identify high-growth global markets with greater confidence by combining advanced trade intelligence with a structured quantitative methodology. The framework analyzes emerging demand trends and country-level import patterns while integrating macroeconomic and trade datasets such as GDP and population forecasts, bilateral import–export flows, tariff structures, elasticity differentials between developed and developing economies, geographic distance, and import demand projections. Using weighted trade values from 2020–2024 as the base period to project country-to-country export potential for 2030, these inputs are operationalized through calculated drivers such as gravity model parameters, tariff impact factors, and projected GDP per-capita growth. Through an analysis of hidden potentials, demand hotspots, and market conditions that are most favorable to success, this method enables firms to focus on target countries, maximize returns, and global expansion with data, backed by accuracy.
By factoring in the projected importer demand gap that is currently unmet and could be potential opportunity, it identifies the potential for the Exporter (Country) among 190 countries, against the general trade analysis, which identifies the biggest importer or exporter.
To discover high-growth global markets and optimize your business strategy:
Click Here
Pricing
- Single User License$ 1,995
- Department License$ 2,400
- Site License$ 3,120
- Global License$ 3,795

Search
Thought Leadership and Analyst Meet


Our Clients
Latest Reports
- Canada Cloud CFD Market (2026-2032) | Size & Revenue, Industry, Growth, Competitive Landscape, Forecast, Segmentation, Value, Outlook, Trends, Share, Analysis, Companies
- Taiwan Food Delivery Platform Market (2026-2032) | Companies, Outlook, Analysis, Trends, Value, Revenue, Segmentation, Share, Forecast, Competitive Landscape, Growth, Size & Forecast
- United Kingdom (UK) Long-term Care Insurance Market (2026-2032) | Growth, Share, Consumer Insights, Drivers, Opportunities, Competition, Pricing Analysis, Segments, Restraints, Companies, Competitive, Value, Outlook, Size, Demand, Analysis, Challenges, Strategic Insights, Investment Trends, Revenue, Trends, Supply, Forecast
- United Kingdom (UK) Long Term Care Market (2026-2032) | Companies, Outlook, Analysis, Trends, Value, Revenue, Segmentation, Share, Forecast, Competitive Landscape, Growth, Size & Forecast
- Iraq Insulation and Waterproofing Market (2026-2032) | Outlook, Drivers, Growth, Size, Share, Industry, Revenue, Trends, Demand, Competitive, Strategic Insights, Opportunities, Segments, Companies, Challenges, Strategy, Consumer Insights, Analysis, Investment Trends, Value, Segmentation, Forecast, Restraints
- India Switchgear Market Outlook (2026-2032) | Size, Share, Trends, Growth, Revenue, Forecast, Analysis, Value, Outlook
- Pakistan Contraceptive Implants Market (2025-2031) | Demand, Growth, Size, Share, Industry, Pricing Analysis, Competitive, Strategic Insights, Strategy, Consumer Insights, Analysis, Investment Trends, Opportunities, Revenue, Segments, Value, Segmentation, Supply, Forecast, Restraints, Outlook, Competition, Drivers, Trends, Companies, Challenges
- Sri Lanka Packaging Market (2026-2032) | Outlook, Competition, Drivers, Trends, Demand, Pricing Analysis, Competitive, Strategic Insights, Companies, Challenges, Strategy, Consumer Insights, Analysis, Investment Trends, Opportunities, Growth, Size, Share, Industry, Revenue, Segments, Value, Segmentation, Supply, Forecast, Restraints
- India Kids Watches Market (2026-2032) | Strategy, Consumer Insights, Analysis, Investment Trends, Opportunities, Growth, Size, Share, Industry, Revenue, Segments, Value, Segmentation, Supply, Forecast, Restraints, Outlook, Competition, Drivers, Trends, Demand, Pricing Analysis, Competitive, Strategic Insights, Companies, Challenges
- Saudi Arabia Core Assurance Service Market (2025-2031) | Strategy, Consumer Insights, Analysis, Investment Trends, Opportunities, Growth, Size, Share, Industry, Revenue, Segments, Value, Segmentation, Supply, Forecast, Restraints, Outlook, Competition, Drivers, Trends, Demand, Pricing Analysis, Competitive, Strategic Insights, Companies, Challenges
Industry Events and Analyst Meet

India EV Show 2026

EV tech India Expo 2026

Auto Tech Asia 2026

Battery Tech India 2026

Smart Production Solutions Guangzhou 2026
Whitepaper
- Middle East & Africa Commercial Security Market Click here to view more.
- Middle East & Africa Fire Safety Systems & Equipment Market Click here to view more.
- GCC Drone Market Click here to view more.
- Middle East Lighting Fixture Market Click here to view more.
- GCC Physical & Perimeter Security Market Click here to view more.
6WResearch In News
- Doha a strategic location for EV manufacturing hub: IPA Qatar
- Demand for luxury TVs surging in the GCC, says Samsung
- Empowering Growth: The Thriving Journey of Bangladesh’s Cable Industry
- Demand for luxury TVs surging in the GCC, says Samsung
- Video call with a traditional healer? Once unthinkable, it’s now common in South Africa
- Intelligent Buildings To Smooth GCC’s Path To Net Zero