Lebanon Fire Protection Material Market (2026-2032) | Industry, Forecast, Size, Outlook, Analysis, Growth, Share, Companies, Revenue, Value & Trends
Market Forecast By Type (Sealants, Mortar, Putty, Spray, Sheets/Boards, Others), By Application Type (Residential, Commercial, Industrial), By Elevator Technology (Traction & Machine Room Less Traction, Hydraulic), By End-User (Residential, Commercial, Institutional, Infrastructural, Others) And Competitive Landscape
| Product Code: ETC005767 | Publication Date: Sep 2020 | Updated Date: Jun 2026 | Product Type: Report | |
| Publisher: 6Wresearch | Author: Ravi Bhandari | No. of Pages: 70 | No. of Figures: 35 | No. of Tables: 5 |
Lebanon Fire Protection Material Market Summary
The lebanon fire protection material market was estimated at USD 198 Million in 2025 and is projected to reach USD 266 Million by 2032, growing at a CAGR of 5.2% from 2026 to 2032.
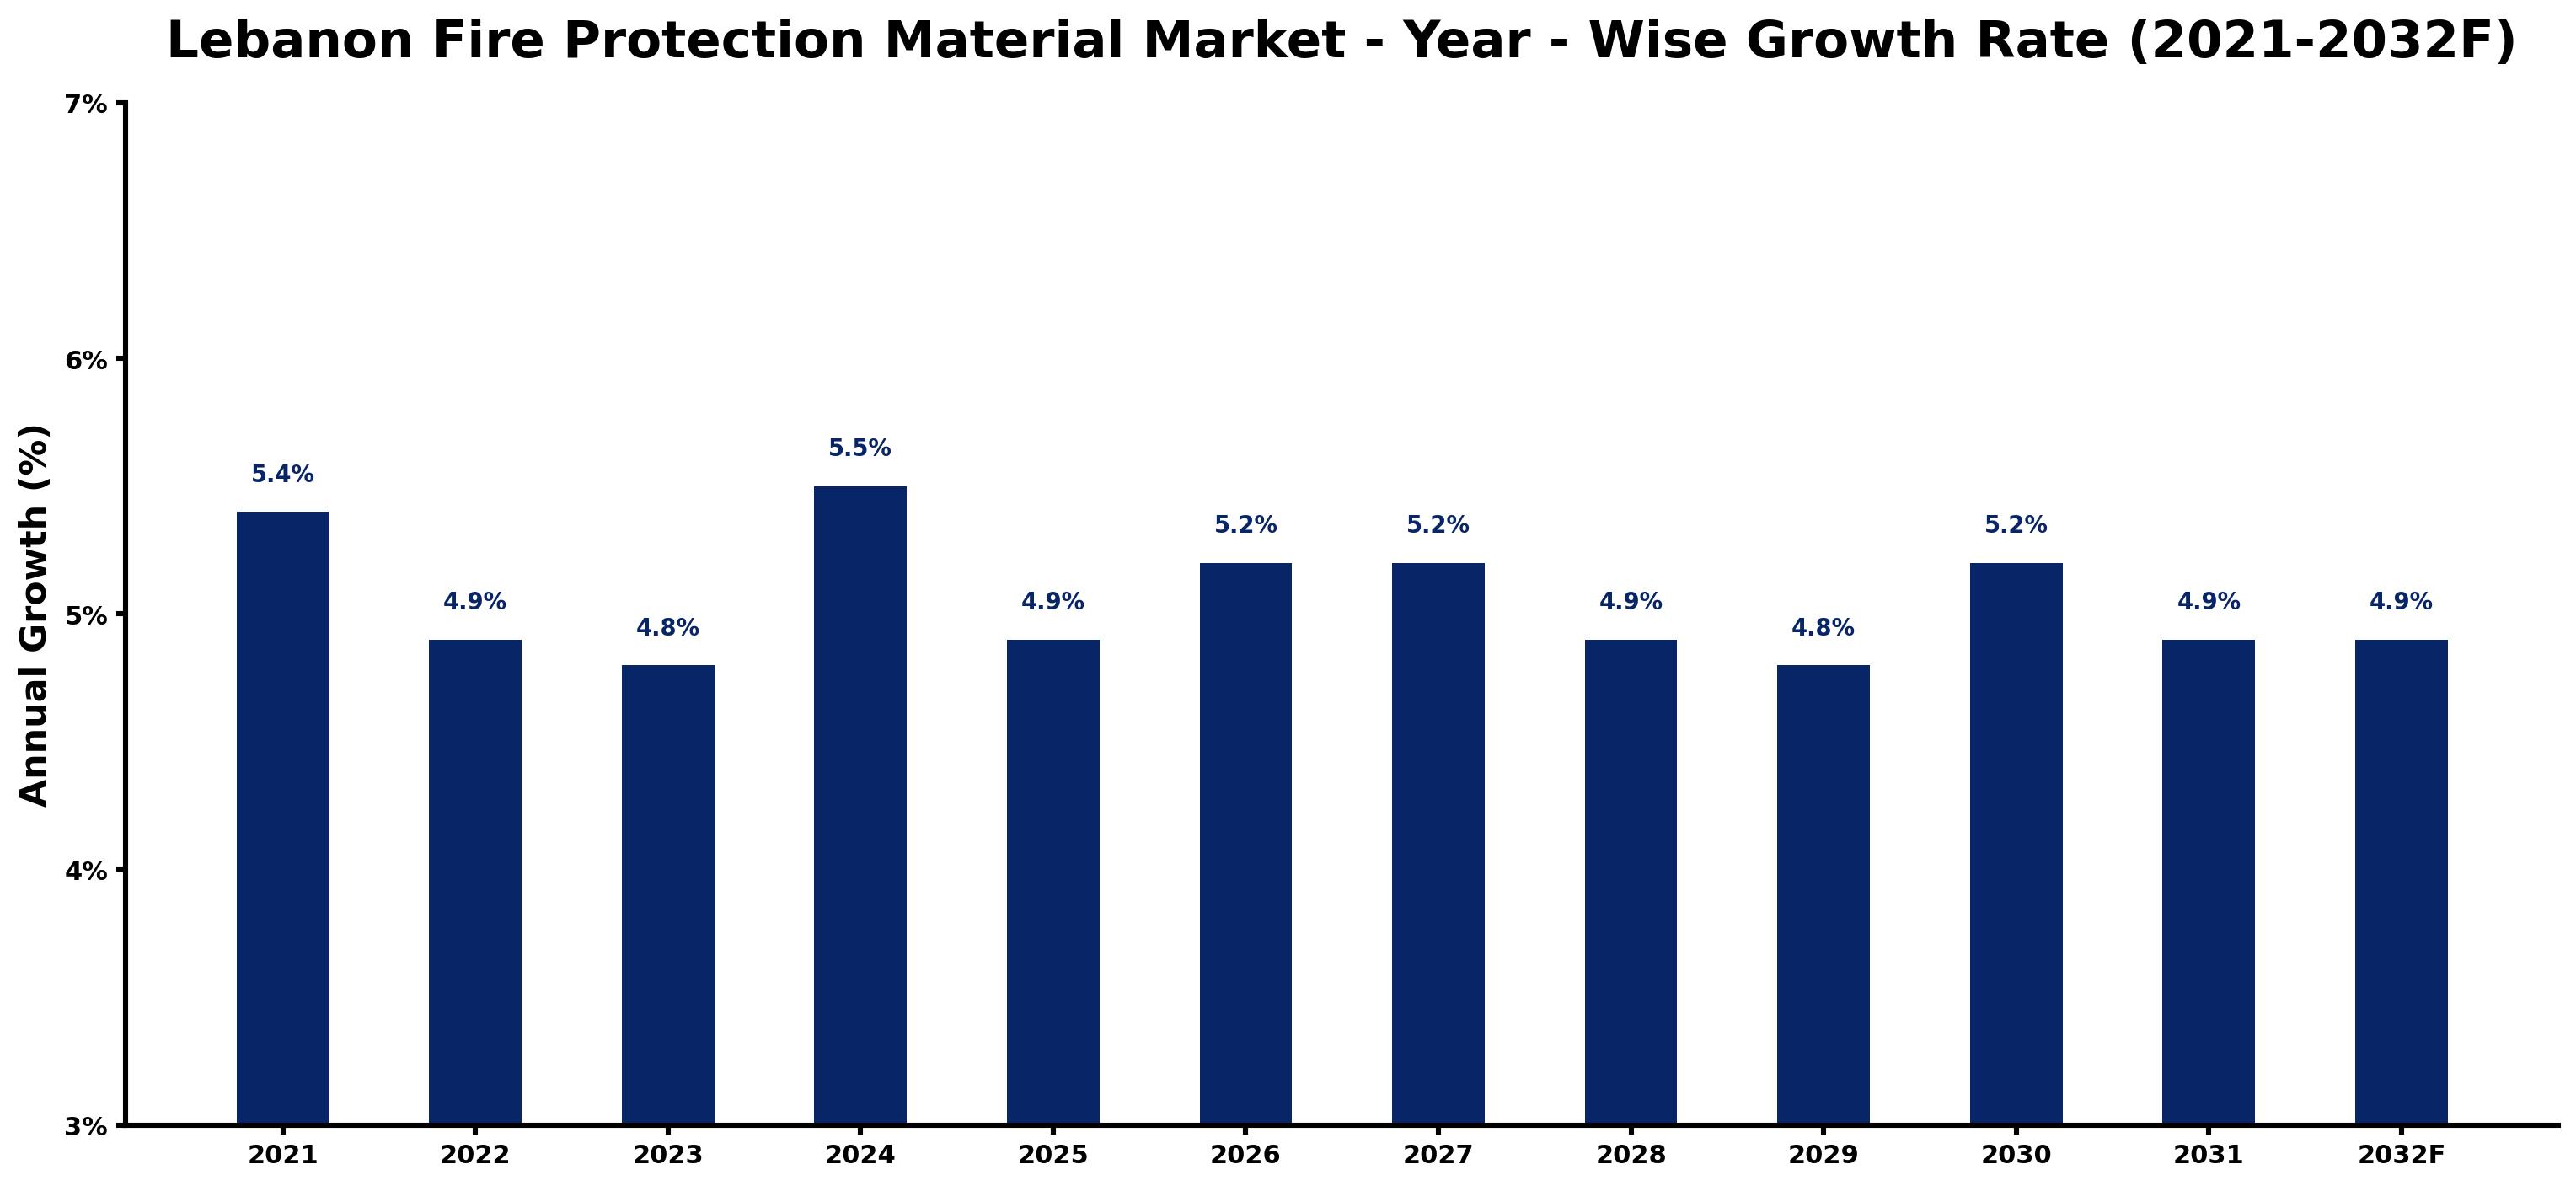
Lebanon Fire Protection Material Market Growth Rate Analysis (2021-2032)
The Lebanon Fire Protection Material Market has exhibited a stable growth pattern over the past few years. In 2021, the market grew by 5.4%, driven by heightened awareness of fire safety regulations and infrastructure development efforts. However, growth slowed slightly to 4.9% in 2022 and fell to 4.8% in 2023, partially due to economic uncertainty and supply chain challenges. Looking ahead, a rebound is anticipated with a projected growth of 5.5% in 2024, fueled by investments in modern technologies and increased consumer demand for advanced fire safety solutions. This steady upward trajectory is likely to continue, with annual growth rates stabilizing around 5% through 2032, underscoring a robust commitment to enhancing fire safety standards in Lebanon.
Lebanon Fire Protection Material Market Year-wise Growth Rate and Key Drivers
This graph highlights how the Lebanon Fire Protection Material Market has steadily grown over the past five years, supported by major growth factors.
The table below presents the year wise growth rates along with the key drivers influencing the market
| Year | Growth Rate | Major Drivers |
| 2021 | 5.4% | Post-economic stabilization, construction projects resumed, boosting fire protection material demand. |
| 2022 | 4.9% | Increased urbanization led to higher construction activities requiring advanced fire safety solutions. |
| 2023 | 4.8% | Local manufacturers enhanced product offerings, meeting specific regional fire safety standards. |
| 2024 | 5.5% | Rising awareness of fire safety among businesses spurred investment in protective materials. |
| 2025 | 4.9% | Emerging commercial sectors focused on compliance, driving the need for quality fire materials. |
| 2026 | 5.2% | Collaborations between local firms and international brands improved material technology access. |
| 2027 | 5.2% | Cultural shifts towards safety emphasized the importance of fire protection in homes. |
| 2028 | 4.9% | Integration of smart technologies in fire protection systems attracted new market players. |
| 2029 | 4.8% | Urban infrastructure projects emphasized fire-resistant materials, enhancing overall safety metrics. |
| 2030 | 5.2% | Climate considerations prompted demand for fire materials that withstand extreme conditions. |
| 2031 | 4.9% | Increased insurance requirements urged businesses to invest in comprehensive fire protection solutions. |
| 2032 | 4.9% | Long-term construction plans revealed growing reliance on innovative fire safety technologies. |
Note - Market size estimations and growth projections presented in this report are based on 6Wresearch's advanced forecasting approach, validated with industry datasets as of June 2026.
Key Highlights of the Report:
- Lebanon Fire Protection Material Market Outlook
- Market Size of Lebanon Fire Protection Material Market, 2025
- Forecast of Lebanon Fire Protection Material Market, 2032F
- Historical Data and Forecast of Lebanon Fire Protection Material Revenues & Volume for the Period 2022-2032F
- Lebanon Fire Protection Material Market Trend Evolution
- Lebanon Fire Protection Material Market Drivers and Challenges
- Lebanon Fire Protection Material Price Trends
- Lebanon Fire Protection Material Porter's Five Forces
- Lebanon Fire Protection Material Industry Life Cycle
- Historical Data and Forecast of Lebanon Fire Protection Material Market Revenues & Volume By Type for the Period 2022-2032F
- Historical Data and Forecast of Lebanon Fire Protection Material Market Revenues & Volume By Sealants for the Period 2022-2032F
- Historical Data and Forecast of Lebanon Fire Protection Material Market Revenues & Volume By Mortar for the Period 2022-2032F
- Historical Data and Forecast of Lebanon Fire Protection Material Market Revenues & Volume By Putty for the Period 2022-2032F
- Historical Data and Forecast of Lebanon Fire Protection Material Market Revenues & Volume By Spray for the Period 2022-2032F
- Historical Data and Forecast of Lebanon Fire Protection Material Market Revenues & Volume By Sheets/Boards for the Period 2022-2032F
- Historical Data and Forecast of Lebanon Fire Protection Material Market Revenues & Volume By Others for the Period 2022-2032F
- Historical Data and Forecast of Lebanon Fire Protection Material Market Revenues & Volume By Application Type for the Period 2022-2032F
- Historical Data and Forecast of Lebanon Fire Protection Material Market Revenues & Volume By Residential for the Period 2022-2032F
- Historical Data and Forecast of Lebanon Fire Protection Material Market Revenues & Volume By Commercial for the Period 2022-2032F
- Historical Data and Forecast of Lebanon Fire Protection Material Market Revenues & Volume By Industrial for the Period 2022-2032F
- Historical Data and Forecast of Lebanon Fire Protection Material Market Revenues & Volume By Elevator Technology for the Period 2022-2032F
- Historical Data and Forecast of Lebanon Fire Protection Material Market Revenues & Volume By Traction & Machine Room Less Traction for the Period 2022-2032F
- Historical Data and Forecast of Lebanon Fire Protection Material Market Revenues & Volume By Hydraulic for the Period 2022-2032F
- Historical Data and Forecast of Lebanon Fire Protection Material Market Revenues & Volume By End-User for the Period 2022-2032F
- Historical Data and Forecast of Lebanon Fire Protection Material Market Revenues & Volume By Residential for the Period 2022-2032F
- Historical Data and Forecast of Lebanon Fire Protection Material Market Revenues & Volume By Commercial for the Period 2022-2032F
- Historical Data and Forecast of Lebanon Fire Protection Material Market Revenues & Volume By Institutional for the Period 2022-2032F
- Historical Data and Forecast of Lebanon Fire Protection Material Market Revenues & Volume By Infrastructural for the Period 2022-2032F
- Historical Data and Forecast of Lebanon Fire Protection Material Market Revenues & Volume By Others for the Period 2022-2032F
- Lebanon Fire Protection Material Import Export Trade Statistics
- Market Opportunity Assessment By Type
- Market Opportunity Assessment By Application Type
- Market Opportunity Assessment By Elevator Technology
- Market Opportunity Assessment By End-User
- Lebanon Fire Protection Material Top Companies Market Share
- Lebanon Fire Protection Material Competitive Benchmarking By Technical and Operational Parameters
- Lebanon Fire Protection Material Company Profiles
- Lebanon Fire Protection Material Key Strategic Recommendations
Frequently Asked Questions About the Market Study (FAQs):
6Wresearch actively monitors the Lebanon Fire Protection Material Market and publishes its comprehensive annual report, highlighting emerging trends, growth drivers, revenue analysis, and forecast outlook. Our insights help businesses to make data-backed strategic decisions with ongoing market dynamics. Our analysts track relevent industries related to the Lebanon Fire Protection Material Market, allowing our clients with actionable intelligence and reliable forecasts tailored to emerging regional needs.
Yes, we provide customisation as per your requirements. To learn more, feel free to contact us on sales@6wresearch.com
1 Executive Summary |
2 Introduction |
2.1 Key Highlights of the Report |
2.2 Report Description |
2.3 Market Scope & Segmentation |
2.4 Research Methodology |
2.5 Assumptions |
3 Lebanon Fire Protection Material Market Overview |
3.1 Lebanon Country Macro Economic Indicators |
3.2 Lebanon Fire Protection Material Market Revenues & Volume, 2022 & 2032F |
3.3 Lebanon Fire Protection Material Market - Industry Life Cycle |
3.4 Lebanon Fire Protection Material Market - Porter's Five Forces |
3.5 Lebanon Fire Protection Material Market Revenues & Volume Share, By Type, 2022 & 2032F |
3.6 Lebanon Fire Protection Material Market Revenues & Volume Share, By Application Type, 2022 & 2032F |
3.7 Lebanon Fire Protection Material Market Revenues & Volume Share, By Elevator Technology, 2022 & 2032F |
3.8 Lebanon Fire Protection Material Market Revenues & Volume Share, By End-User, 2022 & 2032F |
4 Lebanon Fire Protection Material Market Dynamics |
4.1 Impact Analysis |
4.2 Market Drivers |
4.3 Market Restraints |
5 Lebanon Fire Protection Material Market Trends |
6 Lebanon Fire Protection Material Market, By Types |
6.1 Lebanon Fire Protection Material Market, By Type |
6.1.1 Overview and Analysis |
6.1.2 Lebanon Fire Protection Material Market Revenues & Volume, By Type, 2022 - 2032F |
6.1.3 Lebanon Fire Protection Material Market Revenues & Volume, By Sealants, 2022 - 2032F |
6.1.4 Lebanon Fire Protection Material Market Revenues & Volume, By Mortar, 2022 - 2032F |
6.1.5 Lebanon Fire Protection Material Market Revenues & Volume, By Putty, 2022 - 2032F |
6.1.6 Lebanon Fire Protection Material Market Revenues & Volume, By Spray, 2022 - 2032F |
6.1.7 Lebanon Fire Protection Material Market Revenues & Volume, By Sheets/Boards, 2022 - 2032F |
6.1.8 Lebanon Fire Protection Material Market Revenues & Volume, By Others, 2022 - 2032F |
6.2 Lebanon Fire Protection Material Market, By Application Type |
6.2.1 Overview and Analysis |
6.2.2 Lebanon Fire Protection Material Market Revenues & Volume, By Residential, 2022 - 2032F |
6.2.3 Lebanon Fire Protection Material Market Revenues & Volume, By Commercial, 2022 - 2032F |
6.2.4 Lebanon Fire Protection Material Market Revenues & Volume, By Industrial, 2022 - 2032F |
6.3 Lebanon Fire Protection Material Market, By Elevator Technology |
6.3.1 Overview and Analysis |
6.3.2 Lebanon Fire Protection Material Market Revenues & Volume, By Traction & Machine Room Less Traction, 2022 - 2032F |
6.3.3 Lebanon Fire Protection Material Market Revenues & Volume, By Hydraulic, 2022 - 2032F |
6.4 Lebanon Fire Protection Material Market, By End-User |
6.4.1 Overview and Analysis |
6.4.2 Lebanon Fire Protection Material Market Revenues & Volume, By Residential, 2022 - 2032F |
6.4.3 Lebanon Fire Protection Material Market Revenues & Volume, By Commercial, 2022 - 2032F |
6.4.4 Lebanon Fire Protection Material Market Revenues & Volume, By Institutional, 2022 - 2032F |
6.4.5 Lebanon Fire Protection Material Market Revenues & Volume, By Infrastructural, 2022 - 2032F |
6.4.6 Lebanon Fire Protection Material Market Revenues & Volume, By Others, 2022 - 2032F |
7 Lebanon Fire Protection Material Market Import-Export Trade Statistics |
7.1 Lebanon Fire Protection Material Market Export to Major Countries |
7.2 Lebanon Fire Protection Material Market Imports from Major Countries |
8 Lebanon Fire Protection Material Market Key Performance Indicators |
9 Lebanon Fire Protection Material Market - Opportunity Assessment |
9.1 Lebanon Fire Protection Material Market Opportunity Assessment, By Type, 2022 & 2032F |
9.2 Lebanon Fire Protection Material Market Opportunity Assessment, By Application Type, 2022 & 2032F |
9.3 Lebanon Fire Protection Material Market Opportunity Assessment, By Elevator Technology, 2022 & 2032F |
9.4 Lebanon Fire Protection Material Market Opportunity Assessment, By End-User, 2022 & 2032F |
10 Lebanon Fire Protection Material Market - Competitive Landscape |
10.1 Lebanon Fire Protection Material Market Revenue Share, By Companies, 2025 |
10.2 Lebanon Fire Protection Material Market Competitive Benchmarking, By Operating and Technical Parameters |
11 Company Profiles |
12 Recommendations |
13 Disclaimer |
Global Go To Market Strategy - 2030
Export potential enables firms to identify high-growth global markets with greater confidence by combining advanced trade intelligence with a structured quantitative methodology. The framework analyzes emerging demand trends and country-level import patterns while integrating macroeconomic and trade datasets such as GDP and population forecasts, bilateral import–export flows, tariff structures, elasticity differentials between developed and developing economies, geographic distance, and import demand projections. Using weighted trade values from 2020–2024 as the base period to project country-to-country export potential for 2030, these inputs are operationalized through calculated drivers such as gravity model parameters, tariff impact factors, and projected GDP per-capita growth. Through an analysis of hidden potentials, demand hotspots, and market conditions that are most favorable to success, this method enables firms to focus on target countries, maximize returns, and global expansion with data, backed by accuracy.
By factoring in the projected importer demand gap that is currently unmet and could be potential opportunity, it identifies the potential for the Exporter (Country) among 190 countries, against the general trade analysis, which identifies the biggest importer or exporter.
To discover high-growth global markets and optimize your business strategy:
Click Here
Pricing
- Single User License$ 1,995
- Department License$ 2,400
- Site License$ 3,120
- Global License$ 3,795

Leadership Perspectives from Industry Events
Search
Thought Leadership and Analyst Meet


Our Clients
6WResearch In News
- India Air Conditioner Market Set for Strong Rebound in 2026 After Weather-Led Correction and GST-Driven Recovery: 6Wresearch
- ADAS in India: How Automatic Emergency Braking, Blind Spot Detection & Driver Monitoring are Transforming Road Safety
- Doha a strategic location for EV manufacturing hub: IPA Qatar
- Demand for luxury TVs surging in the GCC, says Samsung
- Empowering Growth: The Thriving Journey of Bangladesh’s Cable Industry
- Demand for luxury TVs surging in the GCC, says Samsung
Latest Reports
- Nicaragua RPG Gaming Market (2026-2032)
- New Zealand RPG Gaming Market (2026-2032)
- Netherlands RPG Gaming Market (2026-2032)
- Nauru RPG Gaming Market (2026-2032)
- Namibia RPG Gaming Market (2026-2032)
- Mozambique RPG Gaming Market (2026-2032)
- Montenegro RPG Gaming Market (2026-2032)
- Mongolia RPG Gaming Market (2026-2032)
- Monaco RPG Gaming Market (2026-2032)
- Micronesia RPG Gaming Market (2026-2032)
Industry Events and Analyst Meet

HIMTEX 2026

India Refining Summit 2026

India EV Show 2026

EV tech India Expo 2026

Auto Tech Asia 2026
Whitepaper
- Middle East & Africa Commercial Security Market Click here to view more.
- Middle East & Africa Fire Safety Systems & Equipment Market Click here to view more.
- GCC Drone Market Click here to view more.
- Middle East Lighting Fixture Market Click here to view more.
- GCC Physical & Perimeter Security Market Click here to view more.