Lebanon Zinc Market (2026-2032) | Industry, Forecast, Size, Share, Companies, Revenue, Analysis, Outlook, Trends, Growth & Value
Market Forecast By Applications (Galvanizing, Die casting, Brass and bronze, Others), By End-users (Construction, Transportation, Consumer goods, Others) And Competitive Landscape
| Product Code: ETC007867 | Publication Date: Sep 2020 | Updated Date: Jun 2026 | Product Type: Report | |
| Publisher: 6Wresearch | Author: Ravi Bhandari | No. of Pages: 70 | No. of Figures: 35 | No. of Tables: 5 |
Lebanon Zinc Market Summary
The lebanon zinc market was estimated at USD 243 Million in 2025 and is projected to reach USD 319 Million by 2032, growing at a CAGR of 4.6% from 2026 to 2032.
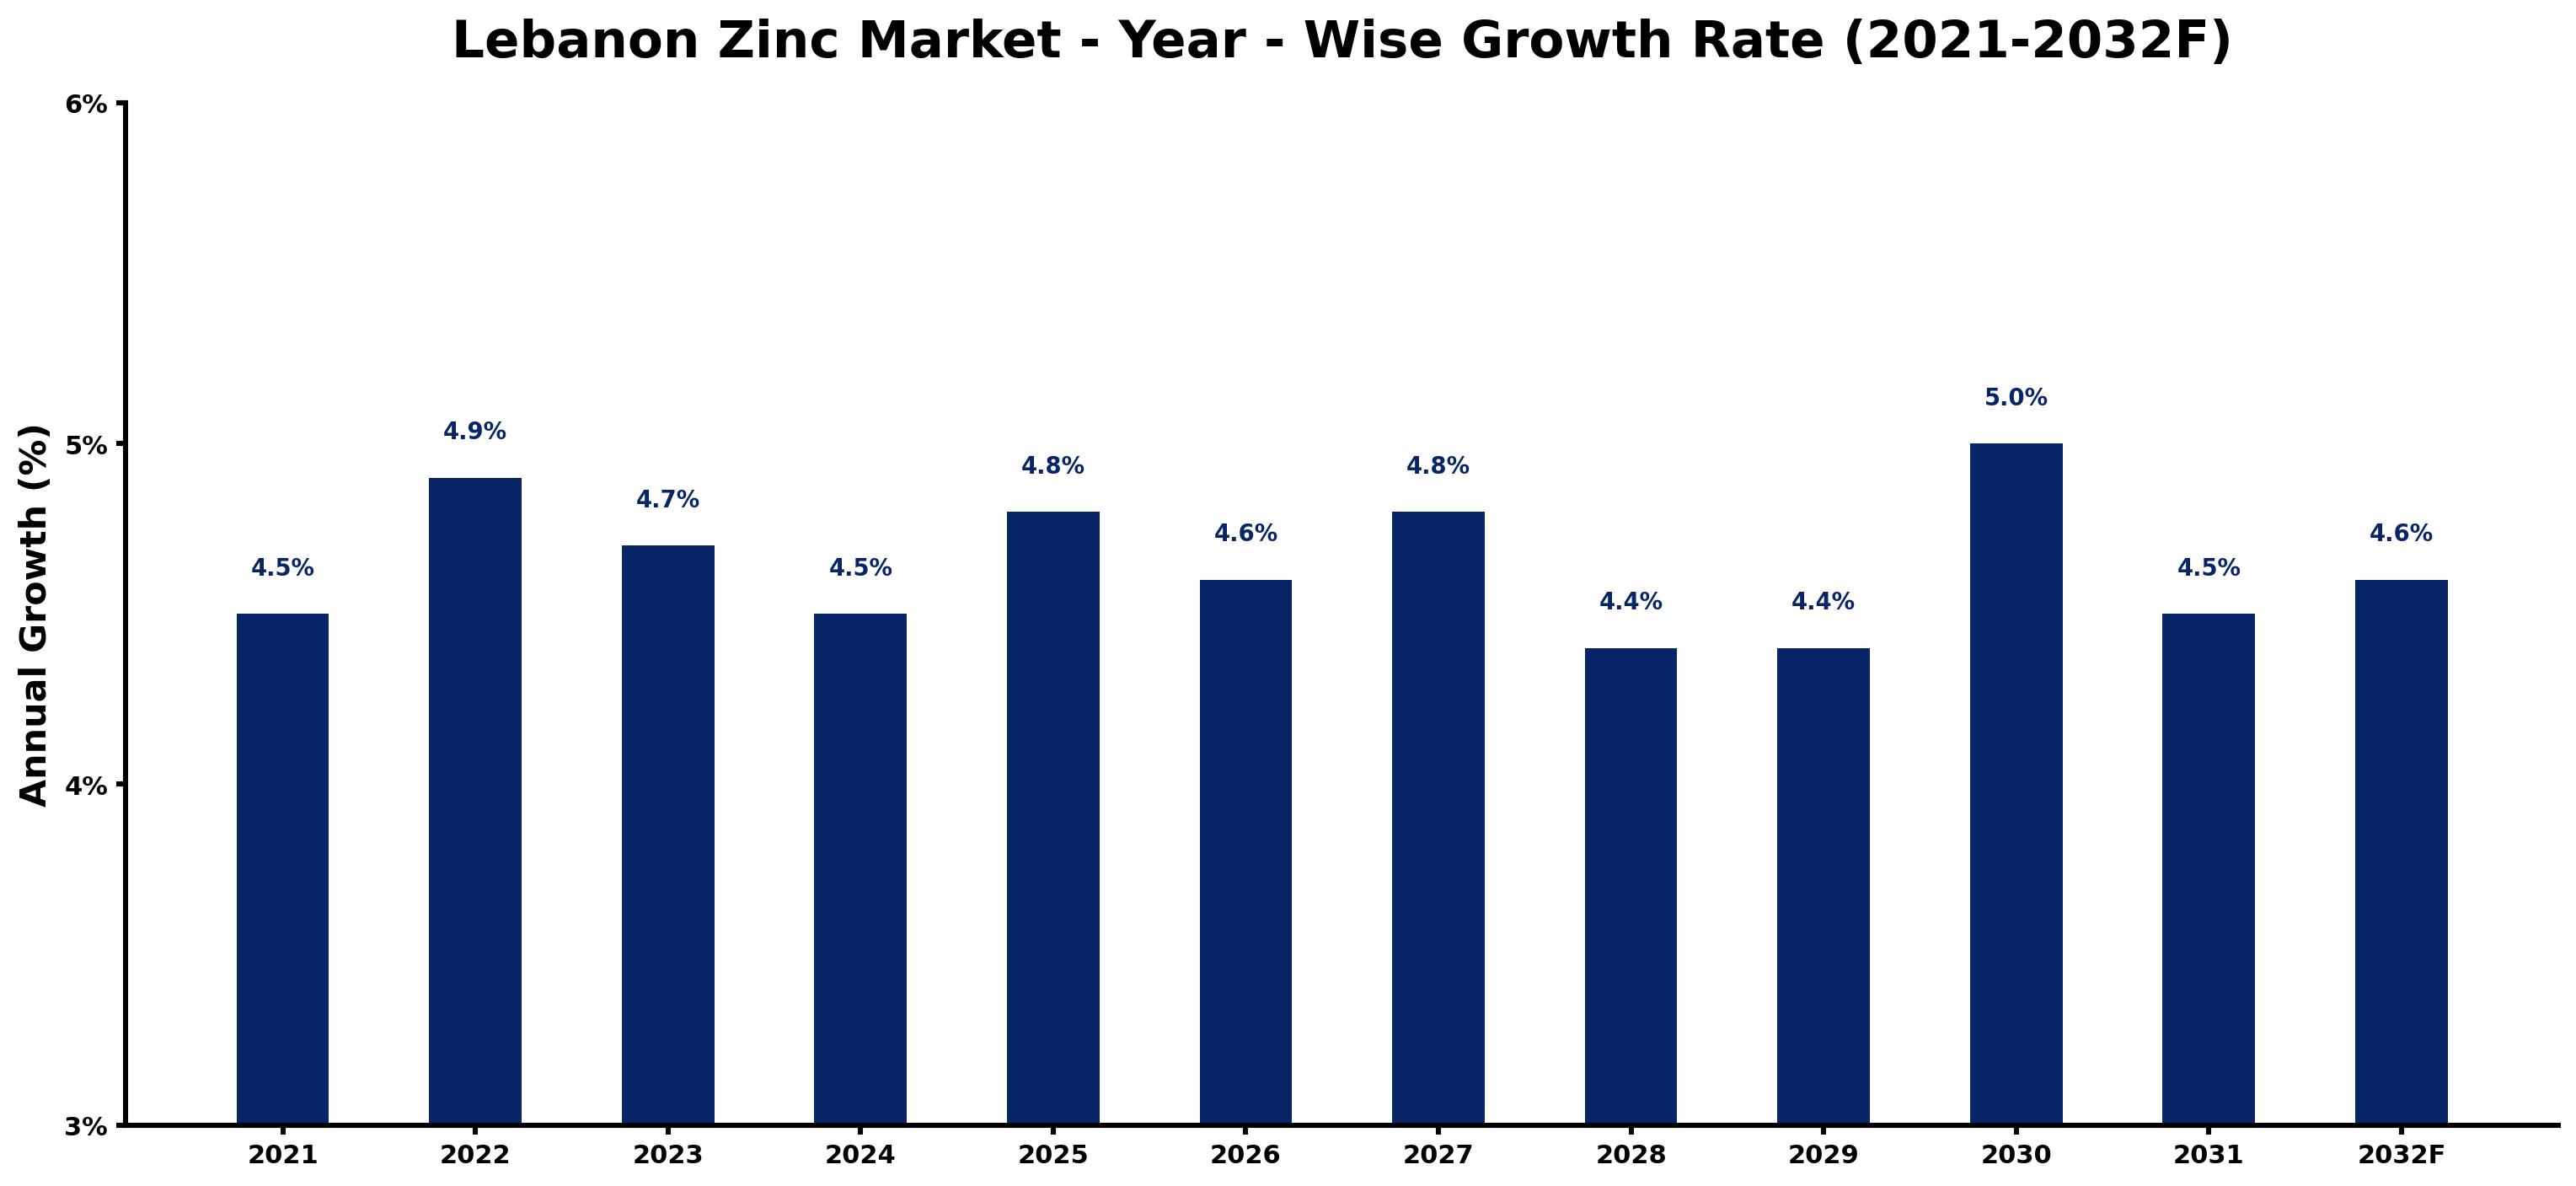
Lebanon Zinc Market Growth Rate Analysis (2021-2032)
The Lebanon Zinc Market has exhibited steady growth over the past few years, with a growth rate of 4.5% in 2021, peaking at 5.0% in 2030. This upward trend can be attributed to increased demand from the construction and automotive sectors, as well as ongoing investments in infrastructure development. In 2022 and 2027, slight fluctuations to 4.9% and 4.8% respectively reflect a robust recovery in consumption patterns, driven by both industrial expansion and energy transition initiatives. The slight dip to 4.4% in 2028 and 2029 appears linked to external economic pressures, yet the market quickly rebounds to 4.6% by 2031, fueled by technological advancements and heightened consumer demand for sustainable materials.
Lebanon Zinc Market Year-wise Growth Rate and Key Drivers
This graph highlights how the Lebanon Zinc Market has steadily grown over the past five years, supported by major growth factors.
The table below presents the year wise growth rates along with the key drivers influencing the market
| Year | Growth Rate | Major Drivers |
| 2021 | 4.5% | Lebanon's infrastructure sector steadily recovers, leading to increased zinc consumption. |
| 2022 | 4.9% | Key construction projects emerge, focusing on sustainable materials and innovative techniques. |
| 2023 | 4.7% | Local manufacturers pivot towards zinc alloys for enhanced durability and performance. |
| 2024 | 4.5% | International partnerships emerge, boosting zinc sourcing and regional trade relationships. |
| 2025 | 4.8% | Technological enhancements in mining optimize zinc extraction and production efficiency. |
| 2026 | 4.6% | Increased focus on renewable energy systems prompts demand for zinc components. |
| 2027 | 4.8% | Lebanon's urbanization trends result in heightened requirements for construction materials. |
| 2028 | 4.4% | Regional reconstruction efforts amplify the need for quality zinc in building projects. |
| 2029 | 4.4% | Emerging automotive sectors start utilizing zinc for corrosion-resistant applications. |
| 2030 | 5.0% | Investment in eco-friendly practices encourages the use of recycled zinc materials. |
| 2031 | 4.5% | Shifts towards green building certifications create additional demand for zinc-based products. |
| 2032 | 4.6% | Lebanon positions itself as a regional zinc hub, attracting global investment opportunities. |
Note - Market size estimations and growth projections presented in this report are based on 6Wresearch's advanced forecasting approach, validated with industry datasets as of June 2026.
Key Highlights of the Report:
- Lebanon Zinc Market Outlook
- Market Size of Lebanon Zinc Market, 2025
- Forecast of Lebanon Zinc Market, 2032F
- Historical Data and Forecast of Lebanon Zinc Revenues & Volume for the Period 2022-2032F
- Lebanon Zinc Market Trend Evolution
- Lebanon Zinc Market Drivers and Challenges
- Lebanon Zinc Price Trends
- Lebanon Zinc Porter's Five Forces
- Lebanon Zinc Industry Life Cycle
- Historical Data and Forecast of Lebanon Zinc Market Revenues & Volume By Applications for the Period 2022-2032F
- Historical Data and Forecast of Lebanon Zinc Market Revenues & Volume By Galvanizing? for the Period 2022-2032F
- Historical Data and Forecast of Lebanon Zinc Market Revenues & Volume By Die casting for the Period 2022-2032F
- Historical Data and Forecast of Lebanon Zinc Market Revenues & Volume By Brass and bronze for the Period 2022-2032F
- Historical Data and Forecast of Lebanon Zinc Market Revenues & Volume By Others? for the Period 2022-2032F
- Historical Data and Forecast of Lebanon Zinc Market Revenues & Volume By End-users for the Period 2022-2032F
- Historical Data and Forecast of Lebanon Zinc Market Revenues & Volume By Construction? for the Period 2022-2032F
- Historical Data and Forecast of Lebanon Zinc Market Revenues & Volume By Transportation? for the Period 2022-2032F
- Historical Data and Forecast of Lebanon Zinc Market Revenues & Volume By Consumer goods for the Period 2022-2032F
- Historical Data and Forecast of Lebanon Zinc Market Revenues & Volume By Others? for the Period 2022-2032F
- Lebanon Zinc Import Export Trade Statistics
- Market Opportunity Assessment By Applications
- Market Opportunity Assessment By End-users
- Lebanon Zinc Top Companies Market Share
- Lebanon Zinc Competitive Benchmarking By Technical and Operational Parameters
- Lebanon Zinc Company Profiles
- Lebanon Zinc Key Strategic Recommendations
Frequently Asked Questions About the Market Study (FAQs):
6Wresearch actively monitors the Lebanon Zinc Market and publishes its comprehensive annual report, highlighting emerging trends, growth drivers, revenue analysis, and forecast outlook. Our insights help businesses to make data-backed strategic decisions with ongoing market dynamics. Our analysts track relevent industries related to the Lebanon Zinc Market, allowing our clients with actionable intelligence and reliable forecasts tailored to emerging regional needs.
Yes, we provide customisation as per your requirements. To learn more, feel free to contact us on sales@6wresearch.com
1 Executive Summary |
2 Introduction |
2.1 Key Highlights of the Report |
2.2 Report Description |
2.3 Market Scope & Segmentation |
2.4 Research Methodology |
2.5 Assumptions |
3 Lebanon Zinc Market Overview |
3.1 Lebanon Country Macro Economic Indicators |
3.2 Lebanon Zinc Market Revenues & Volume, 2022 & 2032F |
3.3 Lebanon Zinc Market - Industry Life Cycle |
3.4 Lebanon Zinc Market - Porter's Five Forces |
3.5 Lebanon Zinc Market Revenues & Volume Share, By Applications, 2022 & 2032F |
3.6 Lebanon Zinc Market Revenues & Volume Share, By End-users, 2022 & 2032F |
4 Lebanon Zinc Market Dynamics |
4.1 Impact Analysis |
4.2 Market Drivers |
4.3 Market Restraints |
5 Lebanon Zinc Market Trends |
6 Lebanon Zinc Market, By Types |
6.1 Lebanon Zinc Market, By Applications |
6.1.1 Overview and Analysis |
6.1.2 Lebanon Zinc Market Revenues & Volume, By Applications, 2022 - 2032F |
6.1.3 Lebanon Zinc Market Revenues & Volume, By Galvanizing , 2022 - 2032F |
6.1.4 Lebanon Zinc Market Revenues & Volume, By Die casting, 2022 - 2032F |
6.1.5 Lebanon Zinc Market Revenues & Volume, By Brass and bronze, 2022 - 2032F |
6.1.6 Lebanon Zinc Market Revenues & Volume, By Others , 2022 - 2032F |
6.2 Lebanon Zinc Market, By End-users |
6.2.1 Overview and Analysis |
6.2.2 Lebanon Zinc Market Revenues & Volume, By Construction , 2022 - 2032F |
6.2.3 Lebanon Zinc Market Revenues & Volume, By Transportation , 2022 - 2032F |
6.2.4 Lebanon Zinc Market Revenues & Volume, By Consumer goods, 2022 - 2032F |
6.2.5 Lebanon Zinc Market Revenues & Volume, By Others , 2022 - 2032F |
7 Lebanon Zinc Market Import-Export Trade Statistics |
7.1 Lebanon Zinc Market Export to Major Countries |
7.2 Lebanon Zinc Market Imports from Major Countries |
8 Lebanon Zinc Market Key Performance Indicators |
9 Lebanon Zinc Market - Opportunity Assessment |
9.1 Lebanon Zinc Market Opportunity Assessment, By Applications, 2022 & 2032F |
9.2 Lebanon Zinc Market Opportunity Assessment, By End-users, 2022 & 2032F |
10 Lebanon Zinc Market - Competitive Landscape |
10.1 Lebanon Zinc Market Revenue Share, By Companies, 2025 |
10.2 Lebanon Zinc Market Competitive Benchmarking, By Operating and Technical Parameters |
11 Company Profiles |
12 Recommendations |
13 Disclaimer |
Global Go To Market Strategy - 2030
Export potential enables firms to identify high-growth global markets with greater confidence by combining advanced trade intelligence with a structured quantitative methodology. The framework analyzes emerging demand trends and country-level import patterns while integrating macroeconomic and trade datasets such as GDP and population forecasts, bilateral import–export flows, tariff structures, elasticity differentials between developed and developing economies, geographic distance, and import demand projections. Using weighted trade values from 2020–2024 as the base period to project country-to-country export potential for 2030, these inputs are operationalized through calculated drivers such as gravity model parameters, tariff impact factors, and projected GDP per-capita growth. Through an analysis of hidden potentials, demand hotspots, and market conditions that are most favorable to success, this method enables firms to focus on target countries, maximize returns, and global expansion with data, backed by accuracy.
By factoring in the projected importer demand gap that is currently unmet and could be potential opportunity, it identifies the potential for the Exporter (Country) among 190 countries, against the general trade analysis, which identifies the biggest importer or exporter.
To discover high-growth global markets and optimize your business strategy:
Click Here
Pricing
- Single User License$ 1,995
- Department License$ 2,400
- Site License$ 3,120
- Global License$ 3,795

Leadership Perspectives from Industry Events
Search
Thought Leadership and Analyst Meet


Our Clients
6WResearch In News
- India Air Conditioner Market Set for Strong Rebound in 2026 After Weather-Led Correction and GST-Driven Recovery: 6Wresearch
- ADAS in India: How Automatic Emergency Braking, Blind Spot Detection & Driver Monitoring are Transforming Road Safety
- Doha a strategic location for EV manufacturing hub: IPA Qatar
- Demand for luxury TVs surging in the GCC, says Samsung
- Empowering Growth: The Thriving Journey of Bangladesh’s Cable Industry
- Demand for luxury TVs surging in the GCC, says Samsung
Latest Reports
- Nicaragua RPG Gaming Market (2026-2032)
- New Zealand RPG Gaming Market (2026-2032)
- Netherlands RPG Gaming Market (2026-2032)
- Nauru RPG Gaming Market (2026-2032)
- Namibia RPG Gaming Market (2026-2032)
- Mozambique RPG Gaming Market (2026-2032)
- Montenegro RPG Gaming Market (2026-2032)
- Mongolia RPG Gaming Market (2026-2032)
- Monaco RPG Gaming Market (2026-2032)
- Micronesia RPG Gaming Market (2026-2032)
Industry Events and Analyst Meet

HIMTEX 2026

India Refining Summit 2026

India EV Show 2026

EV tech India Expo 2026

Auto Tech Asia 2026
Whitepaper
- Middle East & Africa Commercial Security Market Click here to view more.
- Middle East & Africa Fire Safety Systems & Equipment Market Click here to view more.
- GCC Drone Market Click here to view more.
- Middle East Lighting Fixture Market Click here to view more.
- GCC Physical & Perimeter Security Market Click here to view more.