Lithuania Anti-Block Additives Market (2026-2032) | Value, Investment Trends, Segments, Competition, Pricing Analysis, Consumer Insights, Outlook, Share, Segmentation, Strategy, Challenges, Industry, Companies, Analysis, Growth, Opportunities, Trends, Drivers, Restraints, Competitive, Forecast, Strategic Insights, Size, Demand, Supply, Revenue
Market Forecast By Type (Organic Additives, Inorganic Additives, Polymer-Based, Silica-Based), By Application (Packaging Films, Agricultural Films, Industrial Wraps, Medical Packaging), By End User (Food Packaging, Agriculture, Manufacturing, Healthcare) And Competitive Landscape
| Product Code: ETC10638714 | Publication Date: Apr 2025 | Updated Date: Apr 2026 | Product Type: Market Research Report | |
| Publisher: 6Wresearch | Author: Bhawna Singh | No. of Pages: 65 | No. of Figures: 34 | No. of Tables: 19 |
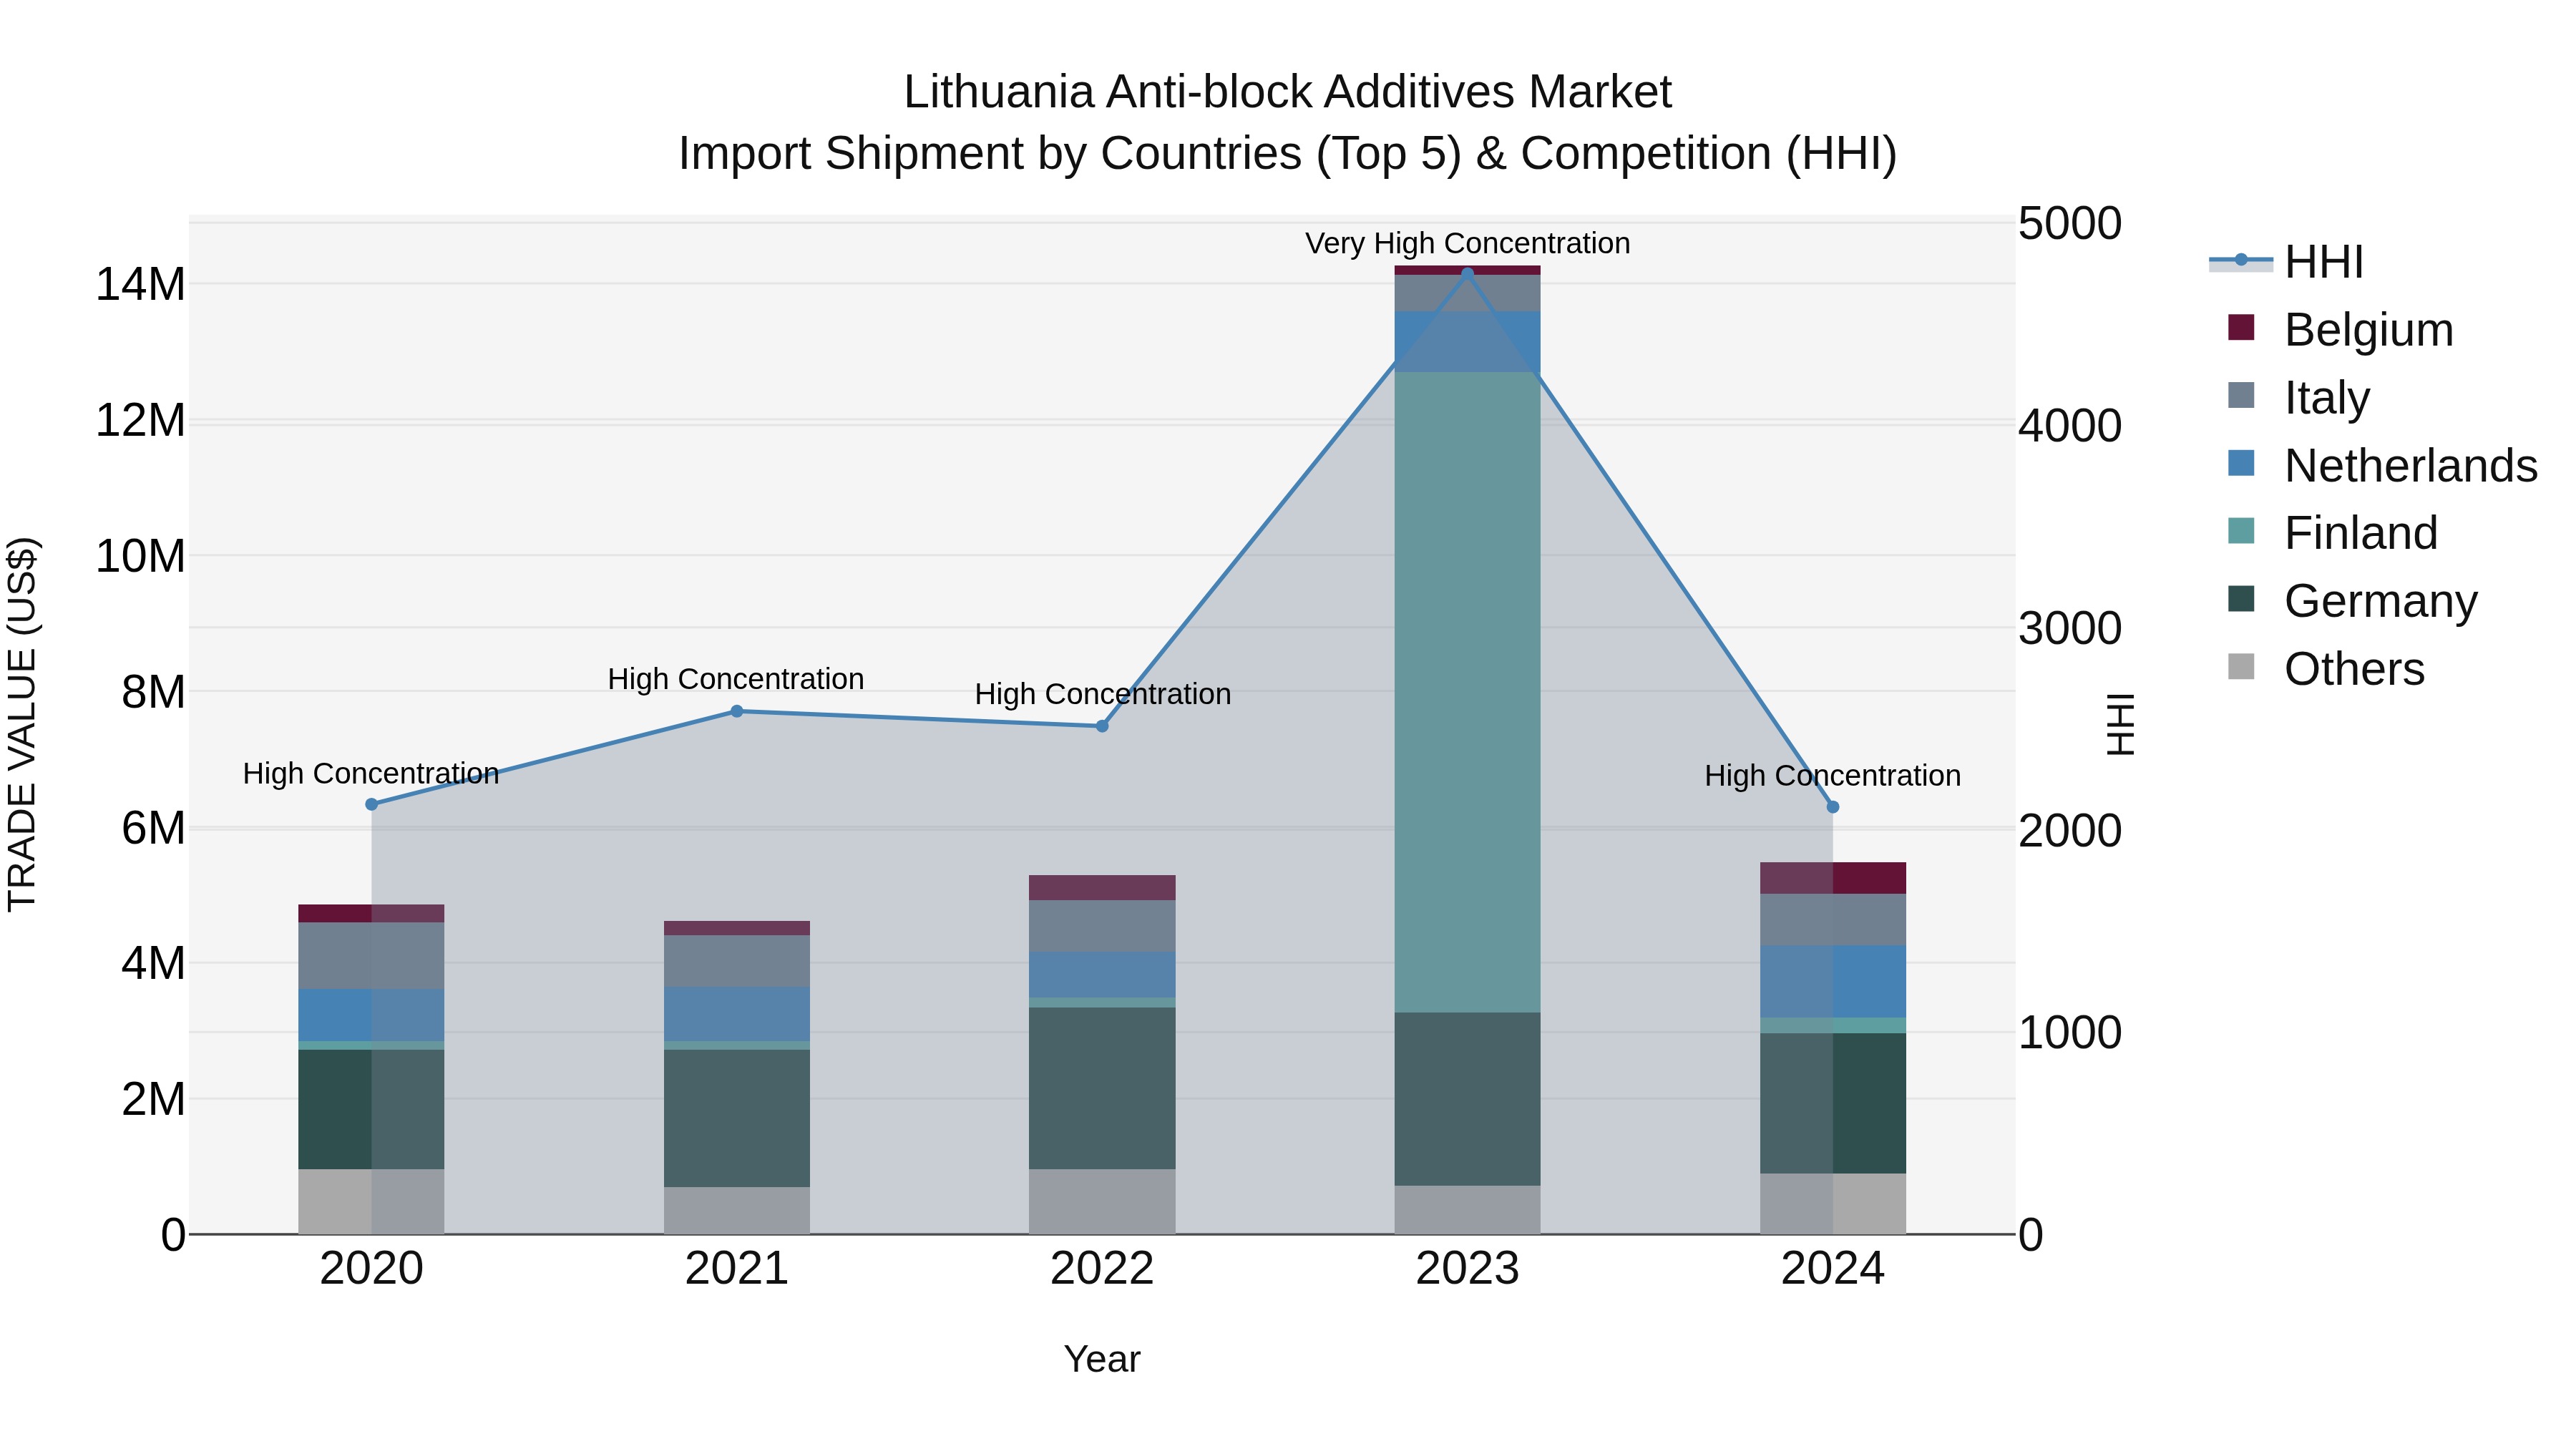
Lithuania Anti-block Additives Market Top 5 Importing Countries and Market Competition (HHI) Analysis
The import shipments of anti-block additives in Lithuania saw a shift in concentration levels from very high in 2023 to high in 2024, indicating a more diversified market. Top exporting countries like Germany, Netherlands, and Italy continue to play a significant role in supplying these additives to Lithuania. However, the negative growth rate in 2024 highlights a challenging year for the industry. With a steady CAGR of 3.06% from 2020 to 2024, there is potential for recovery and further development in the Lithuanian market for anti-block additives.
Key Highlights of the Report:
- Lithuania Anti-Block Additives Market Outlook
- Market Size of Lithuania Anti-Block Additives Market, 2025
- Forecast of Lithuania Anti-Block Additives Market, 2032
- Historical Data and Forecast of Lithuania Anti-Block Additives Revenues & Volume for the Period 2022 - 2032F
- Lithuania Anti-Block Additives Market Trend Evolution
- Lithuania Anti-Block Additives Market Drivers and Challenges
- Lithuania Anti-Block Additives Price Trends
- Lithuania Anti-Block Additives Porter's Five Forces
- Lithuania Anti-Block Additives Industry Life Cycle
- Historical Data and Forecast of Lithuania Anti-Block Additives Market Revenues & Volume By Type for the Period 2022 - 2032F
- Historical Data and Forecast of Lithuania Anti-Block Additives Market Revenues & Volume By Organic Additives for the Period 2022 - 2032F
- Historical Data and Forecast of Lithuania Anti-Block Additives Market Revenues & Volume By Inorganic Additives for the Period 2022 - 2032F
- Historical Data and Forecast of Lithuania Anti-Block Additives Market Revenues & Volume By Polymer-Based for the Period 2022 - 2032F
- Historical Data and Forecast of Lithuania Anti-Block Additives Market Revenues & Volume By Silica-Based for the Period 2022 - 2032F
- Historical Data and Forecast of Lithuania Anti-Block Additives Market Revenues & Volume By Application for the Period 2022 - 2032F
- Historical Data and Forecast of Lithuania Anti-Block Additives Market Revenues & Volume By Packaging Films for the Period 2022 - 2032F
- Historical Data and Forecast of Lithuania Anti-Block Additives Market Revenues & Volume By Agricultural Films for the Period 2022 - 2032F
- Historical Data and Forecast of Lithuania Anti-Block Additives Market Revenues & Volume By Industrial Wraps for the Period 2022 - 2032F
- Historical Data and Forecast of Lithuania Anti-Block Additives Market Revenues & Volume By Medical Packaging for the Period 2022 - 2032F
- Historical Data and Forecast of Lithuania Anti-Block Additives Market Revenues & Volume By End User for the Period 2022 - 2032F
- Historical Data and Forecast of Lithuania Anti-Block Additives Market Revenues & Volume By Food Packaging for the Period 2022 - 2032F
- Historical Data and Forecast of Lithuania Anti-Block Additives Market Revenues & Volume By Agriculture for the Period 2022 - 2032F
- Historical Data and Forecast of Lithuania Anti-Block Additives Market Revenues & Volume By Manufacturing for the Period 2022 - 2032F
- Historical Data and Forecast of Lithuania Anti-Block Additives Market Revenues & Volume By Healthcare for the Period 2022 - 2032F
- Lithuania Anti-Block Additives Import Export Trade Statistics
- Market Opportunity Assessment By Type
- Market Opportunity Assessment By Application
- Market Opportunity Assessment By End User
- Lithuania Anti-Block Additives Top Companies Market Share
- Lithuania Anti-Block Additives Competitive Benchmarking By Technical and Operational Parameters
- Lithuania Anti-Block Additives Company Profiles
- Lithuania Anti-Block Additives Key Strategic Recommendations
Frequently Asked Questions About the Market Study (FAQs):
6Wresearch actively monitors the Lithuania Anti-Block Additives Market and publishes its comprehensive annual report, highlighting emerging trends, growth drivers, revenue analysis, and forecast outlook. Our insights help businesses to make data-backed strategic decisions with ongoing market dynamics. Our analysts track relevent industries related to the Lithuania Anti-Block Additives Market, allowing our clients with actionable intelligence and reliable forecasts tailored to emerging regional needs.
Yes, we provide customisation as per your requirements. To learn more, feel free to contact us on sales@6wresearch.com
1 Executive Summary |
2 Introduction |
2.1 Key Highlights of the Report |
2.2 Report Description |
2.3 Market Scope & Segmentation |
2.4 Research Methodology |
2.5 Assumptions |
3 Lithuania Anti-Block Additives Market Overview |
3.1 Lithuania Country Macro Economic Indicators |
3.2 Lithuania Anti-Block Additives Market Revenues & Volume, 2022 & 2032F |
3.3 Lithuania Anti-Block Additives Market - Industry Life Cycle |
3.4 Lithuania Anti-Block Additives Market - Porter's Five Forces |
3.5 Lithuania Anti-Block Additives Market Revenues & Volume Share, By Type, 2022 & 2032F |
3.6 Lithuania Anti-Block Additives Market Revenues & Volume Share, By Application, 2022 & 2032F |
3.7 Lithuania Anti-Block Additives Market Revenues & Volume Share, By End User, 2022 & 2032F |
4 Lithuania Anti-Block Additives Market Dynamics |
4.1 Impact Analysis |
4.2 Market Drivers |
4.2.1 Increasing demand for anti-block additives in the packaging industry |
4.2.2 Growing awareness about the benefits of anti-block additives in enhancing product quality |
4.2.3 Rising focus on sustainable and eco-friendly additives in manufacturing processes |
4.3 Market Restraints |
4.3.1 Fluctuating prices of raw materials used in anti-block additives production |
4.3.2 Stringent regulations regarding the use of certain chemical additives in Lithuania |
5 Lithuania Anti-Block Additives Market Trends |
6 Lithuania Anti-Block Additives Market, By Types |
6.1 Lithuania Anti-Block Additives Market, By Type |
6.1.1 Overview and Analysis |
6.1.2 Lithuania Anti-Block Additives Market Revenues & Volume, By Type, 2022 - 2032F |
6.1.3 Lithuania Anti-Block Additives Market Revenues & Volume, By Organic Additives, 2022 - 2032F |
6.1.4 Lithuania Anti-Block Additives Market Revenues & Volume, By Inorganic Additives, 2022 - 2032F |
6.1.5 Lithuania Anti-Block Additives Market Revenues & Volume, By Polymer-Based, 2022 - 2032F |
6.1.6 Lithuania Anti-Block Additives Market Revenues & Volume, By Silica-Based, 2022 - 2032F |
6.2 Lithuania Anti-Block Additives Market, By Application |
6.2.1 Overview and Analysis |
6.2.2 Lithuania Anti-Block Additives Market Revenues & Volume, By Packaging Films, 2022 - 2032F |
6.2.3 Lithuania Anti-Block Additives Market Revenues & Volume, By Agricultural Films, 2022 - 2032F |
6.2.4 Lithuania Anti-Block Additives Market Revenues & Volume, By Industrial Wraps, 2022 - 2032F |
6.2.5 Lithuania Anti-Block Additives Market Revenues & Volume, By Medical Packaging, 2022 - 2032F |
6.3 Lithuania Anti-Block Additives Market, By End User |
6.3.1 Overview and Analysis |
6.3.2 Lithuania Anti-Block Additives Market Revenues & Volume, By Food Packaging, 2022 - 2032F |
6.3.3 Lithuania Anti-Block Additives Market Revenues & Volume, By Agriculture, 2022 - 2032F |
6.3.4 Lithuania Anti-Block Additives Market Revenues & Volume, By Manufacturing, 2022 - 2032F |
6.3.5 Lithuania Anti-Block Additives Market Revenues & Volume, By Healthcare, 2022 - 2032F |
7 Lithuania Anti-Block Additives Market Import-Export Trade Statistics |
7.1 Lithuania Anti-Block Additives Market Export to Major Countries |
7.2 Lithuania Anti-Block Additives Market Imports from Major Countries |
8 Lithuania Anti-Block Additives Market Key Performance Indicators |
8.1 Adoption rate of eco-friendly anti-block additives in the market |
8.2 Number of new product developments and innovations in the anti-block additives sector |
8.3 Compliance rate with regulations related to chemical additives in Lithuania |
8.4 Percentage of market players investing in research and development for improving anti-block additives |
9 Lithuania Anti-Block Additives Market - Opportunity Assessment |
9.1 Lithuania Anti-Block Additives Market Opportunity Assessment, By Type, 2022 & 2032F |
9.2 Lithuania Anti-Block Additives Market Opportunity Assessment, By Application, 2022 & 2032F |
9.3 Lithuania Anti-Block Additives Market Opportunity Assessment, By End User, 2022 & 2032F |
10 Lithuania Anti-Block Additives Market - Competitive Landscape |
10.1 Lithuania Anti-Block Additives Market Revenue Share, By Companies, 2025 |
10.2 Lithuania Anti-Block Additives Market Competitive Benchmarking, By Operating and Technical Parameters |
11 Company Profiles |
12 Recommendations |
13 Disclaimer |
Global Go To Market Strategy - 2030
Export potential enables firms to identify high-growth global markets with greater confidence by combining advanced trade intelligence with a structured quantitative methodology. The framework analyzes emerging demand trends and country-level import patterns while integrating macroeconomic and trade datasets such as GDP and population forecasts, bilateral import–export flows, tariff structures, elasticity differentials between developed and developing economies, geographic distance, and import demand projections. Using weighted trade values from 2020–2024 as the base period to project country-to-country export potential for 2030, these inputs are operationalized through calculated drivers such as gravity model parameters, tariff impact factors, and projected GDP per-capita growth. Through an analysis of hidden potentials, demand hotspots, and market conditions that are most favorable to success, this method enables firms to focus on target countries, maximize returns, and global expansion with data, backed by accuracy.
By factoring in the projected importer demand gap that is currently unmet and could be potential opportunity, it identifies the potential for the Exporter (Country) among 190 countries, against the general trade analysis, which identifies the biggest importer or exporter.
To discover high-growth global markets and optimize your business strategy:
Click Here
Pricing
- Single User License$ 1,995
- Department License$ 2,400
- Site License$ 3,120
- Global License$ 3,795

Leadership Perspectives from Industry Events
Search
Thought Leadership and Analyst Meet


Our Clients
6WResearch In News
- Doha a strategic location for EV manufacturing hub: IPA Qatar
- Demand for luxury TVs surging in the GCC, says Samsung
- Empowering Growth: The Thriving Journey of Bangladesh’s Cable Industry
- Demand for luxury TVs surging in the GCC, says Samsung
- Video call with a traditional healer? Once unthinkable, it’s now common in South Africa
- Intelligent Buildings To Smooth GCC’s Path To Net Zero
Latest Reports
- Argentina Pediatric Antibiotics Market (2026-2032)
- Algeria Pediatric Antibiotics Market (2026-2032)
- Ivory Coast Passenger Oxygen Mask System Market (2026-2032)
- Ivory Coast Pain Relief Drugs Market (2026-2032)
- Ivory Coast Outdoor Grill Market (2026-2032)
- Ivory Coast Organic Vegetable Market (2026-2032)
- Ivory Coast Optometry Automation Tools Market (2026-2032)
- Ivory Coast Oncology Treatment Market (2026-2032)
- Ivory Coast Animal Surgical Aftercare Market (2026-2032)
- Ivory Coast ANA Panel Market (2026-2032)
Industry Events and Analyst Meet

HIMTEX 2026

India Refining Summit 2026

India EV Show 2026

EV tech India Expo 2026

Auto Tech Asia 2026
Whitepaper
- Middle East & Africa Commercial Security Market Click here to view more.
- Middle East & Africa Fire Safety Systems & Equipment Market Click here to view more.
- GCC Drone Market Click here to view more.
- Middle East Lighting Fixture Market Click here to view more.
- GCC Physical & Perimeter Security Market Click here to view more.