Lithuania Auto catalyst Market (2025-2031) | Trends, Value, Competitive Landscape, Forecast, Outlook, Size & Revenue, Industry, Companies, Share, Segmentation, Growth, Analysis
Market Forecast By Application (LDV-Diesel, LDV-Gasoline, HDV) And Competitive Landscape
| Product Code: ETC8034701 | Publication Date: Sep 2024 | Updated Date: Apr 2026 | Product Type: Market Research Report | |
| Publisher: 6Wresearch | Author: Summon Dutta | No. of Pages: 75 | No. of Figures: 35 | No. of Tables: 20 |
Lithuania Auto Catalyst Market Size (2020-2030)
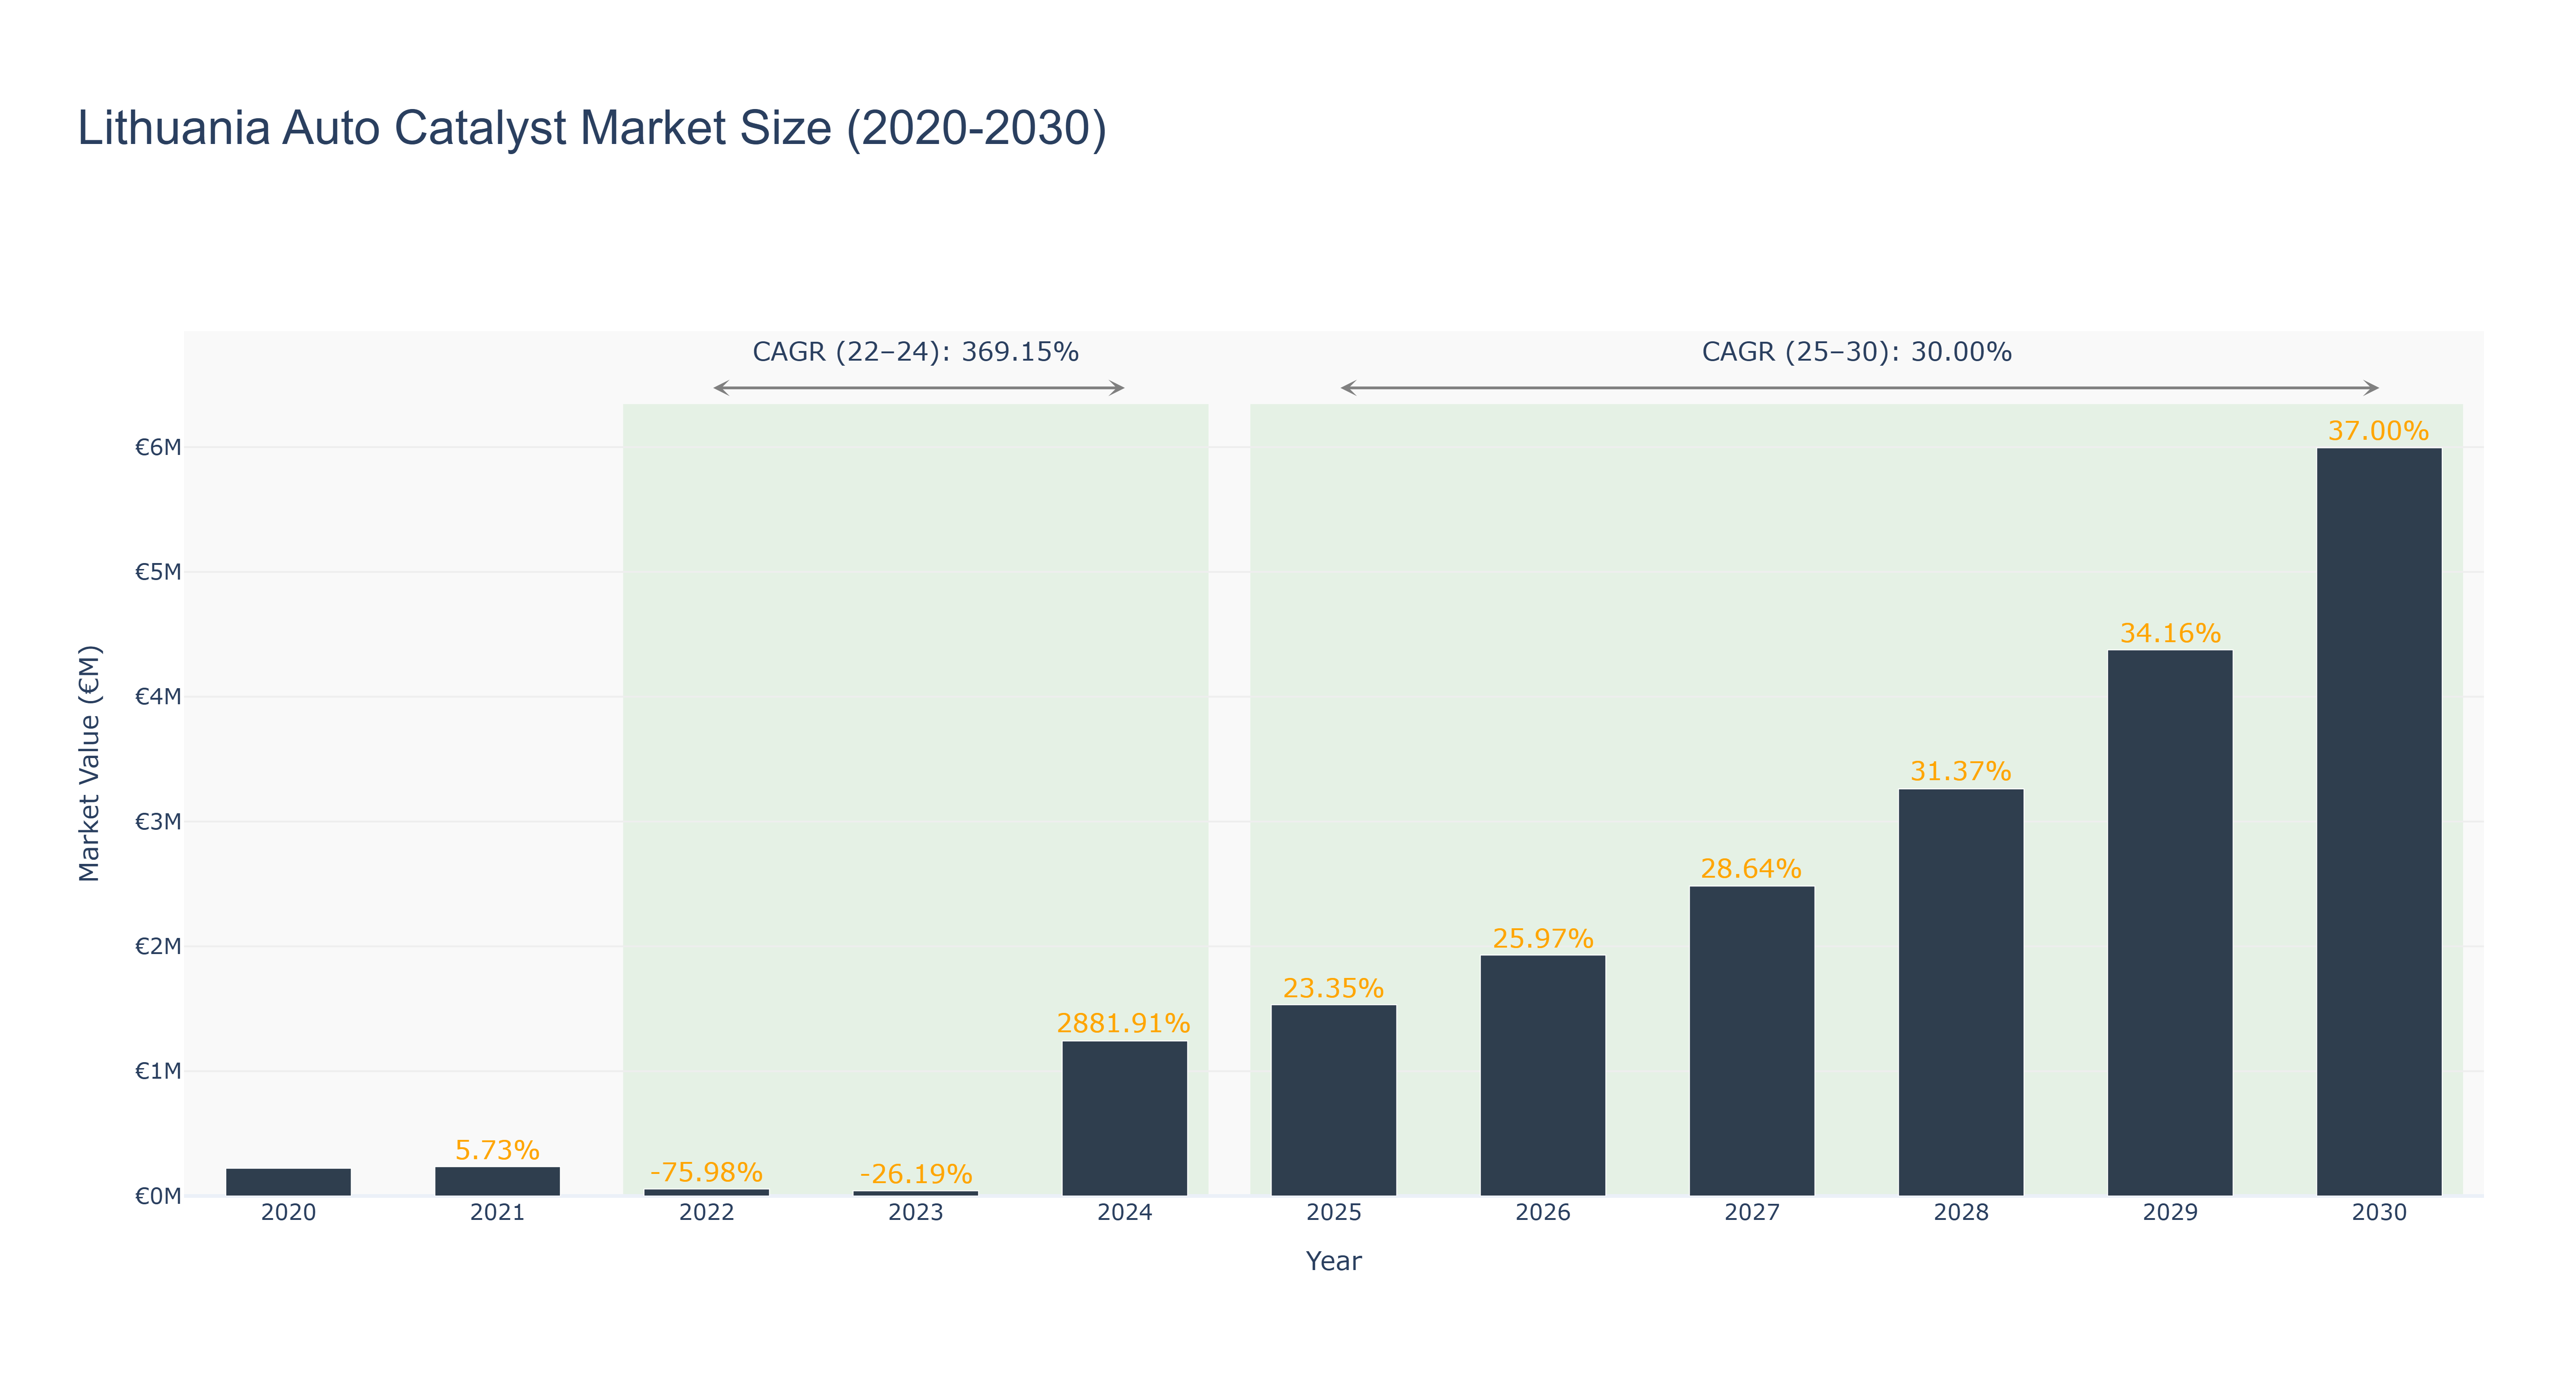
The Lithuania Auto Catalyst Market has shown a remarkable growth trajectory over the past decade. The peak market size of €5.99 million in 2030 reflects a substantial increase from €0.22 million in 2020. The market experienced significant fluctuations, with a notable decline in market size from 2020 to 2022, attributed to economic challenges. However, a rapid recovery and subsequent exponential growth from 2024 onwards can be attributed to increased demand for eco-friendly automotive solutions. The CAGR for the period 2022-24 was an impressive 369.15%, showcasing a strong rebound. Looking ahead, a steady CAGR of 30.0% from 2025 to 2030 is forecasted, driven by ongoing advancements in automotive technology and stringent environmental regulations. Recent developments include collaborations with leading car manufacturers to develop innovative catalyst solutions, positioning Lithuania as a key player in the global auto catalyst market.
Lithuania Auto Catalyst Market: Production & Trade Performance (2019-2025)
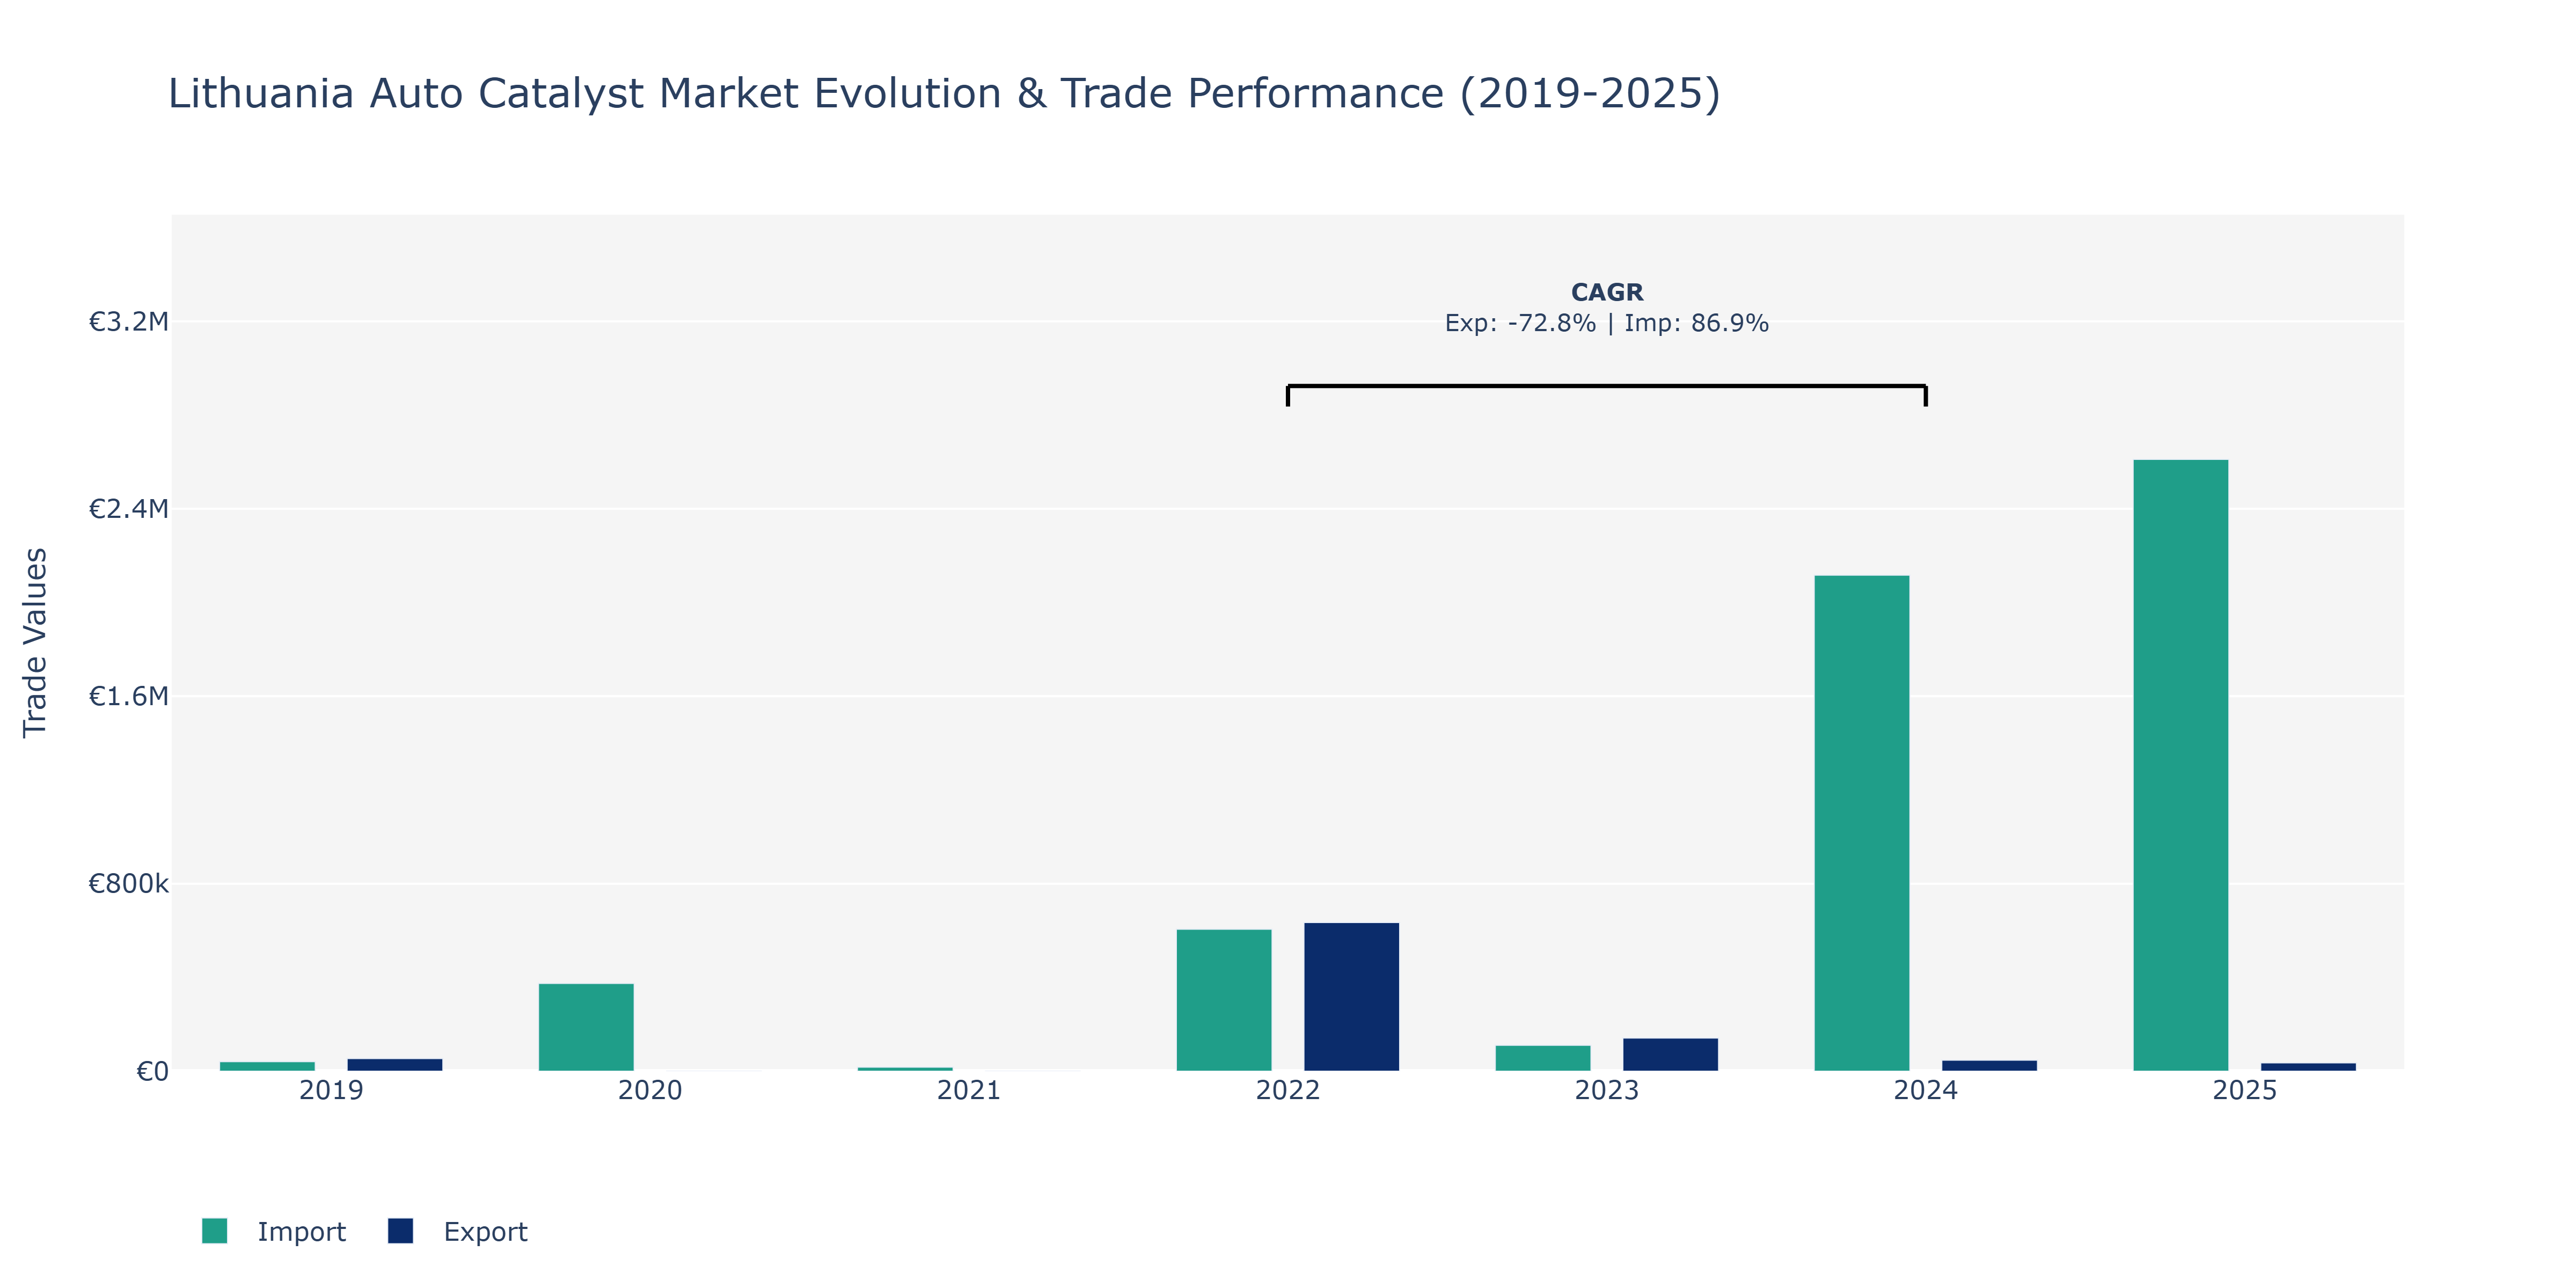
Between 2019 and 2025, Lithuania's Auto Catalyst Market exhibited various trends in Exports and Imports. In 2019, Exports stood at €53.79 thousand, while Imports were €40.61 thousand. In 2020, Imports surged to €374.44 thousand. The year 2021 saw Imports decrease to €17.02 thousand. Subsequently, 2022 marked a substantial rise in Exports to €634.43 thousand and Imports to €605.71 thousand. However, by 2023, Exports dropped to €141.51 thousand, with Imports at €110.31 thousand. In 2024, Exports further decreased to €46.9 thousand, but Imports peaked at €2.12 million. Finally, in 2025, Exports amounted to €35.26 thousand, while Imports slightly declined to €2.61 million. The significant fluctuations in Imports can be attributed to changes in global demand for auto catalysts, affected by emission regulations, technological advancements, and shifts in the automotive industry towards cleaner vehicles. These movements emphasize the market's responsiveness to external factors and the importance of staying abreast of industry developments for strategic decision-making.
Key Highlights of the Report:
- Lithuania Auto catalyst Market Outlook
- Market Size of Lithuania Auto catalyst Market, 2024
- Forecast of Lithuania Auto catalyst Market, 2031
- Historical Data and Forecast of Lithuania Auto catalyst Revenues & Volume for the Period 2021- 2031
- Lithuania Auto catalyst Market Trend Evolution
- Lithuania Auto catalyst Market Drivers and Challenges
- Lithuania Auto catalyst Price Trends
- Lithuania Auto catalyst Porter's Five Forces
- Lithuania Auto catalyst Industry Life Cycle
- Historical Data and Forecast of Lithuania Auto catalyst Market Revenues & Volume By Application for the Period 2021- 2031
- Historical Data and Forecast of Lithuania Auto catalyst Market Revenues & Volume By LDV-Diesel for the Period 2021- 2031
- Historical Data and Forecast of Lithuania Auto catalyst Market Revenues & Volume By LDV-Gasoline for the Period 2021- 2031
- Historical Data and Forecast of Lithuania Auto catalyst Market Revenues & Volume By HDV for the Period 2021- 2031
- Lithuania Auto catalyst Import Export Trade Statistics
- Market Opportunity Assessment By Application
- Lithuania Auto catalyst Top Companies Market Share
- Lithuania Auto catalyst Competitive Benchmarking By Technical and Operational Parameters
- Lithuania Auto catalyst Company Profiles
- Lithuania Auto catalyst Key Strategic Recommendations
Frequently Asked Questions About the Market Study (FAQs):
6Wresearch actively monitors the Lithuania Auto catalyst Market and publishes its comprehensive annual report, highlighting emerging trends, growth drivers, revenue analysis, and forecast outlook. Our insights help businesses to make data-backed strategic decisions with ongoing market dynamics. Our analysts track relevent industries related to the Lithuania Auto catalyst Market, allowing our clients with actionable intelligence and reliable forecasts tailored to emerging regional needs.
Yes, we provide customisation as per your requirements. To learn more, feel free to contact us on sales@6wresearch.com
1 Executive Summary |
2 Introduction |
2.1 Key Highlights of the Report |
2.2 Report Description |
2.3 Market Scope & Segmentation |
2.4 Research Methodology |
2.5 Assumptions |
3 Lithuania Auto catalyst Market Overview |
3.1 Lithuania Country Macro Economic Indicators |
3.2 Lithuania Auto catalyst Market Revenues & Volume, 2021 & 2031F |
3.3 Lithuania Auto catalyst Market - Industry Life Cycle |
3.4 Lithuania Auto catalyst Market - Porter's Five Forces |
3.5 Lithuania Auto catalyst Market Revenues & Volume Share, By Application, 2021 & 2031F |
4 Lithuania Auto catalyst Market Dynamics |
4.1 Impact Analysis |
4.2 Market Drivers |
4.2.1 Stringent emission regulations in Lithuania driving the demand for auto catalysts to reduce harmful pollutants. |
4.2.2 Increasing adoption of electric vehicles leading to a shift towards hybrid and electric vehicle auto catalysts. |
4.2.3 Growing awareness among consumers and industries regarding the importance of environmental sustainability, boosting the demand for auto catalysts. |
4.3 Market Restraints |
4.3.1 Fluctuating prices of precious metals used in auto catalysts impacting the overall cost and profitability. |
4.3.2 Slow adoption rate of advanced auto catalyst technologies due to high initial investment and lack of infrastructure. |
4.3.3 Competition from alternative technologies and solutions for emissions control posing a challenge to the growth of the auto catalyst market. |
5 Lithuania Auto catalyst Market Trends |
6 Lithuania Auto catalyst Market, By Types |
6.1 Lithuania Auto catalyst Market, By Application |
6.1.1 Overview and Analysis |
6.1.2 Lithuania Auto catalyst Market Revenues & Volume, By Application, 2021- 2031F |
6.1.3 Lithuania Auto catalyst Market Revenues & Volume, By LDV-Diesel, 2021- 2031F |
6.1.4 Lithuania Auto catalyst Market Revenues & Volume, By LDV-Gasoline, 2021- 2031F |
6.1.5 Lithuania Auto catalyst Market Revenues & Volume, By HDV, 2021- 2031F |
7 Lithuania Auto catalyst Market Import-Export Trade Statistics |
7.1 Lithuania Auto catalyst Market Export to Major Countries |
7.2 Lithuania Auto catalyst Market Imports from Major Countries |
8 Lithuania Auto catalyst Market Key Performance Indicators |
8.1 Average age of vehicles in Lithuania (as older vehicles may require more frequent replacement of auto catalysts). |
8.2 Number of new vehicle registrations in Lithuania (indicating potential market growth for auto catalysts). |
8.3 Government incentives and policies supporting the adoption of cleaner vehicles (affecting the demand for auto catalysts). |
8.4 Air quality index in major cities of Lithuania (reflecting the effectiveness of auto catalysts in reducing emissions). |
8.5 Recycling rate of precious metals from end-of-life auto catalysts (sustainability aspect of the market). |
9 Lithuania Auto catalyst Market - Opportunity Assessment |
9.1 Lithuania Auto catalyst Market Opportunity Assessment, By Application, 2021 & 2031F |
10 Lithuania Auto catalyst Market - Competitive Landscape |
10.1 Lithuania Auto catalyst Market Revenue Share, By Companies, 2024 |
10.2 Lithuania Auto catalyst Market Competitive Benchmarking, By Operating and Technical Parameters |
11 Company Profiles |
12 Recommendations |
13 Disclaimer |
Export potential assessment - trade Analytics for 2030
Export potential enables firms to identify high-growth global markets with greater confidence by combining advanced trade intelligence with a structured quantitative methodology. The framework analyzes emerging demand trends and country-level import patterns while integrating macroeconomic and trade datasets such as GDP and population forecasts, bilateral import–export flows, tariff structures, elasticity differentials between developed and developing economies, geographic distance, and import demand projections. Using weighted trade values from 2020–2024 as the base period to project country-to-country export potential for 2030, these inputs are operationalized through calculated drivers such as gravity model parameters, tariff impact factors, and projected GDP per-capita growth. Through an analysis of hidden potentials, demand hotspots, and market conditions that are most favorable to success, this method enables firms to focus on target countries, maximize returns, and global expansion with data, backed by accuracy.
By factoring in the projected importer demand gap that is currently unmet and could be potential opportunity, it identifies the potential for the Exporter (Country) among 190 countries, against the general trade analysis, which identifies the biggest importer or exporter.
To discover high-growth global markets and optimize your business strategy:
Click Here
Pricing
- Single User License$ 1,995
- Department License$ 2,400
- Site License$ 3,120
- Global License$ 3,795

Search
Thought Leadership and Analyst Meet


Our Clients
Latest Reports
- Philippines Polyhydroxybutyrate-co-Hydroxyvalerate Market (2026-2032) | Trends, Insights, Challenges, Restraints, Competition, Size, Value, Forecast, Pricing, Share, Outlook, Revenue, Investment Opportunities, Strategy, Drivers, Demand, Growth, segmentation, Analysis, Companies
- Peru Polyhydroxybutyrate-co-Hydroxyvalerate Market (2026-2032) | Growth, Demand, Challenges, Share, Trends, Analysis, Pricing, Investment Opportunities, Drivers, Value, Forecast, Competition, Size, Companies, Insights, Outlook, Restraints, segmentation, Revenue, Strategy
- Pakistan Polyhydroxybutyrate-co-Hydroxyvalerate Market (2026-2032) | Restraints, segmentation, Pricing, Forecast, Share, Strategy, Competition, Trends, Insights, Drivers, Challenges, Growth, Revenue, Outlook, Value, Investment Opportunities, Companies, Size, Analysis, Demand
- Oman Polyhydroxybutyrate-co-Hydroxyvalerate Market (2026-2032) | Drivers, segmentation, Insights, Competition, Pricing, Outlook, Size, Revenue, Challenges, Forecast, Analysis, Growth, Value, Share, Trends, Investment Opportunities, Strategy, Restraints, Companies, Demand
- Nigeria Polyhydroxybutyrate-co-Hydroxyvalerate Market (2026-2032) | Value, Investment Opportunities, Analysis, Revenue, Restraints, Pricing, Outlook, Competition, Demand, Growth, Forecast, Companies, Trends, Challenges, segmentation, Drivers, Insights, Share, Size, Strategy
- Nepal Polyhydroxybutyrate-co-Hydroxyvalerate Market (2026-2032) | Insights, Analysis, Drivers, Share, Revenue, Demand, segmentation, Investment Opportunities, Competition, Forecast, Growth, Pricing, Companies, Strategy, Trends, Restraints, Challenges, Outlook, Size, Value
- Myanmar Polyhydroxybutyrate-co-Hydroxyvalerate Market (2026-2032) | Outlook, Revenue, Strategy, Restraints, Drivers, segmentation, Share, Forecast, Competition, Insights, Growth, Pricing, Size, Demand, Value, Companies, Trends, Challenges, Investment Opportunities, Analysis
- Morocco Polyhydroxybutyrate-co-Hydroxyvalerate Market (2026-2032) | Outlook, Investment Opportunities, Restraints, Strategy, Forecast, Challenges, Drivers, Growth, Companies, segmentation, Trends, Size, Competition, Revenue, Demand, Insights, Share, Analysis, Value, Pricing
- Mexico Polyhydroxybutyrate-co-Hydroxyvalerate Market (2026-2032) | Size, Drivers, Outlook, Share, Strategy, Growth, Pricing, Challenges, Companies, Demand, Value, Investment Opportunities, Restraints, Trends, Forecast, segmentation, Analysis, Insights, Competition, Revenue
- Malaysia Polyhydroxybutyrate-co-Hydroxyvalerate Market (2026-2032) | Share, segmentation, Size, Companies, Analysis, Insights, Forecast, Value, Revenue, Drivers, Restraints, Challenges, Investment Opportunities, Trends, Competition, Strategy, Demand, Growth, Outlook, Pricing
Industry Events and Analyst Meet

HIMTEX 2026

India Refining Summit 2026

India EV Show 2026

EV tech India Expo 2026

Auto Tech Asia 2026
Whitepaper
- Middle East & Africa Commercial Security Market Click here to view more.
- Middle East & Africa Fire Safety Systems & Equipment Market Click here to view more.
- GCC Drone Market Click here to view more.
- Middle East Lighting Fixture Market Click here to view more.
- GCC Physical & Perimeter Security Market Click here to view more.
6WResearch In News
- Doha a strategic location for EV manufacturing hub: IPA Qatar
- Demand for luxury TVs surging in the GCC, says Samsung
- Empowering Growth: The Thriving Journey of Bangladesh’s Cable Industry
- Demand for luxury TVs surging in the GCC, says Samsung
- Video call with a traditional healer? Once unthinkable, it’s now common in South Africa
- Intelligent Buildings To Smooth GCC’s Path To Net Zero