Lithuania Automobile Market (2026-2032) | Forecast, Analysis, Segmentation, Outlook, Value, Industry, Growth, Trends, Companies, Share, Size & Revenue, Competitive Landscape
Market Forecast By Vehicle Type (Passenger Cars, Commercial Vehicles, Two-wheelers, Three-wheelers), By Propulsion (Internal Combustion Engine, Electric Vehicles), By Type (New Vehicles, Used Vehicles) And Competitive Landscape
| Product Code: ETC8034831 | Publication Date: Sep 2024 | Updated Date: Apr 2026 | Product Type: Market Research Report | |
| Publisher: 6Wresearch | Author: Sumit Sagar | No. of Pages: 75 | No. of Figures: 35 | No. of Tables: 20 |
Lithuania Automobile Market Size (2020-2030)
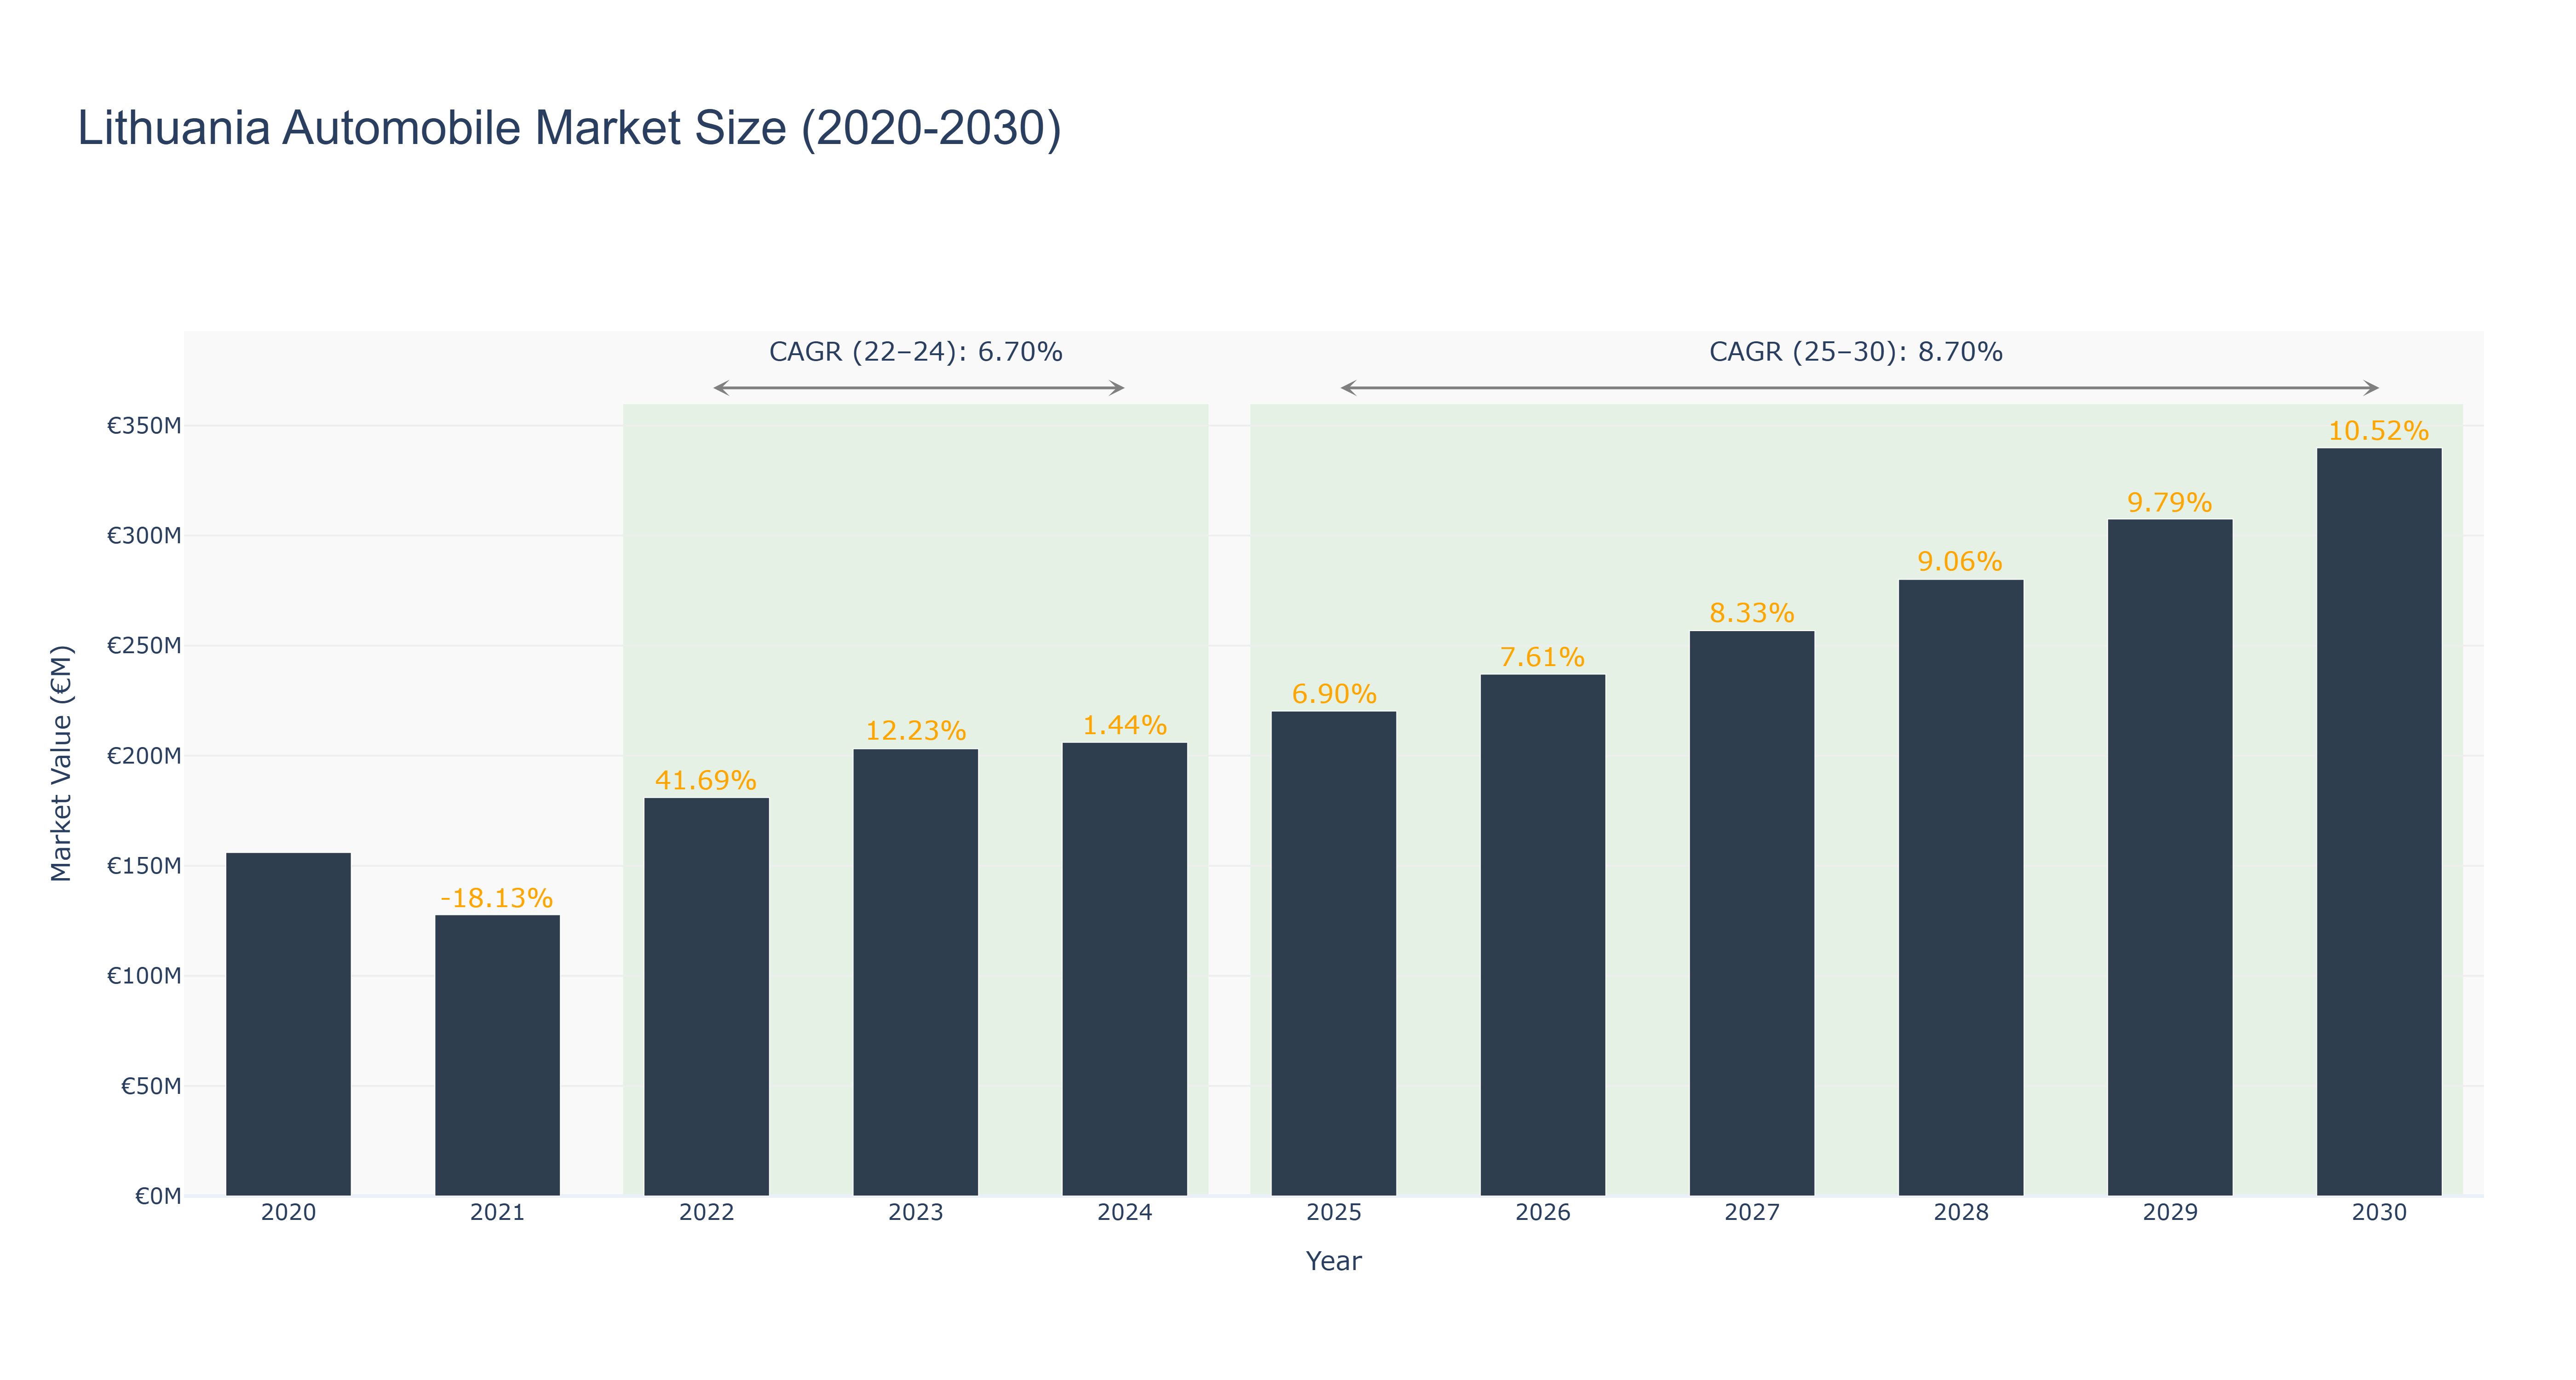
The Lithuania Automobile Market experienced notable fluctuations between 2020 and 2024, with the peak market size recorded in 2022 at €181.02 million, followed by a decline in 2021 to €127.76 million, reflecting a significant growth drop of -18.13%. The market rebounded in 2023 and 2024, achieving sizes of €203.16 million and €206.08 million, respectively, with an actual compound annual growth rate (CAGR) of 6.70% for the period. Looking ahead, the forecasted market from 2025 to 2030 anticipates a more robust growth trajectory, with projected sizes reaching €339.88 million by 2030, supported by a CAGR of 8.70%. Key drivers for this growth include increasing consumer demand for electric vehicles, government incentives for sustainable transportation, and advancements in automotive technology. As Lithuania enhances its infrastructure and embraces green initiatives, the automobile market is poised for sustained expansion.
Lithuania Automobile Market: Production & Trade Performance (2019-2025)
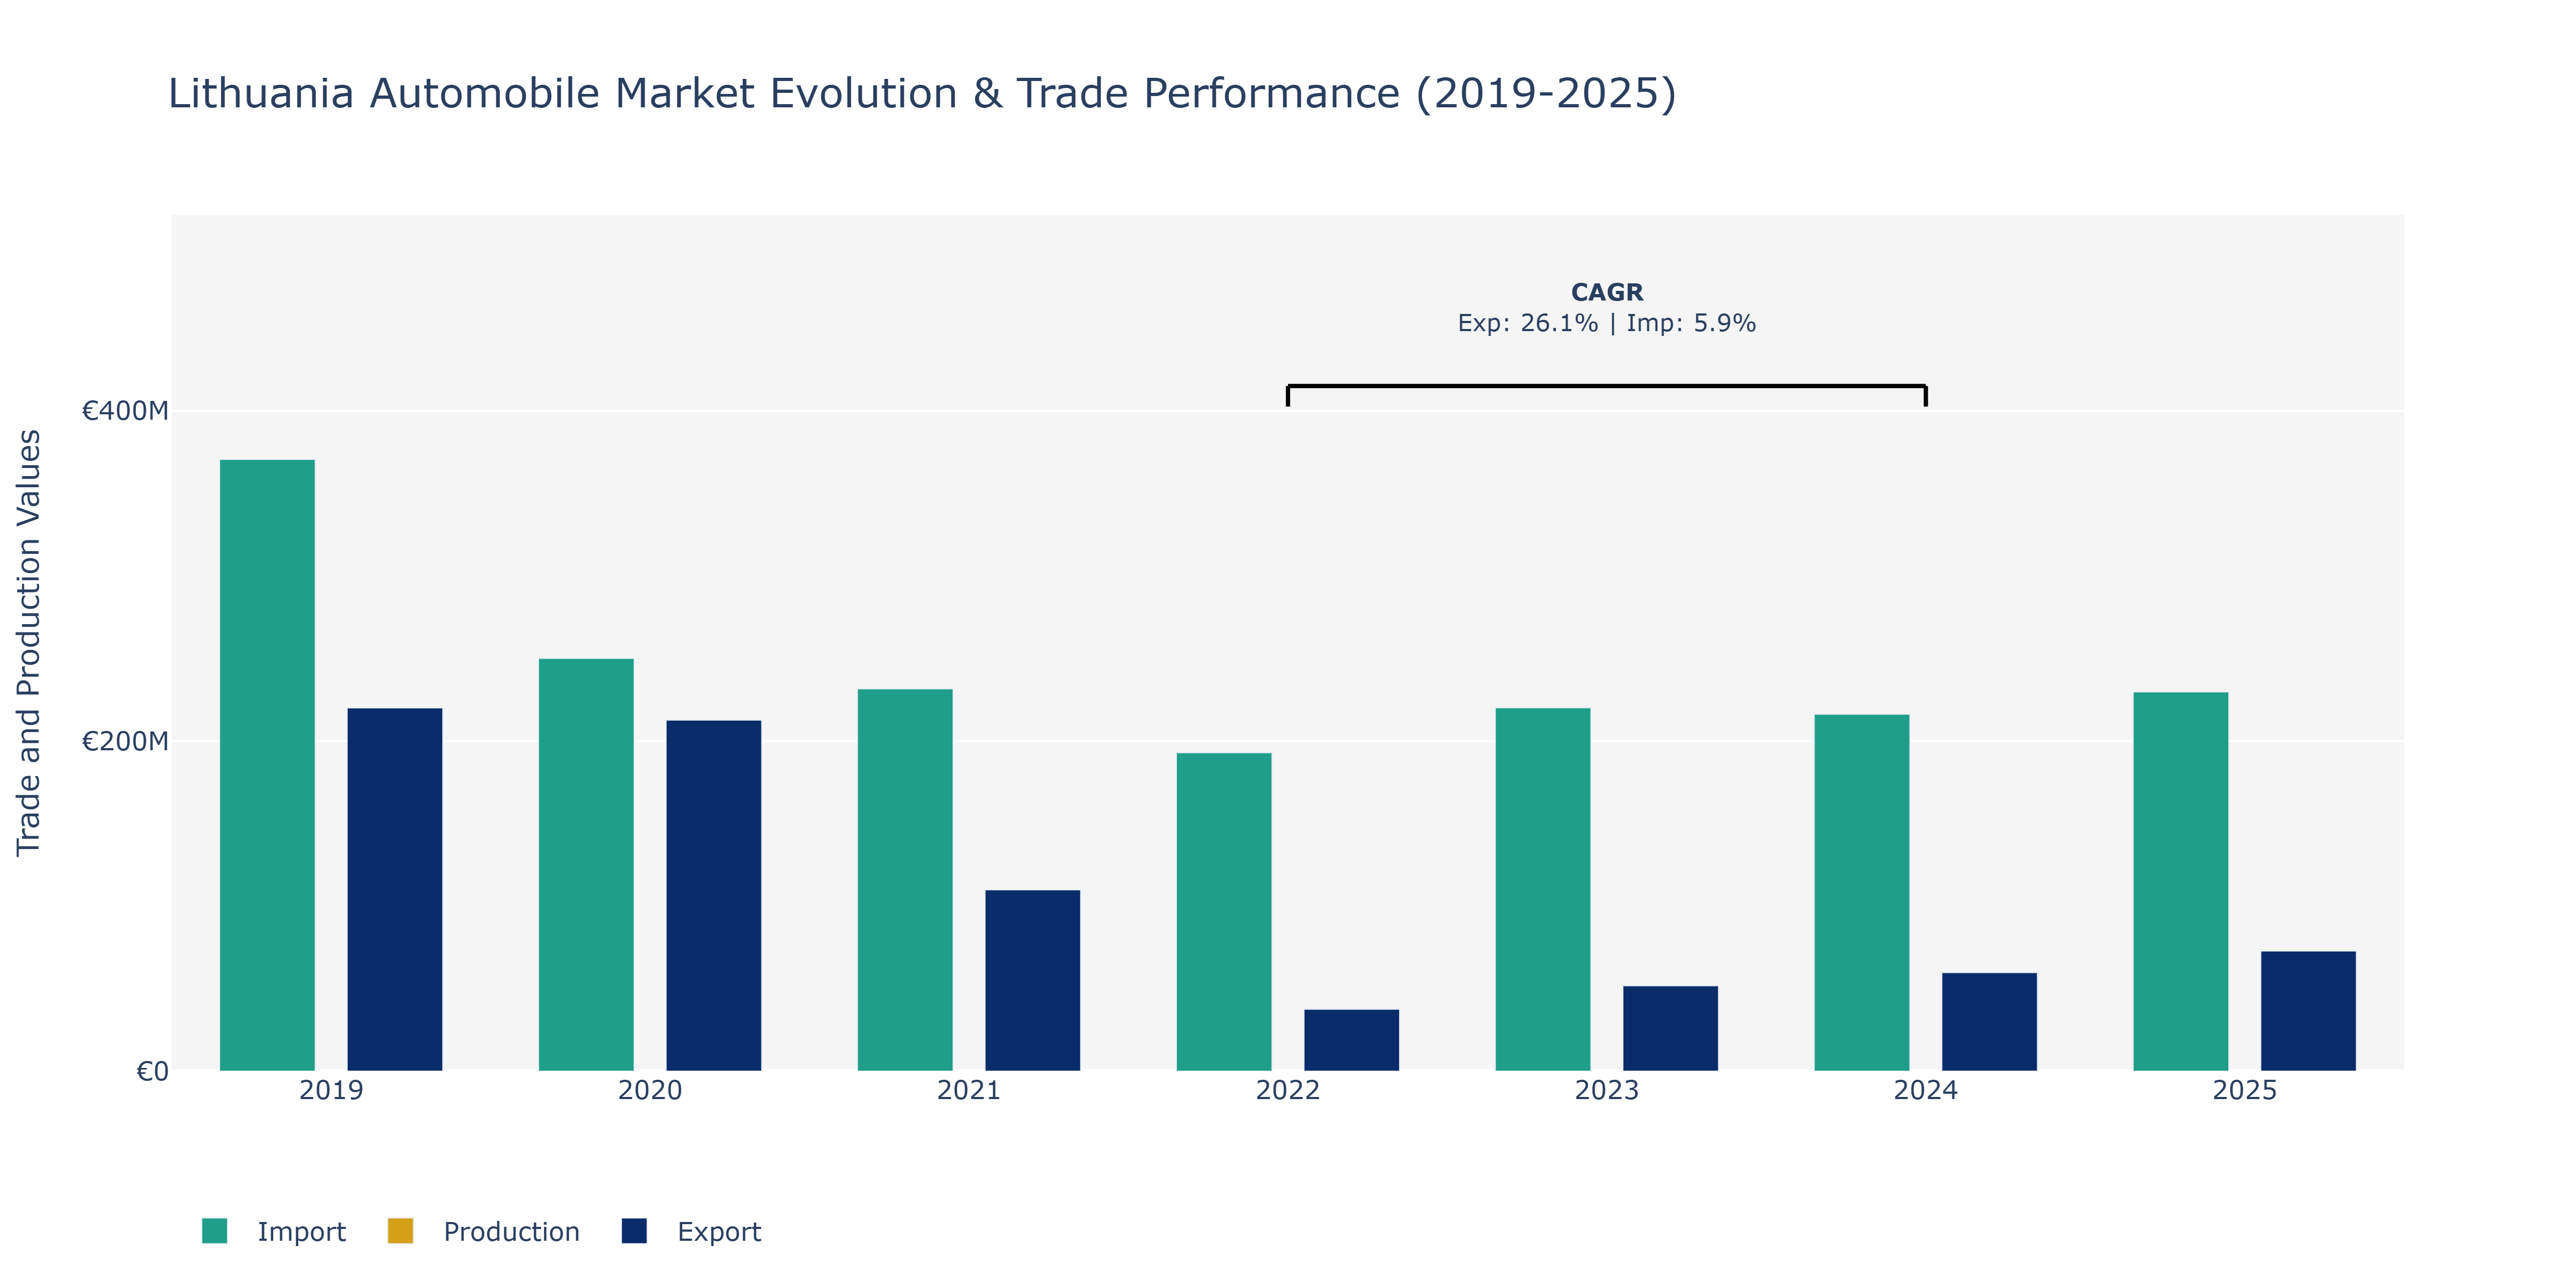
In the Lithuania Automobile Market, exports experienced a notable fluctuation, starting at €220.07 million in 2019, declining to €109.9 million in 2021, and rebounding to €72.81 million in 2025. Imports followed a similar trend, decreasing from €370.63 million in 2019 to €192.92 million in 2022 before rising to €229.79 million in 2025. The market witnessed a peak in exports in 2019, likely due to increased demand for Lithuanian automobiles. The subsequent decline in exports and imports in 2021 could be attributed to global economic challenges impacting trade. The recovery and growth post-2021 may reflect improved market conditions and strategic initiatives by industry players to expand their presence in international markets. The increase in production in 2024 indicates a potential focus on local manufacturing capabilities, aligning with Lithuania's efforts to strengthen its automotive sector through investments in production facilities and technology advancements.
Key Highlights of the Report:
- Lithuania Automobile Market Outlook
- Market Size of Lithuania Automobile Market, 2025
- Forecast of Lithuania Automobile Market, 2032
- Historical Data and Forecast of Lithuania Automobile Revenues & Volume for the Period 2022 - 2032
- Lithuania Automobile Market Trend Evolution
- Lithuania Automobile Market Drivers and Challenges
- Lithuania Automobile Price Trends
- Lithuania Automobile Porter's Five Forces
- Lithuania Automobile Industry Life Cycle
- Historical Data and Forecast of Lithuania Automobile Market Revenues & Volume By Vehicle Type for the Period 2022 - 2032
- Historical Data and Forecast of Lithuania Automobile Market Revenues & Volume By Passenger Cars for the Period 2022 - 2032
- Historical Data and Forecast of Lithuania Automobile Market Revenues & Volume By Commercial Vehicles for the Period 2022 - 2032
- Historical Data and Forecast of Lithuania Automobile Market Revenues & Volume By Two-wheelers for the Period 2022 - 2032
- Historical Data and Forecast of Lithuania Automobile Market Revenues & Volume By Three-wheelers for the Period 2022 - 2032
- Historical Data and Forecast of Lithuania Automobile Market Revenues & Volume By Propulsion for the Period 2022 - 2032
- Historical Data and Forecast of Lithuania Automobile Market Revenues & Volume By Internal Combustion Engine for the Period 2022 - 2032
- Historical Data and Forecast of Lithuania Automobile Market Revenues & Volume By Electric Vehicles for the Period 2022 - 2032
- Historical Data and Forecast of Lithuania Automobile Market Revenues & Volume By Type for the Period 2022 - 2032
- Historical Data and Forecast of Lithuania Automobile Market Revenues & Volume By New Vehicles for the Period 2022 - 2032
- Historical Data and Forecast of Lithuania Automobile Market Revenues & Volume By Used Vehicles for the Period 2022 - 2032
- Lithuania Automobile Import Export Trade Statistics
- Market Opportunity Assessment By Vehicle Type
- Market Opportunity Assessment By Propulsion
- Market Opportunity Assessment By Type
- Lithuania Automobile Top Companies Market Share
- Lithuania Automobile Competitive Benchmarking By Technical and Operational Parameters
- Lithuania Automobile Company Profiles
- Lithuania Automobile Key Strategic Recommendations
Frequently Asked Questions About the Market Study (FAQs):
6Wresearch actively monitors the Lithuania Automobile Market and publishes its comprehensive annual report, highlighting emerging trends, growth drivers, revenue analysis, and forecast outlook. Our insights help businesses to make data-backed strategic decisions with ongoing market dynamics. Our analysts track relevent industries related to the Lithuania Automobile Market, allowing our clients with actionable intelligence and reliable forecasts tailored to emerging regional needs.
Yes, we provide customisation as per your requirements. To learn more, feel free to contact us on sales@6wresearch.com
1 Executive Summary |
2 Introduction |
2.1 Key Highlights of the Report |
2.2 Report Description |
2.3 Market Scope & Segmentation |
2.4 Research Methodology |
2.5 Assumptions |
3 Lithuania Automobile Market Overview |
3.1 Lithuania Country Macro Economic Indicators |
3.2 Lithuania Automobile Market Revenues & Volume, 2022 & 2032F |
3.3 Lithuania Automobile Market - Industry Life Cycle |
3.4 Lithuania Automobile Market - Porter's Five Forces |
3.5 Lithuania Automobile Market Revenues & Volume Share, By Vehicle Type, 2022 & 2032F |
3.6 Lithuania Automobile Market Revenues & Volume Share, By Propulsion, 2022 & 2032F |
3.7 Lithuania Automobile Market Revenues & Volume Share, By Type, 2022 & 2032F |
4 Lithuania Automobile Market Dynamics |
4.1 Impact Analysis |
4.2 Market Drivers |
4.2.1 Increasing disposable income of consumers in Lithuania |
4.2.2 Government initiatives promoting electric and hybrid vehicles |
4.2.3 Growth in the tourism industry leading to higher demand for rental cars |
4.3 Market Restraints |
4.3.1 High import tariffs and taxes on automobiles in Lithuania |
4.3.2 Fluctuating fuel prices impacting consumer purchasing power |
4.3.3 Limited infrastructure for electric vehicle charging stations |
5 Lithuania Automobile Market Trends |
6 Lithuania Automobile Market, By Types |
6.1 Lithuania Automobile Market, By Vehicle Type |
6.1.1 Overview and Analysis |
6.1.2 Lithuania Automobile Market Revenues & Volume, By Vehicle Type, 2022 - 2032F |
6.1.3 Lithuania Automobile Market Revenues & Volume, By Passenger Cars, 2022 - 2032F |
6.1.4 Lithuania Automobile Market Revenues & Volume, By Commercial Vehicles, 2022 - 2032F |
6.1.5 Lithuania Automobile Market Revenues & Volume, By Two-wheelers, 2022 - 2032F |
6.1.6 Lithuania Automobile Market Revenues & Volume, By Three-wheelers, 2022 - 2032F |
6.2 Lithuania Automobile Market, By Propulsion |
6.2.1 Overview and Analysis |
6.2.2 Lithuania Automobile Market Revenues & Volume, By Internal Combustion Engine, 2022 - 2032F |
6.2.3 Lithuania Automobile Market Revenues & Volume, By Electric Vehicles, 2022 - 2032F |
6.3 Lithuania Automobile Market, By Type |
6.3.1 Overview and Analysis |
6.3.2 Lithuania Automobile Market Revenues & Volume, By New Vehicles, 2022 - 2032F |
6.3.3 Lithuania Automobile Market Revenues & Volume, By Used Vehicles, 2022 - 2032F |
7 Lithuania Automobile Market Import-Export Trade Statistics |
7.1 Lithuania Automobile Market Export to Major Countries |
7.2 Lithuania Automobile Market Imports from Major Countries |
8 Lithuania Automobile Market Key Performance Indicators |
8.1 Average age of vehicles in Lithuania |
8.2 Number of new car registrations |
8.3 Adoption rate of electric vehicles in the market |
9 Lithuania Automobile Market - Opportunity Assessment |
9.1 Lithuania Automobile Market Opportunity Assessment, By Vehicle Type, 2022 & 2032F |
9.2 Lithuania Automobile Market Opportunity Assessment, By Propulsion, 2022 & 2032F |
9.3 Lithuania Automobile Market Opportunity Assessment, By Type, 2022 & 2032F |
10 Lithuania Automobile Market - Competitive Landscape |
10.1 Lithuania Automobile Market Revenue Share, By Companies, 2025 |
10.2 Lithuania Automobile Market Competitive Benchmarking, By Operating and Technical Parameters |
11 Company Profiles |
12 Recommendations |
13 Disclaimer |
Global Go To Market Strategy - 2030
Export potential enables firms to identify high-growth global markets with greater confidence by combining advanced trade intelligence with a structured quantitative methodology. The framework analyzes emerging demand trends and country-level import patterns while integrating macroeconomic and trade datasets such as GDP and population forecasts, bilateral import–export flows, tariff structures, elasticity differentials between developed and developing economies, geographic distance, and import demand projections. Using weighted trade values from 2020–2024 as the base period to project country-to-country export potential for 2030, these inputs are operationalized through calculated drivers such as gravity model parameters, tariff impact factors, and projected GDP per-capita growth. Through an analysis of hidden potentials, demand hotspots, and market conditions that are most favorable to success, this method enables firms to focus on target countries, maximize returns, and global expansion with data, backed by accuracy.
By factoring in the projected importer demand gap that is currently unmet and could be potential opportunity, it identifies the potential for the Exporter (Country) among 190 countries, against the general trade analysis, which identifies the biggest importer or exporter.
To discover high-growth global markets and optimize your business strategy:
Click Here
Pricing
- Single User License$ 1,995
- Department License$ 2,400
- Site License$ 3,120
- Global License$ 3,795

Leadership Perspectives from Industry Events
Search
Thought Leadership and Analyst Meet


Our Clients
6WResearch In News
- Doha a strategic location for EV manufacturing hub: IPA Qatar
- Demand for luxury TVs surging in the GCC, says Samsung
- Empowering Growth: The Thriving Journey of Bangladesh’s Cable Industry
- Demand for luxury TVs surging in the GCC, says Samsung
- Video call with a traditional healer? Once unthinkable, it’s now common in South Africa
- Intelligent Buildings To Smooth GCC’s Path To Net Zero
Latest Reports
- Taiwan Airport Wireless Infrastructure Market (2026-2032)
- Vietnam Airport Wireless Infrastructure Market (2026-2032)
- Thailand Airport Wireless Infrastructure Market (2026-2032)
- South Korea Airport Wireless Infrastructure Market (2026-2032)
- Romania Airport Wireless Infrastructure Market (2026-2032)
- Qatar Airport Wireless Infrastructure Market (2026-2032)
- Philippines Airport Wireless Infrastructure Market (2026-2032)
- Japan Airport Wireless Infrastructure Market (2026-2032)
- Taiwan Airport Winter Services Market (2026-2032)
- Vietnam Airport Winter Services Market (2026-2032)
Industry Events and Analyst Meet

HIMTEX 2026

India Refining Summit 2026

India EV Show 2026

EV tech India Expo 2026

Auto Tech Asia 2026
Whitepaper
- Middle East & Africa Commercial Security Market Click here to view more.
- Middle East & Africa Fire Safety Systems & Equipment Market Click here to view more.
- GCC Drone Market Click here to view more.
- Middle East Lighting Fixture Market Click here to view more.
- GCC Physical & Perimeter Security Market Click here to view more.