Lithuania Baby Carriage Market (2026-2032) | Forecast, Segments, Opportunities, Revenue, Supply, Consumer Insights, Value, Growth, Restraints, Share, Companies, Competition, Investment Trends, Size, Trends, Competitive, Pricing Analysis, Analysis, Drivers, Segmentation, Demand, Industry, Challenges, Strategic Insights, Outlook, Strategy
Market Forecast By Product Type (Strollers, Prams, Double Strollers, Jogging Strollers, Travel Systems), By Application (Mobility & Travel, Infant Transport, Twin or Multiple Children, Outdoor and Active Mobility, Convenient Travel), By End User (Parenting, Baby Products, Parents, Parents & Retail), By Distribution Channel (Online Platforms, Baby Care Store) And Competitive Landscape
| Product Code: ETC11173242 | Publication Date: Apr 2025 | Updated Date: Apr 2026 | Product Type: Market Research Report | |
| Publisher: 6Wresearch | Author: Bhawna Singh | No. of Pages: 65 | No. of Figures: 34 | No. of Tables: 19 |
Lithuania Baby Carriage Market Size (2020-2030)
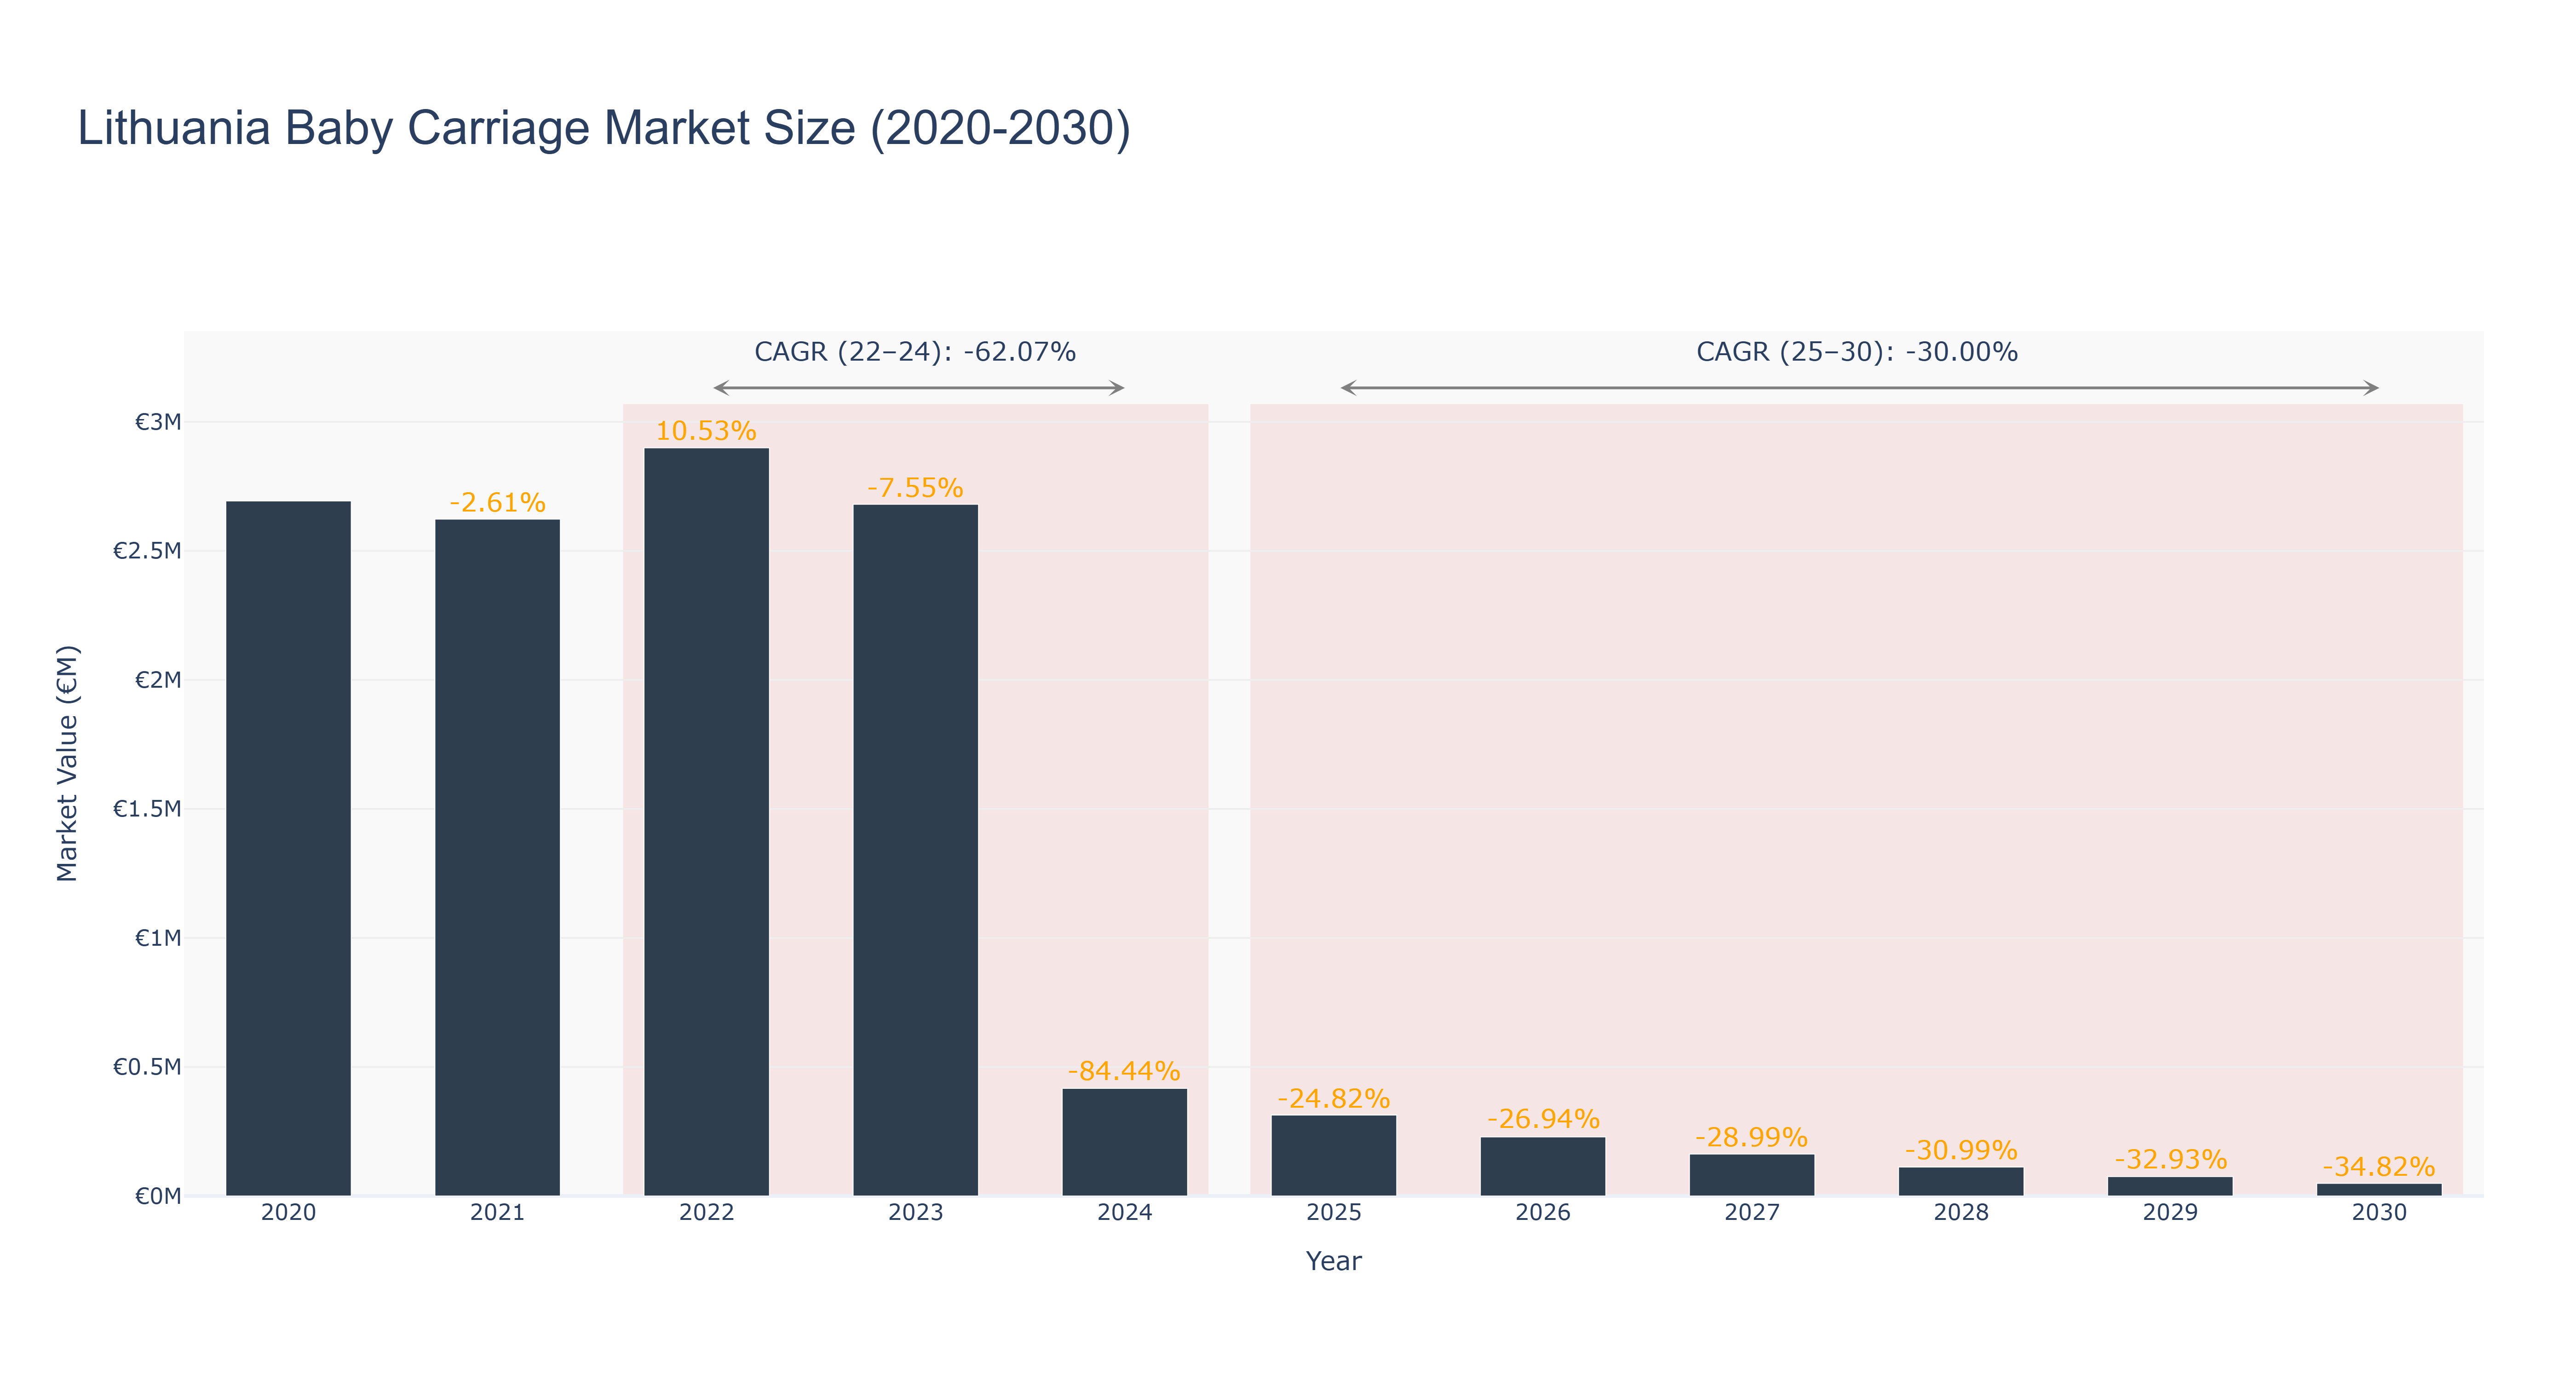
The Lithuania Baby Carriage Market experienced notable fluctuations between 2020 and 2024, peaking at €2.90 million in 2022 before declining to €417.13 thousand by 2024, reflecting a negative CAGR of -62.07%. The decline can be attributed to shifting consumer preferences, economic challenges, and the impact of the COVID-19 pandemic, which disrupted supply chains and reduced disposable income. Looking ahead, the forecasted period from 2025 to 2030 indicates a continued contraction, with projected market sizes decreasing from €313.58 thousand in 2025 to €49.08 thousand by 2030, resulting in a forecasted CAGR of -30.00%. This ongoing decline suggests a potential market saturation and increased competition from alternative infant transportation solutions. While no significant upcoming projects have been identified, broader industry trends, such as sustainability and innovation in baby products, may influence market dynamics in the coming years.
Lithuania Baby Carriage Market: Production & Trade Performance (2019-2025)
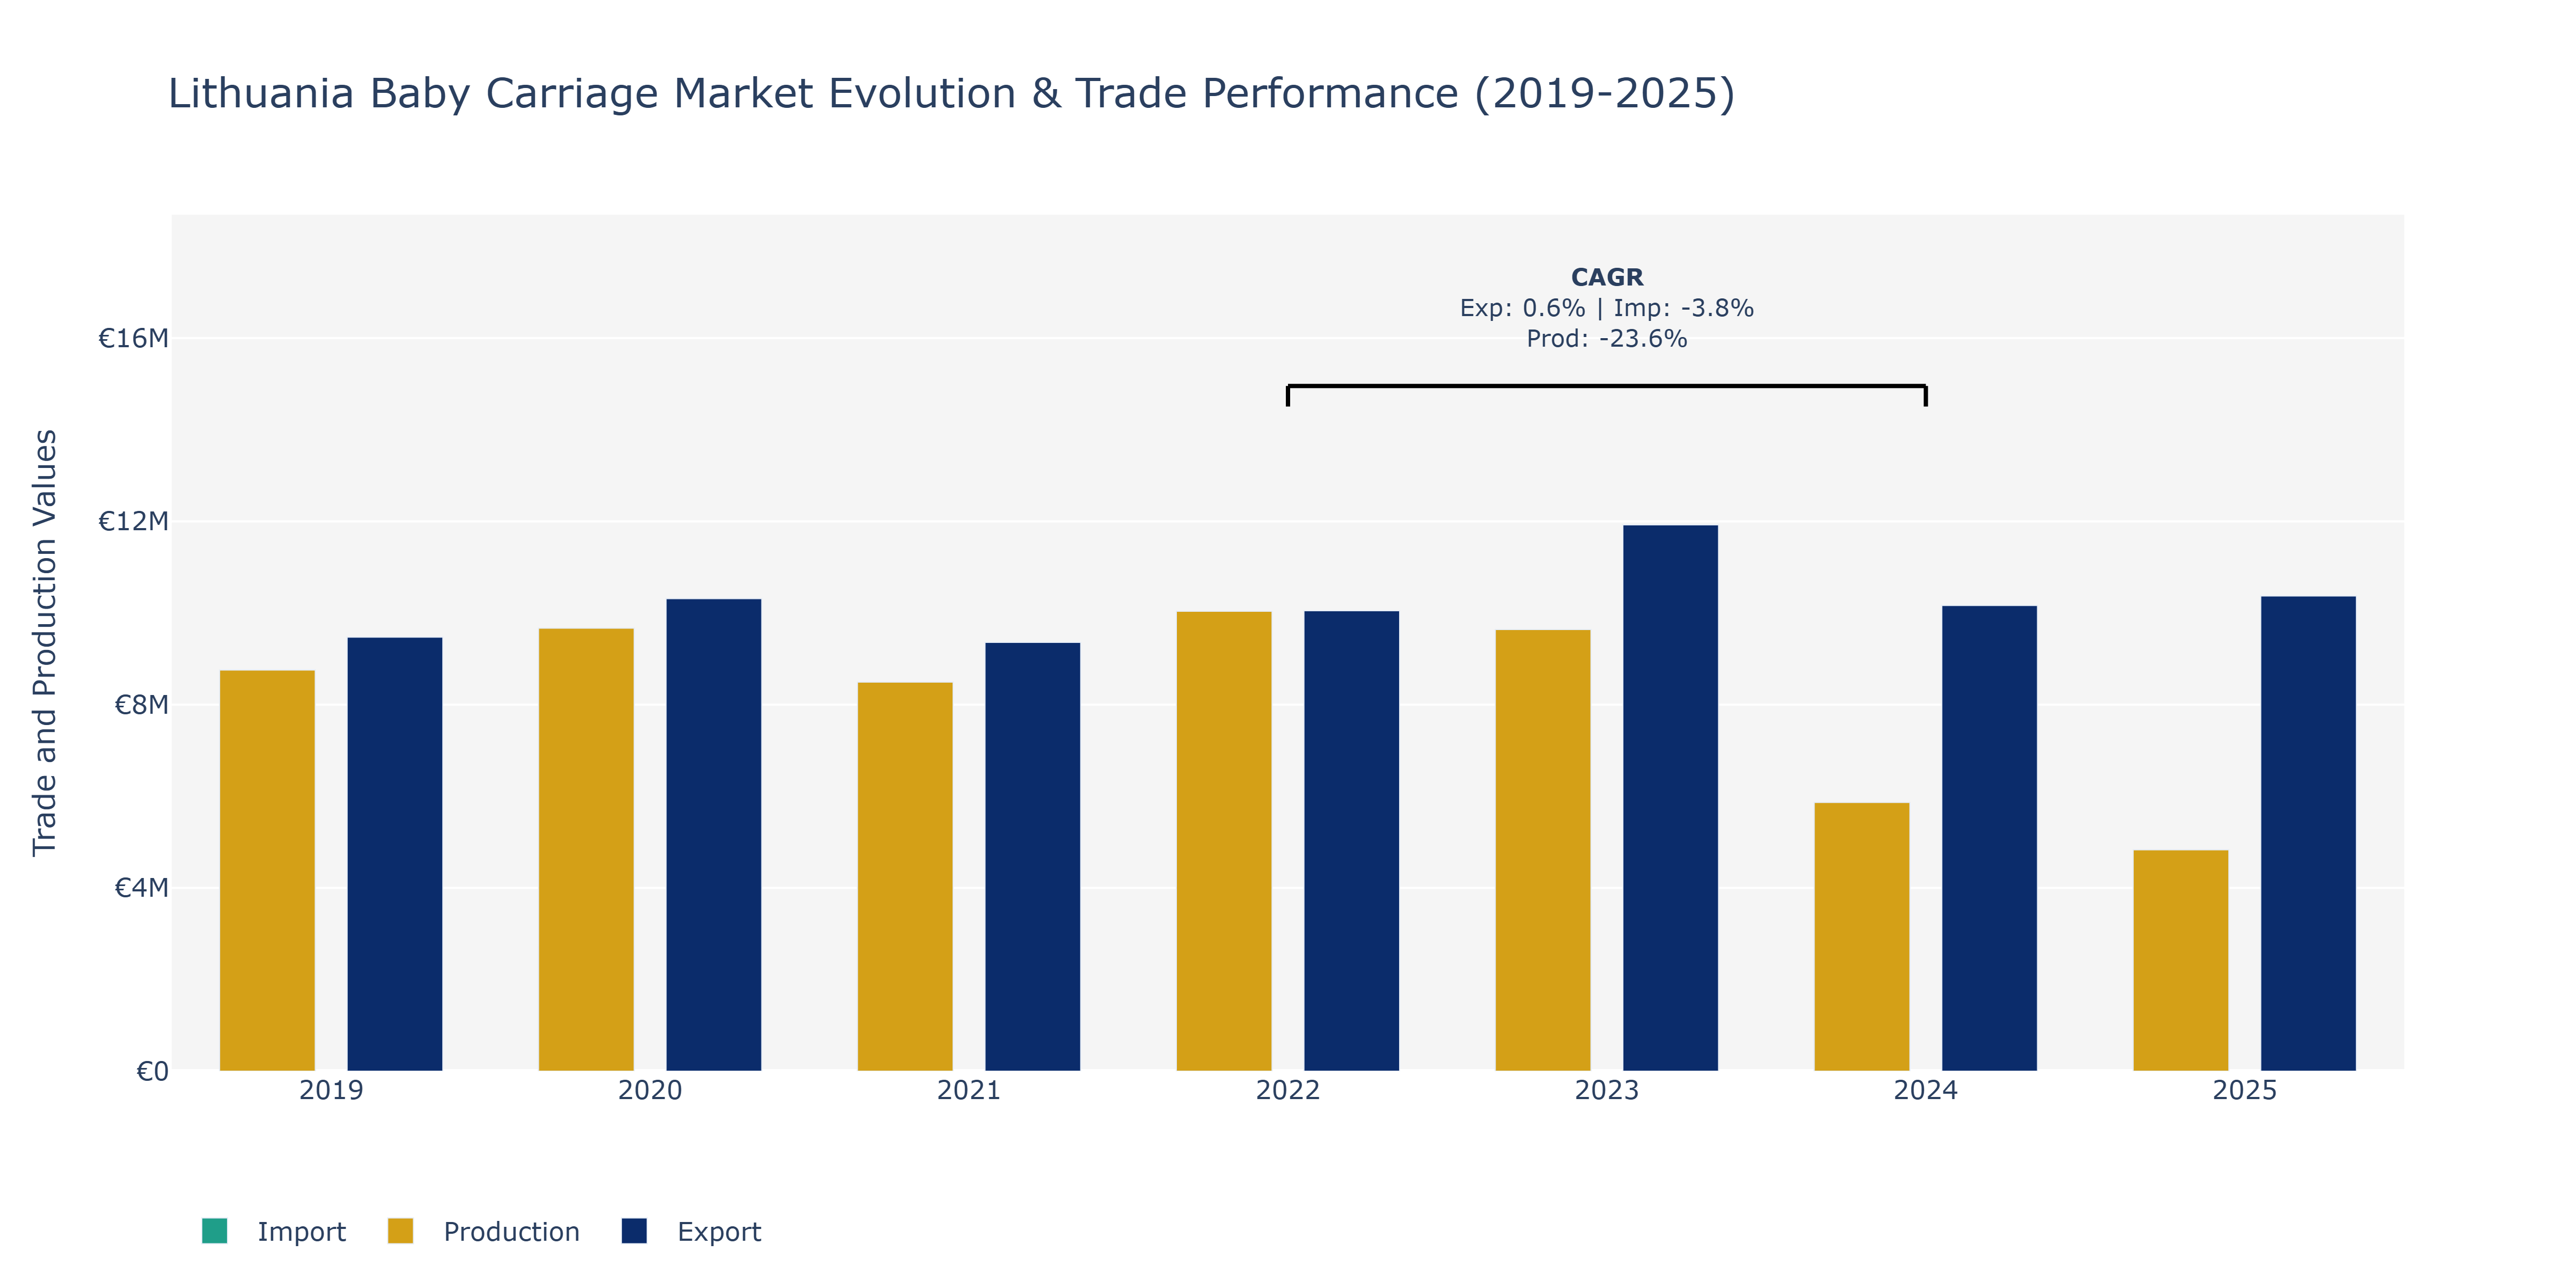
Between 2019 and 2025, the Lithuania Baby Carriage Market witnessed various shifts in Exports, Imports, and Production. Exports showed growth from €9.47 million in 2019 to a peak of €11.92 million in 2023 before slightly declining to €10.37 million in 2025. Imports fluctuated, reaching a peak of €3.71 million in 2023, with a notable decrease to €2.43 million in 2025. Production displayed a declining trend, starting at €8.76 million in 2019, dropping to €4.83 million in 2025. The market experienced a notable decrease in production, possibly due to shifts in consumer preferences towards imported products or changes in domestic manufacturing capabilities. The fluctuations in imports could be attributed to changing trade agreements or shifts in demand for specific baby carriage products. To sustain market competitiveness, local manufacturers may need to adapt production strategies to align with evolving consumer demands and global market trends.
Key Highlights of the Report:
- Lithuania Baby Carriage Market Outlook
- Market Size of Lithuania Baby Carriage Market, 2025
- Forecast of Lithuania Baby Carriage Market, 2032
- Historical Data and Forecast of Lithuania Baby Carriage Revenues & Volume for the Period 2022 - 2032F
- Lithuania Baby Carriage Market Trend Evolution
- Lithuania Baby Carriage Market Drivers and Challenges
- Lithuania Baby Carriage Price Trends
- Lithuania Baby Carriage Porter's Five Forces
- Lithuania Baby Carriage Industry Life Cycle
- Historical Data and Forecast of Lithuania Baby Carriage Market Revenues & Volume By Product Type for the Period 2022 - 2032F
- Historical Data and Forecast of Lithuania Baby Carriage Market Revenues & Volume By Strollers for the Period 2022 - 2032F
- Historical Data and Forecast of Lithuania Baby Carriage Market Revenues & Volume By Prams for the Period 2022 - 2032F
- Historical Data and Forecast of Lithuania Baby Carriage Market Revenues & Volume By Double Strollers for the Period 2022 - 2032F
- Historical Data and Forecast of Lithuania Baby Carriage Market Revenues & Volume By Jogging Strollers for the Period 2022 - 2032F
- Historical Data and Forecast of Lithuania Baby Carriage Market Revenues & Volume By Travel Systems for the Period 2022 - 2032F
- Historical Data and Forecast of Lithuania Baby Carriage Market Revenues & Volume By Application for the Period 2022 - 2032F
- Historical Data and Forecast of Lithuania Baby Carriage Market Revenues & Volume By Mobility & Travel for the Period 2022 - 2032F
- Historical Data and Forecast of Lithuania Baby Carriage Market Revenues & Volume By Infant Transport for the Period 2022 - 2032F
- Historical Data and Forecast of Lithuania Baby Carriage Market Revenues & Volume By Twin or Multiple Children for the Period 2022 - 2032F
- Historical Data and Forecast of Lithuania Baby Carriage Market Revenues & Volume By Outdoor and Active Mobility for the Period 2022 - 2032F
- Historical Data and Forecast of Lithuania Baby Carriage Market Revenues & Volume By Convenient Travel for the Period 2022 - 2032F
- Historical Data and Forecast of Lithuania Baby Carriage Market Revenues & Volume By End User for the Period 2022 - 2032F
- Historical Data and Forecast of Lithuania Baby Carriage Market Revenues & Volume By Parenting for the Period 2022 - 2032F
- Historical Data and Forecast of Lithuania Baby Carriage Market Revenues & Volume By Baby Products for the Period 2022 - 2032F
- Historical Data and Forecast of Lithuania Baby Carriage Market Revenues & Volume By Parents for the Period 2022 - 2032F
- Historical Data and Forecast of Lithuania Baby Carriage Market Revenues & Volume By Parents & Retail for the Period 2022 - 2032F
- Historical Data and Forecast of Lithuania Baby Carriage Market Revenues & Volume By Distribution Channel for the Period 2022 - 2032F
- Historical Data and Forecast of Lithuania Baby Carriage Market Revenues & Volume By Online Platforms for the Period 2022 - 2032F
- Historical Data and Forecast of Lithuania Baby Carriage Market Revenues & Volume By Baby Care Store for the Period 2022 - 2032F
- Lithuania Baby Carriage Import Export Trade Statistics
- Market Opportunity Assessment By Product Type
- Market Opportunity Assessment By Application
- Market Opportunity Assessment By End User
- Market Opportunity Assessment By Distribution Channel
- Lithuania Baby Carriage Top Companies Market Share
- Lithuania Baby Carriage Competitive Benchmarking By Technical and Operational Parameters
- Lithuania Baby Carriage Company Profiles
- Lithuania Baby Carriage Key Strategic Recommendations
Frequently Asked Questions About the Market Study (FAQs):
6Wresearch actively monitors the Lithuania Baby Carriage Market and publishes its comprehensive annual report, highlighting emerging trends, growth drivers, revenue analysis, and forecast outlook. Our insights help businesses to make data-backed strategic decisions with ongoing market dynamics. Our analysts track relevent industries related to the Lithuania Baby Carriage Market, allowing our clients with actionable intelligence and reliable forecasts tailored to emerging regional needs.
Yes, we provide customisation as per your requirements. To learn more, feel free to contact us on sales@6wresearch.com
1 Executive Summary |
2 Introduction |
2.1 Key Highlights of the Report |
2.2 Report Description |
2.3 Market Scope & Segmentation |
2.4 Research Methodology |
2.5 Assumptions |
3 Lithuania Baby Carriage Market Overview |
3.1 Lithuania Country Macro Economic Indicators |
3.2 Lithuania Baby Carriage Market Revenues & Volume, 2022 & 2032F |
3.3 Lithuania Baby Carriage Market - Industry Life Cycle |
3.4 Lithuania Baby Carriage Market - Porter's Five Forces |
3.5 Lithuania Baby Carriage Market Revenues & Volume Share, By Product Type, 2022 & 2032F |
3.6 Lithuania Baby Carriage Market Revenues & Volume Share, By Application, 2022 & 2032F |
3.7 Lithuania Baby Carriage Market Revenues & Volume Share, By End User, 2022 & 2032F |
3.8 Lithuania Baby Carriage Market Revenues & Volume Share, By Distribution Channel, 2022 & 2032F |
4 Lithuania Baby Carriage Market Dynamics |
4.1 Impact Analysis |
4.2 Market Drivers |
4.2.1 Increasing urbanization leading to higher demand for convenient baby transportation solutions in cities. |
4.2.2 Growing focus on child safety and comfort driving the demand for technologically advanced and ergonomic baby carriages. |
4.2.3 Rising disposable incomes enabling consumers to opt for premium and high-quality baby carriage products. |
4.3 Market Restraints |
4.3.1 High market competition leading to price wars and margin pressures for baby carriage manufacturers. |
4.3.2 Fluctuating raw material prices impacting the overall production costs and pricing of baby carriages. |
4.3.3 Stringent government regulations and safety standards increasing the compliance burden on manufacturers. |
5 Lithuania Baby Carriage Market Trends |
6 Lithuania Baby Carriage Market, By Types |
6.1 Lithuania Baby Carriage Market, By Product Type |
6.1.1 Overview and Analysis |
6.1.2 Lithuania Baby Carriage Market Revenues & Volume, By Product Type, 2022 - 2032F |
6.1.3 Lithuania Baby Carriage Market Revenues & Volume, By Strollers, 2022 - 2032F |
6.1.4 Lithuania Baby Carriage Market Revenues & Volume, By Prams, 2022 - 2032F |
6.1.5 Lithuania Baby Carriage Market Revenues & Volume, By Double Strollers, 2022 - 2032F |
6.1.6 Lithuania Baby Carriage Market Revenues & Volume, By Jogging Strollers, 2022 - 2032F |
6.1.7 Lithuania Baby Carriage Market Revenues & Volume, By Travel Systems, 2022 - 2032F |
6.2 Lithuania Baby Carriage Market, By Application |
6.2.1 Overview and Analysis |
6.2.2 Lithuania Baby Carriage Market Revenues & Volume, By Mobility & Travel, 2022 - 2032F |
6.2.3 Lithuania Baby Carriage Market Revenues & Volume, By Infant Transport, 2022 - 2032F |
6.2.4 Lithuania Baby Carriage Market Revenues & Volume, By Twin or Multiple Children, 2022 - 2032F |
6.2.5 Lithuania Baby Carriage Market Revenues & Volume, By Outdoor and Active Mobility, 2022 - 2032F |
6.2.6 Lithuania Baby Carriage Market Revenues & Volume, By Convenient Travel, 2022 - 2032F |
6.3 Lithuania Baby Carriage Market, By End User |
6.3.1 Overview and Analysis |
6.3.2 Lithuania Baby Carriage Market Revenues & Volume, By Parenting, 2022 - 2032F |
6.3.3 Lithuania Baby Carriage Market Revenues & Volume, By Baby Products, 2022 - 2032F |
6.3.4 Lithuania Baby Carriage Market Revenues & Volume, By Parents, 2022 - 2032F |
6.3.5 Lithuania Baby Carriage Market Revenues & Volume, By Parents & Retail, 2022 - 2032F |
6.4 Lithuania Baby Carriage Market, By Distribution Channel |
6.4.1 Overview and Analysis |
6.4.2 Lithuania Baby Carriage Market Revenues & Volume, By Online Platforms, 2022 - 2032F |
6.4.3 Lithuania Baby Carriage Market Revenues & Volume, By Baby Care Store, 2022 - 2032F |
7 Lithuania Baby Carriage Market Import-Export Trade Statistics |
7.1 Lithuania Baby Carriage Market Export to Major Countries |
7.2 Lithuania Baby Carriage Market Imports from Major Countries |
8 Lithuania Baby Carriage Market Key Performance Indicators |
8.1 Average selling price (ASP) of baby carriages in the Lithuanian market. |
8.2 Consumer satisfaction scores related to the comfort, safety, and durability of baby carriages. |
8.3 Adoption rate of eco-friendly and sustainable materials in baby carriage manufacturing. |
8.4 Number of new product launches and innovations in the baby carriage market segment. |
8.5 Percentage of market share held by local Lithuanian baby carriage manufacturers. |
9 Lithuania Baby Carriage Market - Opportunity Assessment |
9.1 Lithuania Baby Carriage Market Opportunity Assessment, By Product Type, 2022 & 2032F |
9.2 Lithuania Baby Carriage Market Opportunity Assessment, By Application, 2022 & 2032F |
9.3 Lithuania Baby Carriage Market Opportunity Assessment, By End User, 2022 & 2032F |
9.4 Lithuania Baby Carriage Market Opportunity Assessment, By Distribution Channel, 2022 & 2032F |
10 Lithuania Baby Carriage Market - Competitive Landscape |
10.1 Lithuania Baby Carriage Market Revenue Share, By Companies, 2025 |
10.2 Lithuania Baby Carriage Market Competitive Benchmarking, By Operating and Technical Parameters |
11 Company Profiles |
12 Recommendations |
13 Disclaimer |
Export potential assessment - trade Analytics for 2030
Export potential enables firms to identify high-growth global markets with greater confidence by combining advanced trade intelligence with a structured quantitative methodology. The framework analyzes emerging demand trends and country-level import patterns while integrating macroeconomic and trade datasets such as GDP and population forecasts, bilateral import–export flows, tariff structures, elasticity differentials between developed and developing economies, geographic distance, and import demand projections. Using weighted trade values from 2020–2024 as the base period to project country-to-country export potential for 2030, these inputs are operationalized through calculated drivers such as gravity model parameters, tariff impact factors, and projected GDP per-capita growth. Through an analysis of hidden potentials, demand hotspots, and market conditions that are most favorable to success, this method enables firms to focus on target countries, maximize returns, and global expansion with data, backed by accuracy.
By factoring in the projected importer demand gap that is currently unmet and could be potential opportunity, it identifies the potential for the Exporter (Country) among 190 countries, against the general trade analysis, which identifies the biggest importer or exporter.
To discover high-growth global markets and optimize your business strategy:
Click Here
Pricing
- Single User License$ 1,995
- Department License$ 2,400
- Site License$ 3,120
- Global License$ 3,795

Search
Thought Leadership and Analyst Meet


Our Clients
Latest Reports
- France Thermally Conductive Filler Dispersants Market (2026-2032) | Challenges, Restraints, Value, Share, Size, segmentation, Analysis, Trends, Investment Opportunities, Outlook, Pricing, Demand, Forecast, Revenue, Companies, Growth, Drivers, Strategy, Insights, Competition
- Egypt Thermally Conductive Filler Dispersants Market (2026-2032) | Competition, Forecast, Strategy, Value, Insights, Outlook, Investment Opportunities, Pricing, Demand, Share, segmentation, Drivers, Size, Companies, Restraints, Growth, Trends, Revenue, Challenges, Analysis
- Czech Republic Thermally Conductive Filler Dispersants Market (2026-2032) | Forecast, Pricing, Analysis, Drivers, Insights, Size, Demand, Growth, Challenges, segmentation, Competition, Outlook, Trends, Investment Opportunities, Companies, Strategy, Revenue, Share, Value, Restraints
- Colombia Thermally Conductive Filler Dispersants Market (2026-2032) | segmentation, Trends, Share, Drivers, Strategy, Companies, Demand, Insights, Size, Challenges, Value, Competition, Analysis, Growth, Revenue, Restraints, Forecast, Pricing, Outlook, Investment Opportunities
- China Thermally Conductive Filler Dispersants Market (2026-2032) | Restraints, Investment Opportunities, Pricing, Companies, Share, Size, Challenges, Trends, Outlook, Value, Analysis, Competition, Revenue, Drivers, Forecast, Demand, Insights, Growth, Strategy, segmentation
- Chile Thermally Conductive Filler Dispersants Market (2026-2032) | Investment Opportunities, Trends, Value, Restraints, Share, Companies, Forecast, segmentation, Pricing, Challenges, Demand, Size, Analysis, Drivers, Outlook, Growth, Competition, Strategy, Revenue, Insights
- Cambodia Thermally Conductive Filler Dispersants Market (2026-2032) | Analysis, Share, Outlook, Strategy, Pricing, Demand, Size, Growth, segmentation, Insights, Revenue, Forecast, Challenges, Competition, Companies, Investment Opportunities, Trends, Restraints, Value, Drivers
- Brazil Thermally Conductive Filler Dispersants Market (2026-2032) | Restraints, Forecast, Competition, Size, Revenue, Value, Investment Opportunities, Trends, Insights, Outlook, Growth, Analysis, Drivers, segmentation, Pricing, Challenges, Strategy, Share, Companies, Demand
- Bangladesh Thermally Conductive Filler Dispersants Market (2026-2032) | Restraints, Trends, Analysis, Competition, Insights, Forecast, Value, Investment Opportunities, Pricing, Share, Demand, Outlook, Revenue, segmentation, Companies, Drivers, Growth, Size, Challenges, Strategy
- Bahrain Thermally Conductive Filler Dispersants Market (2026-2032) | Trends, Outlook, Pricing, Demand, Value, Competition, Forecast, Growth, segmentation, Revenue, Companies, Analysis, Insights, Size, Drivers, Challenges, Strategy, Investment Opportunities, Share, Restraints
Industry Events and Analyst Meet

HIMTEX 2026

India Refining Summit 2026

India EV Show 2026

EV tech India Expo 2026

Auto Tech Asia 2026
Whitepaper
- Middle East & Africa Commercial Security Market Click here to view more.
- Middle East & Africa Fire Safety Systems & Equipment Market Click here to view more.
- GCC Drone Market Click here to view more.
- Middle East Lighting Fixture Market Click here to view more.
- GCC Physical & Perimeter Security Market Click here to view more.
6WResearch In News
- Doha a strategic location for EV manufacturing hub: IPA Qatar
- Demand for luxury TVs surging in the GCC, says Samsung
- Empowering Growth: The Thriving Journey of Bangladesh’s Cable Industry
- Demand for luxury TVs surging in the GCC, says Samsung
- Video call with a traditional healer? Once unthinkable, it’s now common in South Africa
- Intelligent Buildings To Smooth GCC’s Path To Net Zero