Lithuania Bakery Fat Market (2026-2032) | Value, Companies, Outlook, Trends, Competitive Landscape, Segmentation, Growth, Industry, Forecast, Share, Analysis, Size & Revenue
Market Forecast By Type (Shortening, Margarine, Bakery Oils, Others), By End-use (Industrial, Residential), By Distribution Channel (B2B, B2C, Online Retailing) And Competitive Landscape
| Product Code: ETC8035545 | Publication Date: Sep 2024 | Updated Date: Apr 2026 | Product Type: Market Research Report | |
| Publisher: 6Wresearch | Author: Vasudha | No. of Pages: 75 | No. of Figures: 35 | No. of Tables: 20 |
Lithuania Bakery Fat Market Size (2020-2030)
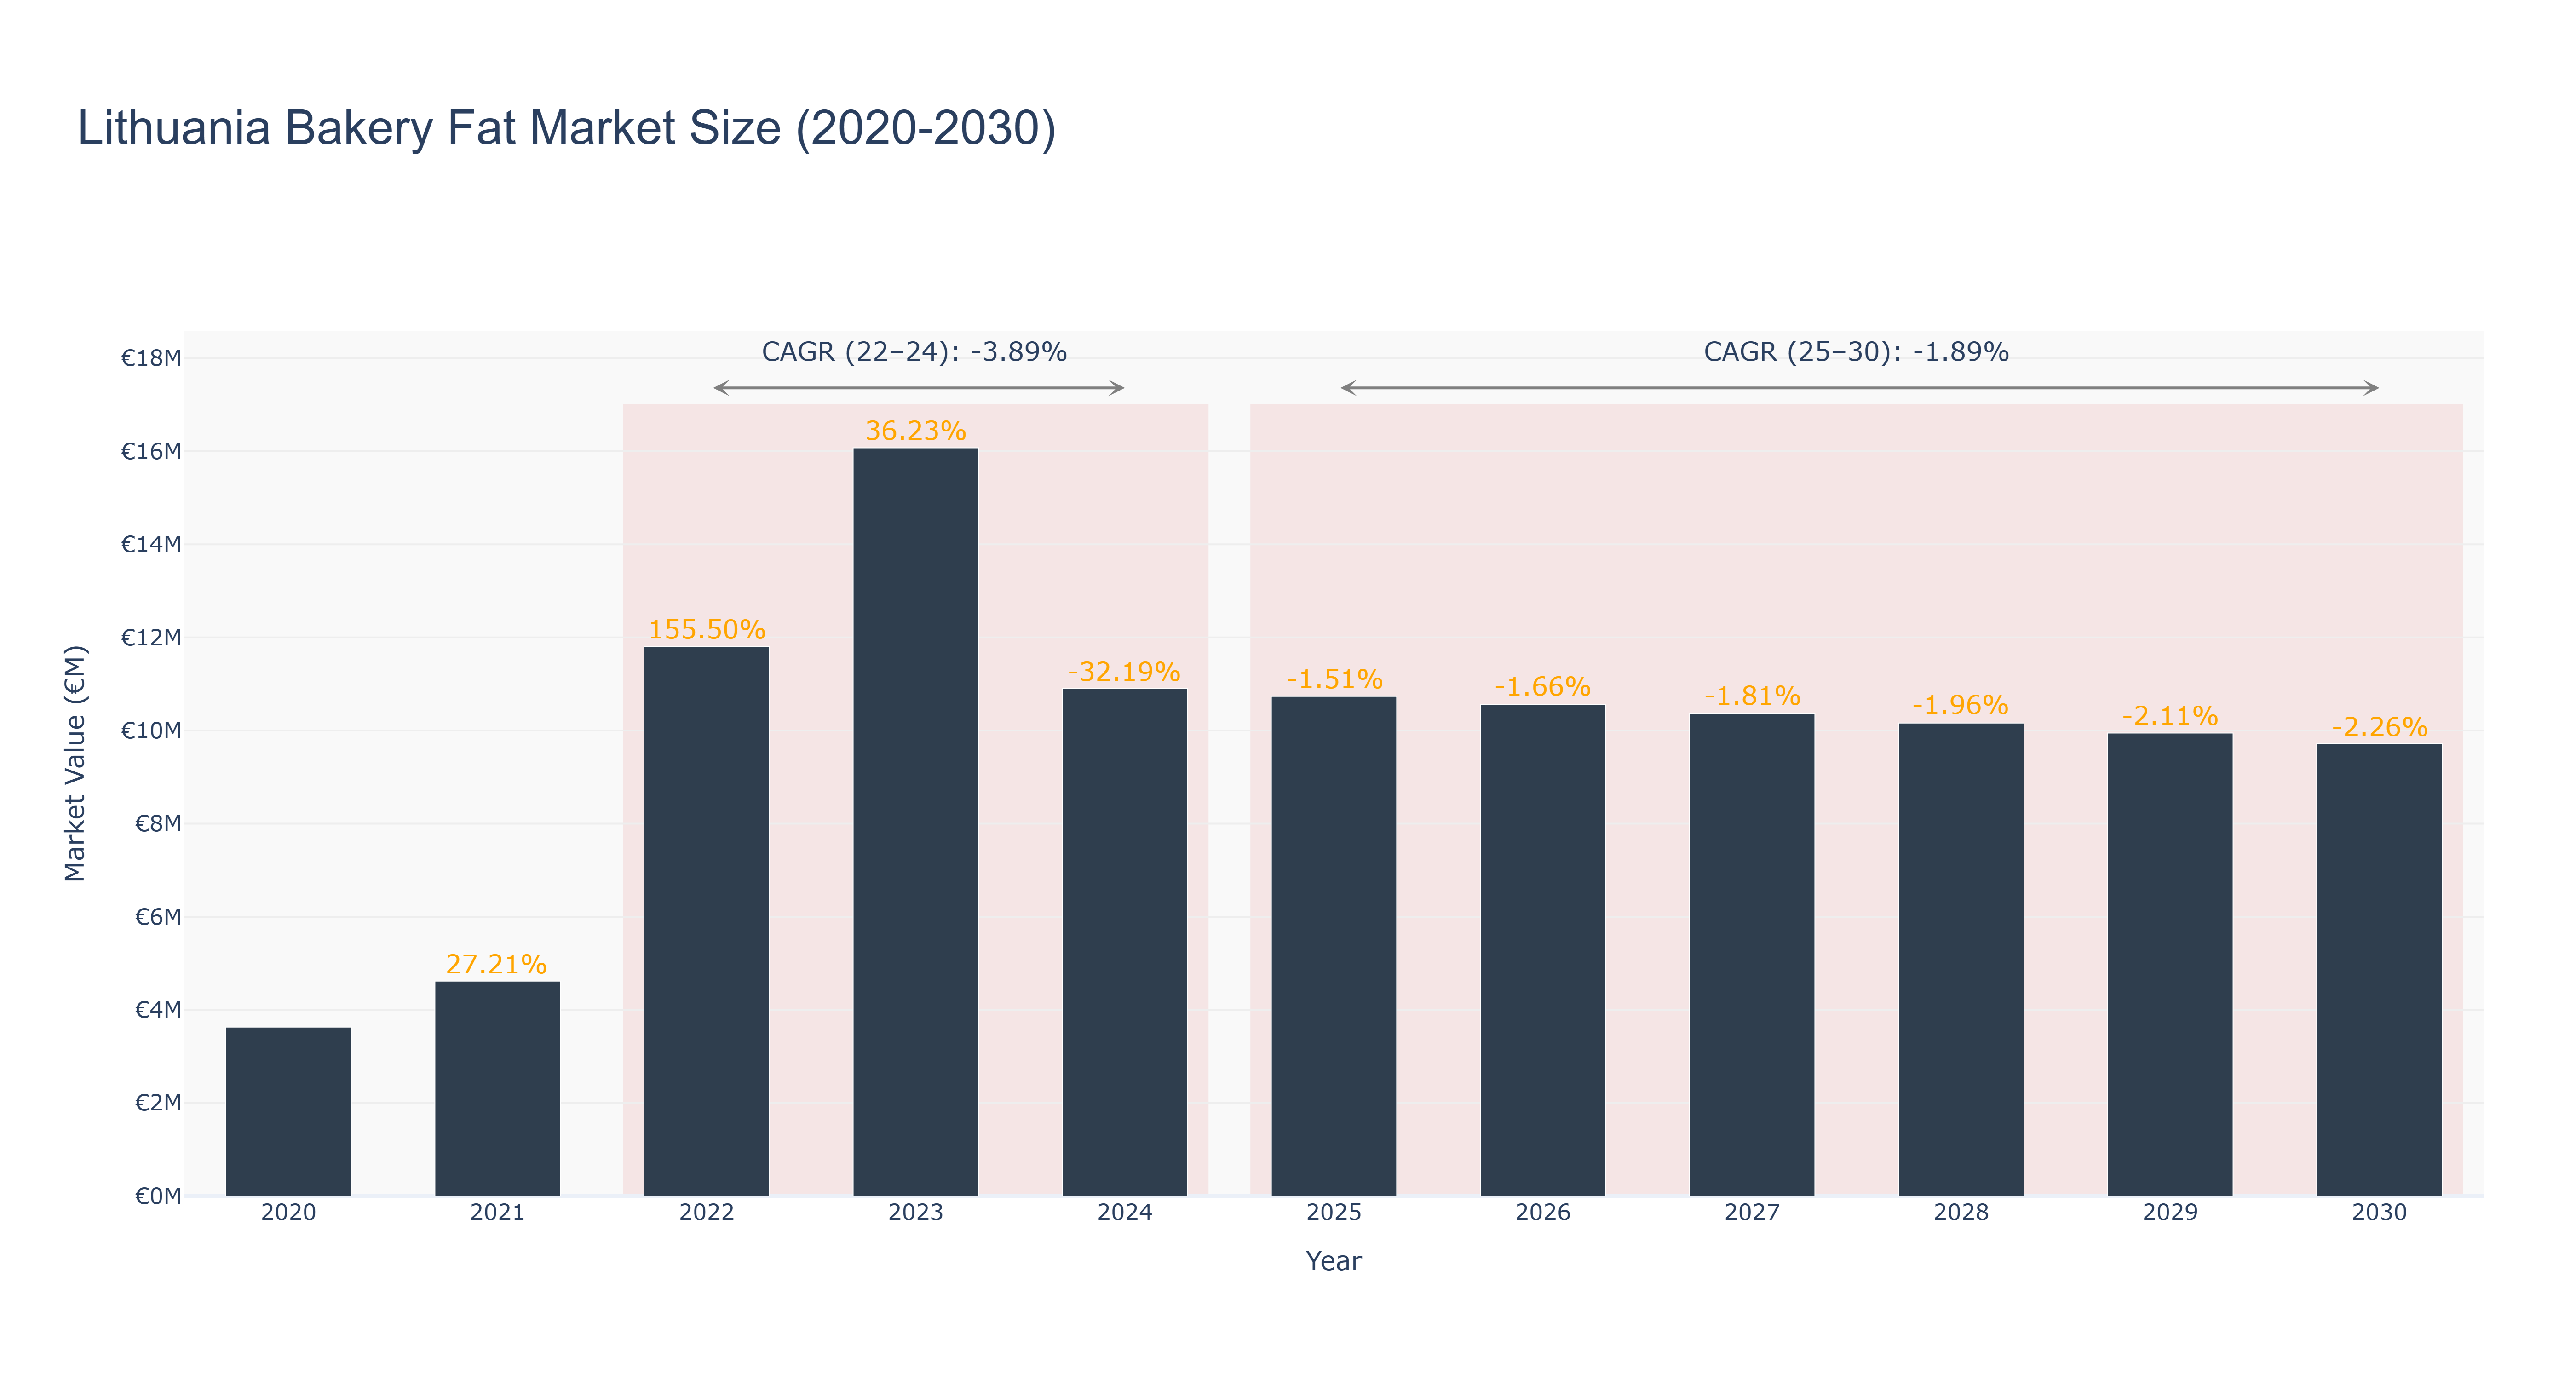
The Lithuania Bakery Fat Market experienced significant growth between 2020 and 2022, peaking at €11.80 million in 2022, a remarkable increase of 155.50% from the previous year. However, the market contracted in 2023 to €16.07 million, reflecting a growth rate of 36.23%, followed by a steep decline to €10.90 million in 2024, resulting in a negative CAGR of -3.89% from 2022 to 2024. Looking forward, the forecasted period from 2025 to 2030 anticipates a further downturn, with projected market sizes diminishing to €9.72 million by 2030 and a CAGR of -1.89%. This decline may be attributed to shifts in consumer preferences towards healthier alternatives and rising input costs. While no specific new projects are indicated, macroeconomic factors, such as the ongoing emphasis on sustainability and health trends, will likely influence market dynamics in the coming years.
Lithuania Bakery Fat Market: Production & Trade Performance (2019-2025)
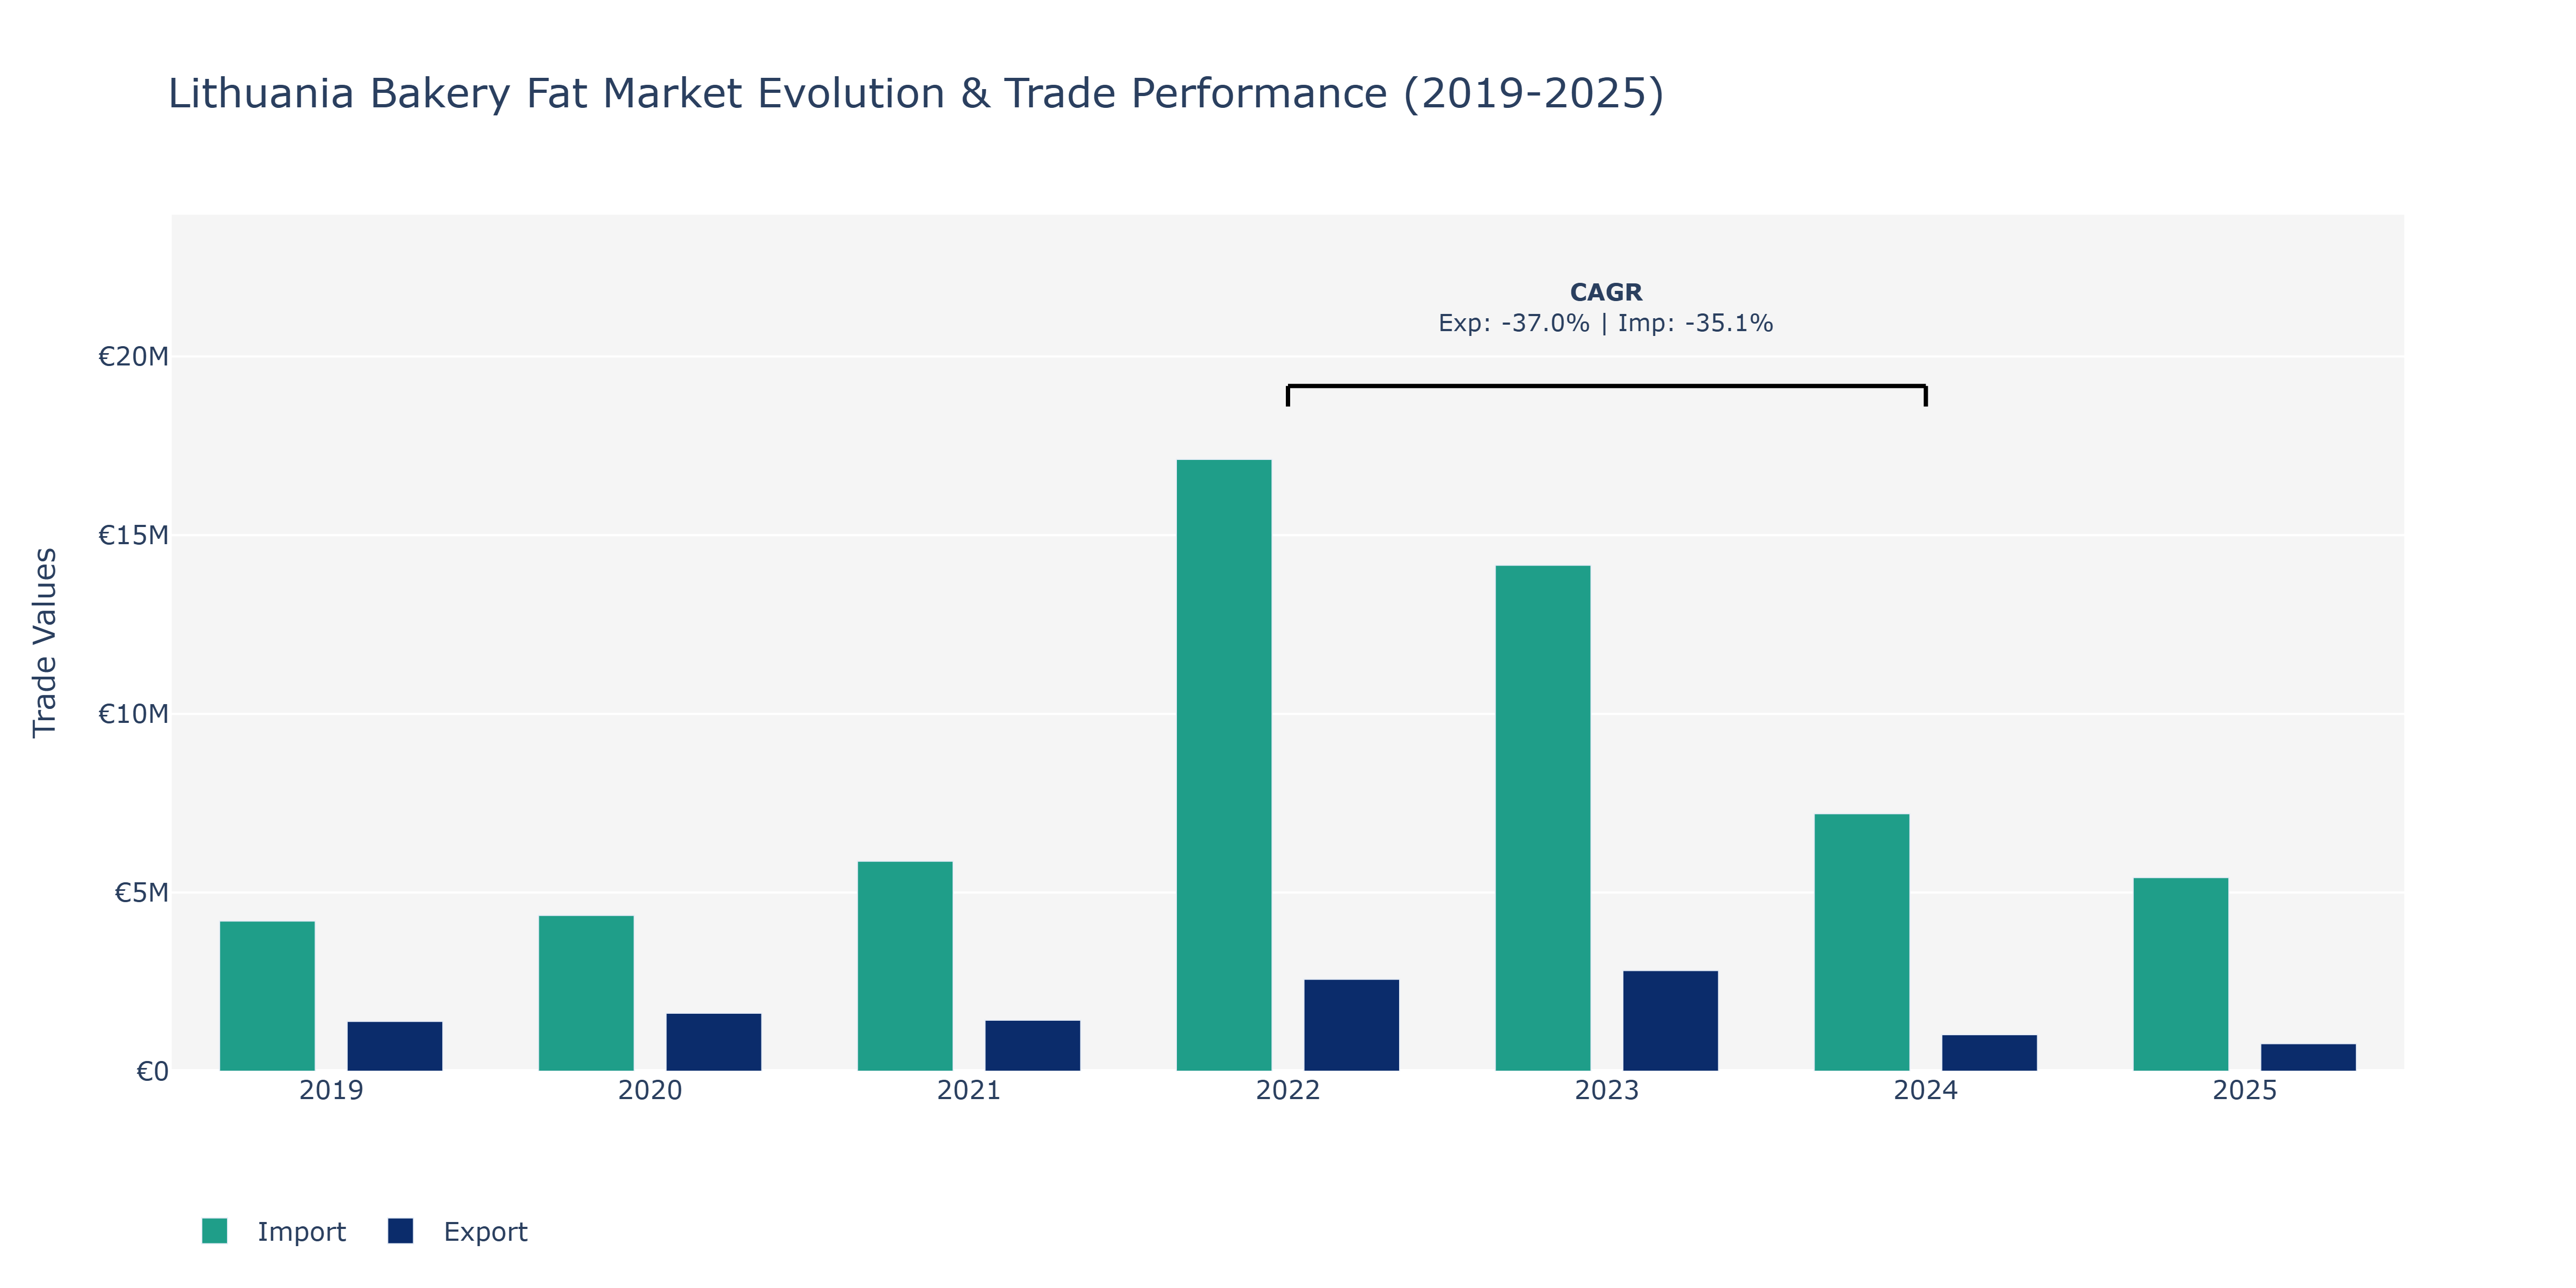
The Lithuania Bakery Fat Market witnessed fluctuations in both exports and imports between 2019 and 2025. In 2022, a significant surge was observed in exports, reaching €2.57 million, while imports peaked at €17.12 million, indicating a potential increase in domestic consumption or production capacity. However, by 2024, exports sharply declined to €1.02 million, possibly due to changes in international demand or competitive pricing strategies. Imports also decreased to €7.21 million during the same period, reflecting adjustments in procurement patterns or shifts in global supply chains. The market may have experienced challenges such as shifting consumer preferences towards healthier alternatives or disruptions in raw material sourcing, impacting trade volumes. To maintain market competitiveness, industry players could focus on product innovation, sustainable sourcing practices, and strategic partnerships with international stakeholders to navigate uncertainties in the global bakery fat landscape.
Key Highlights of the Report:
- Lithuania Bakery Fat Market Outlook
- Market Size of Lithuania Bakery Fat Market, 2025
- Forecast of Lithuania Bakery Fat Market, 2032
- Historical Data and Forecast of Lithuania Bakery Fat Revenues & Volume for the Period 2022 - 2032
- Lithuania Bakery Fat Market Trend Evolution
- Lithuania Bakery Fat Market Drivers and Challenges
- Lithuania Bakery Fat Price Trends
- Lithuania Bakery Fat Porter's Five Forces
- Lithuania Bakery Fat Industry Life Cycle
- Historical Data and Forecast of Lithuania Bakery Fat Market Revenues & Volume By Type for the Period 2022 - 2032
- Historical Data and Forecast of Lithuania Bakery Fat Market Revenues & Volume By Shortening for the Period 2022 - 2032
- Historical Data and Forecast of Lithuania Bakery Fat Market Revenues & Volume By Margarine for the Period 2022 - 2032
- Historical Data and Forecast of Lithuania Bakery Fat Market Revenues & Volume By Bakery Oils for the Period 2022 - 2032
- Historical Data and Forecast of Lithuania Bakery Fat Market Revenues & Volume By Others for the Period 2022 - 2032
- Historical Data and Forecast of Lithuania Bakery Fat Market Revenues & Volume By End-use for the Period 2022 - 2032
- Historical Data and Forecast of Lithuania Bakery Fat Market Revenues & Volume By Industrial for the Period 2022 - 2032
- Historical Data and Forecast of Lithuania Bakery Fat Market Revenues & Volume By Residential for the Period 2022 - 2032
- Historical Data and Forecast of Lithuania Bakery Fat Market Revenues & Volume By Distribution Channel for the Period 2022 - 2032
- Historical Data and Forecast of Lithuania Bakery Fat Market Revenues & Volume By B2B for the Period 2022 - 2032
- Historical Data and Forecast of Lithuania Bakery Fat Market Revenues & Volume By B2C for the Period 2022 - 2032
- Historical Data and Forecast of Lithuania Bakery Fat Market Revenues & Volume By Online Retailing for the Period 2022 - 2032
- Lithuania Bakery Fat Import Export Trade Statistics
- Market Opportunity Assessment By Type
- Market Opportunity Assessment By End-use
- Market Opportunity Assessment By Distribution Channel
- Lithuania Bakery Fat Top Companies Market Share
- Lithuania Bakery Fat Competitive Benchmarking By Technical and Operational Parameters
- Lithuania Bakery Fat Company Profiles
- Lithuania Bakery Fat Key Strategic Recommendations
Frequently Asked Questions About the Market Study (FAQs):
6Wresearch actively monitors the Lithuania Bakery Fat Market and publishes its comprehensive annual report, highlighting emerging trends, growth drivers, revenue analysis, and forecast outlook. Our insights help businesses to make data-backed strategic decisions with ongoing market dynamics. Our analysts track relevent industries related to the Lithuania Bakery Fat Market, allowing our clients with actionable intelligence and reliable forecasts tailored to emerging regional needs.
Yes, we provide customisation as per your requirements. To learn more, feel free to contact us on sales@6wresearch.com
1 Executive Summary |
2 Introduction |
2.1 Key Highlights of the Report |
2.2 Report Description |
2.3 Market Scope & Segmentation |
2.4 Research Methodology |
2.5 Assumptions |
3 Lithuania Bakery Fat Market Overview |
3.1 Lithuania Country Macro Economic Indicators |
3.2 Lithuania Bakery Fat Market Revenues & Volume, 2022 & 2032F |
3.3 Lithuania Bakery Fat Market - Industry Life Cycle |
3.4 Lithuania Bakery Fat Market - Porter's Five Forces |
3.5 Lithuania Bakery Fat Market Revenues & Volume Share, By Type, 2022 & 2032F |
3.6 Lithuania Bakery Fat Market Revenues & Volume Share, By End-use, 2022 & 2032F |
3.7 Lithuania Bakery Fat Market Revenues & Volume Share, By Distribution Channel, 2022 & 2032F |
4 Lithuania Bakery Fat Market Dynamics |
4.1 Impact Analysis |
4.2 Market Drivers |
4.2.1 Increasing consumer demand for convenience food products |
4.2.2 Growing popularity of baked goods and pastries |
4.2.3 Rising disposable incomes leading to higher spending on premium bakery products |
4.3 Market Restraints |
4.3.1 Fluctuating prices of raw materials such as palm oil and soybean oil |
4.3.2 Stringent government regulations on the use of trans fats in bakery products |
5 Lithuania Bakery Fat Market Trends |
6 Lithuania Bakery Fat Market, By Types |
6.1 Lithuania Bakery Fat Market, By Type |
6.1.1 Overview and Analysis |
6.1.2 Lithuania Bakery Fat Market Revenues & Volume, By Type, 2022 - 2032F |
6.1.3 Lithuania Bakery Fat Market Revenues & Volume, By Shortening, 2022 - 2032F |
6.1.4 Lithuania Bakery Fat Market Revenues & Volume, By Margarine, 2022 - 2032F |
6.1.5 Lithuania Bakery Fat Market Revenues & Volume, By Bakery Oils, 2022 - 2032F |
6.1.6 Lithuania Bakery Fat Market Revenues & Volume, By Others, 2022 - 2032F |
6.2 Lithuania Bakery Fat Market, By End-use |
6.2.1 Overview and Analysis |
6.2.2 Lithuania Bakery Fat Market Revenues & Volume, By Industrial, 2022 - 2032F |
6.2.3 Lithuania Bakery Fat Market Revenues & Volume, By Residential, 2022 - 2032F |
6.3 Lithuania Bakery Fat Market, By Distribution Channel |
6.3.1 Overview and Analysis |
6.3.2 Lithuania Bakery Fat Market Revenues & Volume, By B2B, 2022 - 2032F |
6.3.3 Lithuania Bakery Fat Market Revenues & Volume, By B2C, 2022 - 2032F |
6.3.4 Lithuania Bakery Fat Market Revenues & Volume, By Online Retailing, 2022 - 2032F |
7 Lithuania Bakery Fat Market Import-Export Trade Statistics |
7.1 Lithuania Bakery Fat Market Export to Major Countries |
7.2 Lithuania Bakery Fat Market Imports from Major Countries |
8 Lithuania Bakery Fat Market Key Performance Indicators |
8.1 Average selling price of bakery fats |
8.2 Number of new product launches in the bakery fat market |
8.3 Consumer sentiment towards healthier bakery fat alternatives |
9 Lithuania Bakery Fat Market - Opportunity Assessment |
9.1 Lithuania Bakery Fat Market Opportunity Assessment, By Type, 2022 & 2032F |
9.2 Lithuania Bakery Fat Market Opportunity Assessment, By End-use, 2022 & 2032F |
9.3 Lithuania Bakery Fat Market Opportunity Assessment, By Distribution Channel, 2022 & 2032F |
10 Lithuania Bakery Fat Market - Competitive Landscape |
10.1 Lithuania Bakery Fat Market Revenue Share, By Companies, 2025 |
10.2 Lithuania Bakery Fat Market Competitive Benchmarking, By Operating and Technical Parameters |
11 Company Profiles |
12 Recommendations |
13 Disclaimer |
Export potential assessment - trade Analytics for 2030
Export potential enables firms to identify high-growth global markets with greater confidence by combining advanced trade intelligence with a structured quantitative methodology. The framework analyzes emerging demand trends and country-level import patterns while integrating macroeconomic and trade datasets such as GDP and population forecasts, bilateral import–export flows, tariff structures, elasticity differentials between developed and developing economies, geographic distance, and import demand projections. Using weighted trade values from 2020–2024 as the base period to project country-to-country export potential for 2030, these inputs are operationalized through calculated drivers such as gravity model parameters, tariff impact factors, and projected GDP per-capita growth. Through an analysis of hidden potentials, demand hotspots, and market conditions that are most favorable to success, this method enables firms to focus on target countries, maximize returns, and global expansion with data, backed by accuracy.
By factoring in the projected importer demand gap that is currently unmet and could be potential opportunity, it identifies the potential for the Exporter (Country) among 190 countries, against the general trade analysis, which identifies the biggest importer or exporter.
To discover high-growth global markets and optimize your business strategy:
Click Here
Pricing
- Single User License$ 1,995
- Department License$ 2,400
- Site License$ 3,120
- Global License$ 3,795

Search
Thought Leadership and Analyst Meet


Our Clients
Latest Reports
- Philippines Polyhydroxybutyrate-co-Hydroxyvalerate Market (2026-2032) | Trends, Insights, Challenges, Restraints, Competition, Size, Value, Forecast, Pricing, Share, Outlook, Revenue, Investment Opportunities, Strategy, Drivers, Demand, Growth, segmentation, Analysis, Companies
- Peru Polyhydroxybutyrate-co-Hydroxyvalerate Market (2026-2032) | Growth, Demand, Challenges, Share, Trends, Analysis, Pricing, Investment Opportunities, Drivers, Value, Forecast, Competition, Size, Companies, Insights, Outlook, Restraints, segmentation, Revenue, Strategy
- Pakistan Polyhydroxybutyrate-co-Hydroxyvalerate Market (2026-2032) | Restraints, segmentation, Pricing, Forecast, Share, Strategy, Competition, Trends, Insights, Drivers, Challenges, Growth, Revenue, Outlook, Value, Investment Opportunities, Companies, Size, Analysis, Demand
- Oman Polyhydroxybutyrate-co-Hydroxyvalerate Market (2026-2032) | Drivers, segmentation, Insights, Competition, Pricing, Outlook, Size, Revenue, Challenges, Forecast, Analysis, Growth, Value, Share, Trends, Investment Opportunities, Strategy, Restraints, Companies, Demand
- Nigeria Polyhydroxybutyrate-co-Hydroxyvalerate Market (2026-2032) | Value, Investment Opportunities, Analysis, Revenue, Restraints, Pricing, Outlook, Competition, Demand, Growth, Forecast, Companies, Trends, Challenges, segmentation, Drivers, Insights, Share, Size, Strategy
- Nepal Polyhydroxybutyrate-co-Hydroxyvalerate Market (2026-2032) | Insights, Analysis, Drivers, Share, Revenue, Demand, segmentation, Investment Opportunities, Competition, Forecast, Growth, Pricing, Companies, Strategy, Trends, Restraints, Challenges, Outlook, Size, Value
- Myanmar Polyhydroxybutyrate-co-Hydroxyvalerate Market (2026-2032) | Outlook, Revenue, Strategy, Restraints, Drivers, segmentation, Share, Forecast, Competition, Insights, Growth, Pricing, Size, Demand, Value, Companies, Trends, Challenges, Investment Opportunities, Analysis
- Morocco Polyhydroxybutyrate-co-Hydroxyvalerate Market (2026-2032) | Outlook, Investment Opportunities, Restraints, Strategy, Forecast, Challenges, Drivers, Growth, Companies, segmentation, Trends, Size, Competition, Revenue, Demand, Insights, Share, Analysis, Value, Pricing
- Mexico Polyhydroxybutyrate-co-Hydroxyvalerate Market (2026-2032) | Size, Drivers, Outlook, Share, Strategy, Growth, Pricing, Challenges, Companies, Demand, Value, Investment Opportunities, Restraints, Trends, Forecast, segmentation, Analysis, Insights, Competition, Revenue
- Malaysia Polyhydroxybutyrate-co-Hydroxyvalerate Market (2026-2032) | Share, segmentation, Size, Companies, Analysis, Insights, Forecast, Value, Revenue, Drivers, Restraints, Challenges, Investment Opportunities, Trends, Competition, Strategy, Demand, Growth, Outlook, Pricing
Industry Events and Analyst Meet

HIMTEX 2026

India Refining Summit 2026

India EV Show 2026

EV tech India Expo 2026

Auto Tech Asia 2026
Whitepaper
- Middle East & Africa Commercial Security Market Click here to view more.
- Middle East & Africa Fire Safety Systems & Equipment Market Click here to view more.
- GCC Drone Market Click here to view more.
- Middle East Lighting Fixture Market Click here to view more.
- GCC Physical & Perimeter Security Market Click here to view more.
6WResearch In News
- Doha a strategic location for EV manufacturing hub: IPA Qatar
- Demand for luxury TVs surging in the GCC, says Samsung
- Empowering Growth: The Thriving Journey of Bangladesh’s Cable Industry
- Demand for luxury TVs surging in the GCC, says Samsung
- Video call with a traditional healer? Once unthinkable, it’s now common in South Africa
- Intelligent Buildings To Smooth GCC’s Path To Net Zero