Lithuania Bio-Based Lubricants Market (2026-2032) | Opportunities, Competitive, Competition, Value, Segments, Outlook, Investment Trends, Size, Forecast, Restraints, Consumer Insights, Analysis, Trends, Companies, Pricing Analysis, Industry, Revenue, Strategy, Drivers, Challenges, Demand, Strategic Insights, Growth, Segmentation, Share, Supply
Market Forecast By Lubricant Type (Hydraulic Oils, Gear Oils, Engine Oils), By Application (Machinery, Automotives, Marine), By End User (Industrial, Automotive, Transportation), By Source (Corn-Based, Biomass, Plant-Based), By Environmental Impact (Biodegradable, Low Carbon Footprint, Renewable) And Competitive Landscape
| Product Code: ETC11446266 | Publication Date: Apr 2025 | Updated Date: Apr 2026 | Product Type: Market Research Report | |
| Publisher: 6Wresearch | No. of Pages: 65 | No. of Figures: 34 | No. of Tables: 19 | |
Lithuania Bio-Based Lubricants Market Size (2020-2030)
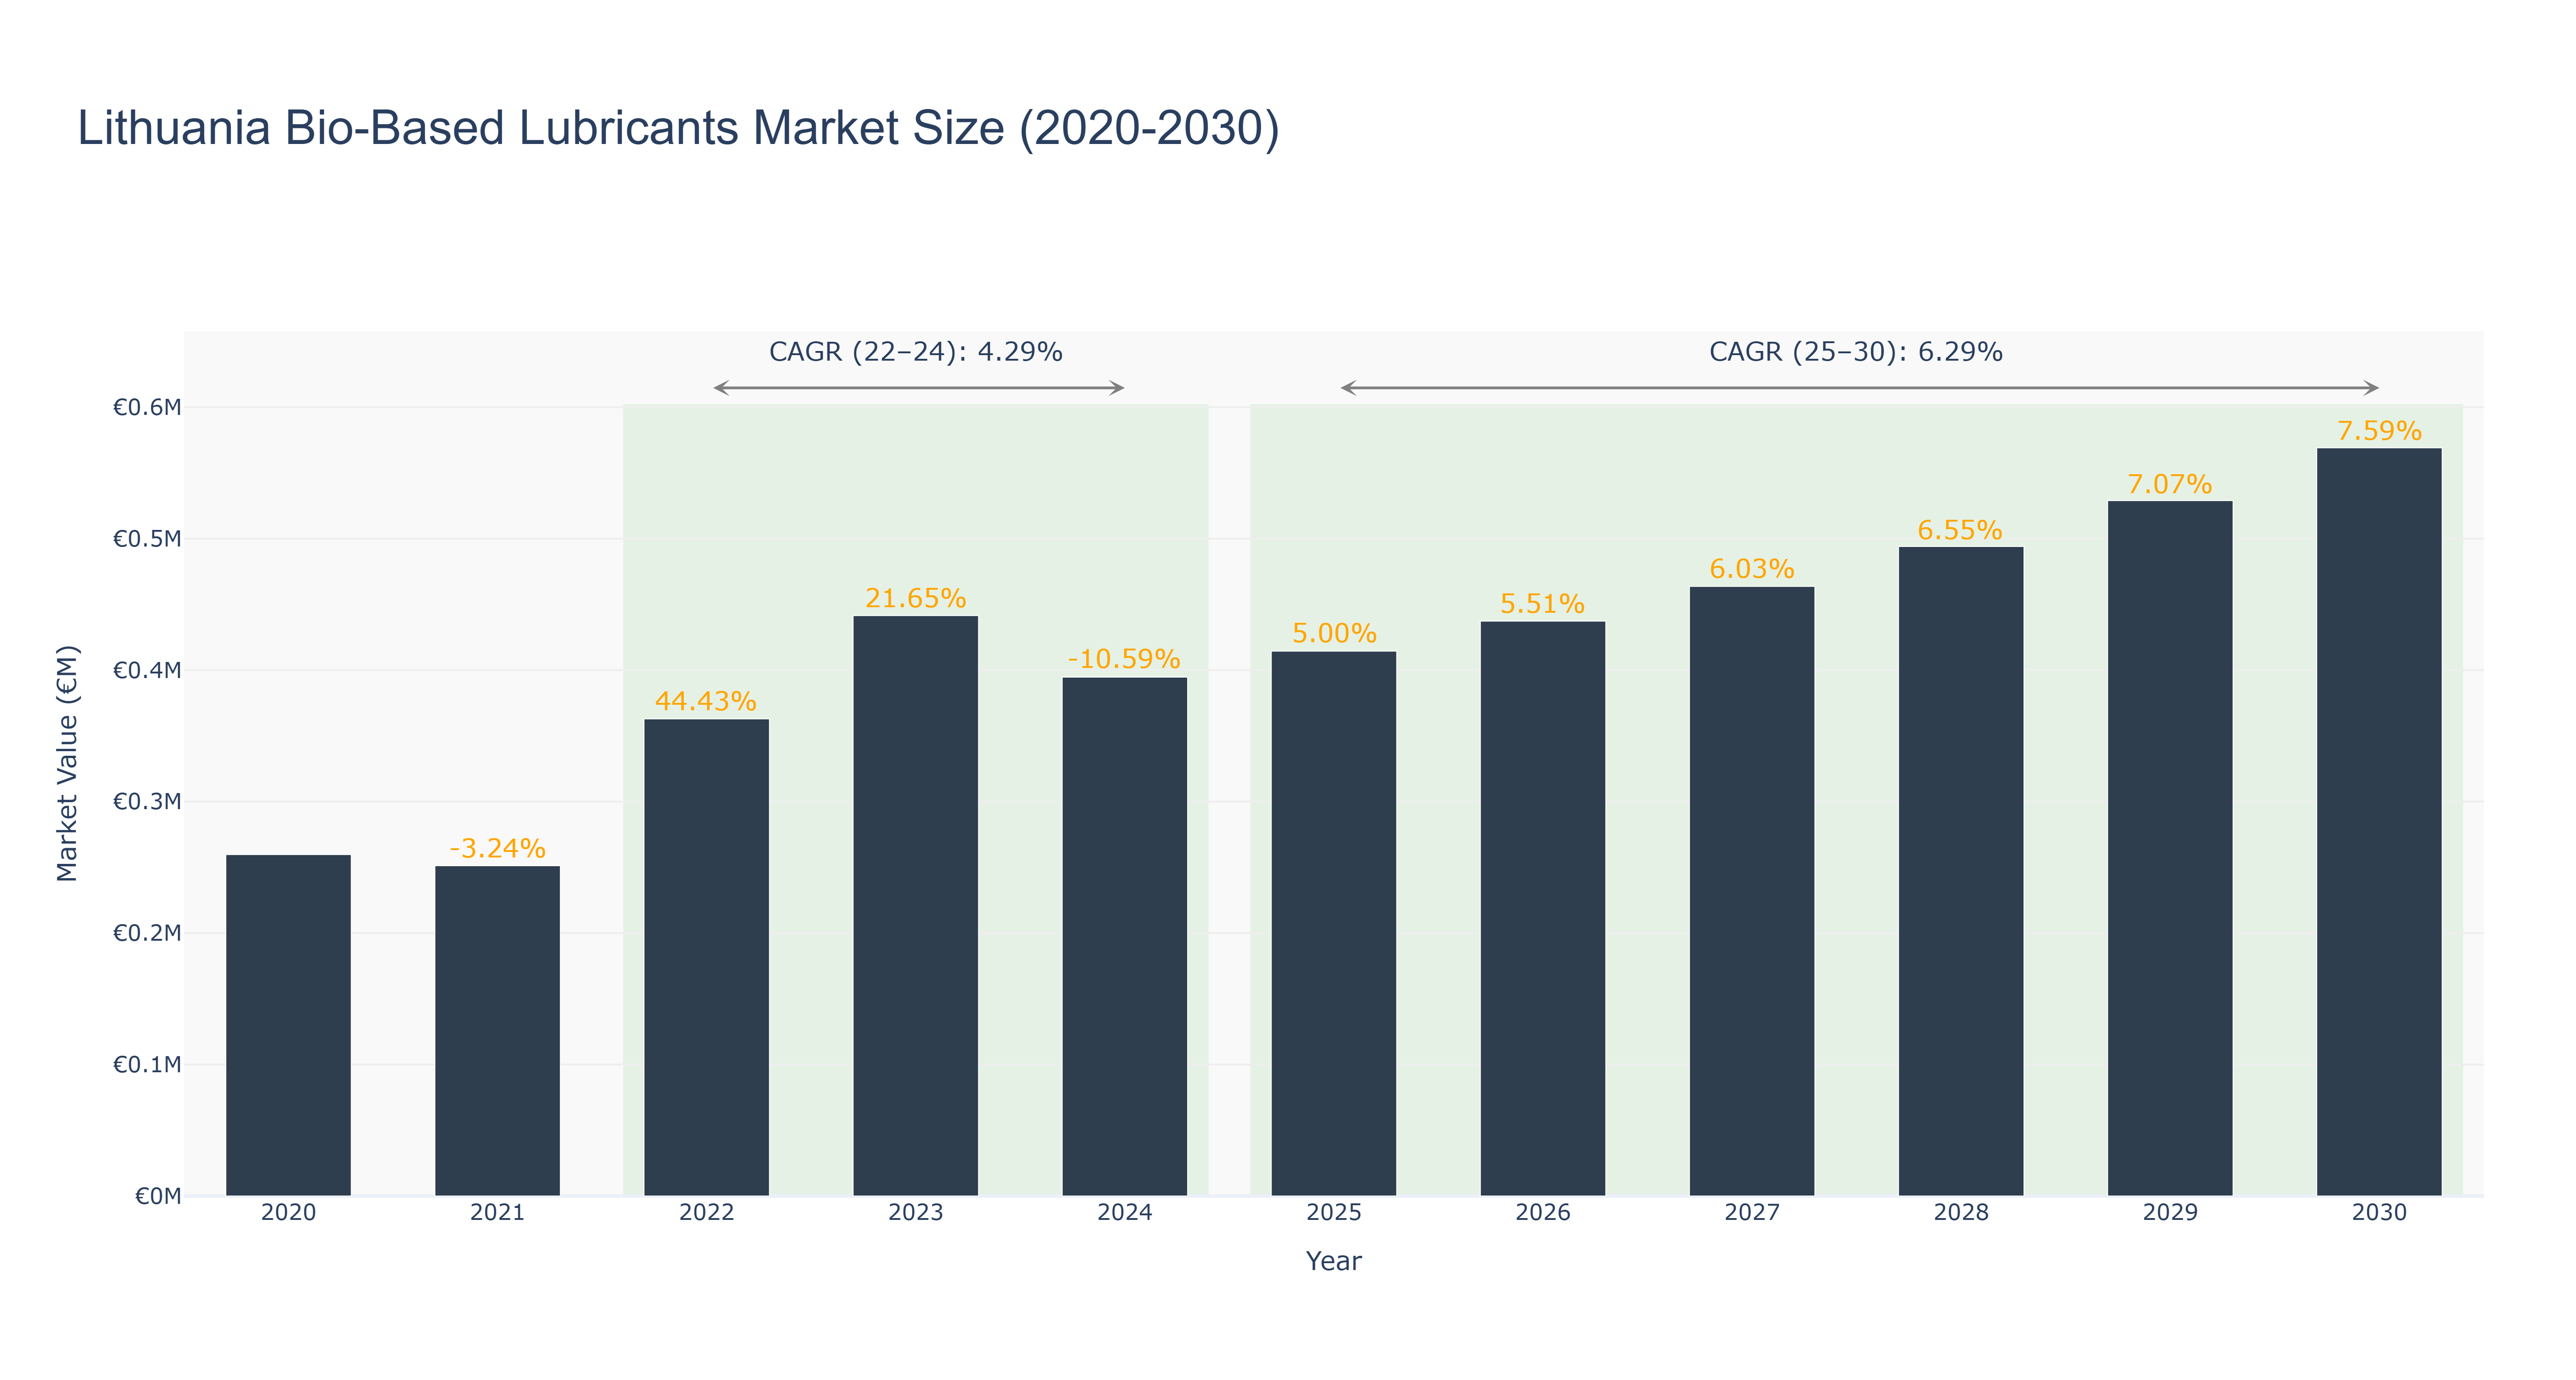
The Lithuania Bio-Based Lubricants Market has shown a fluctuating trend over the past decade. The market peaked at €0.57 million in 2030, with a steady growth rate of 7.59% annually. From 2020 to 2024, the market size decreased from €0.26 million to €0.39 million, primarily due to economic uncertainties impacting consumer spending. However, from 2025 to 2030, the market is forecasted to grow at a CAGR of 6.29%, driven by increasing demand for eco-friendly lubricants in the automotive and industrial sectors. Recent developments in Lithuania include government initiatives to promote sustainable practices, which are expected to further boost the bio-based lubricants market in the country. Looking ahead, collaborations between local manufacturers and international players are anticipated to drive innovation and market expansion in the near future.
Lithuania Bio-Based Lubricants Market: Production & Trade Performance (2019-2025)
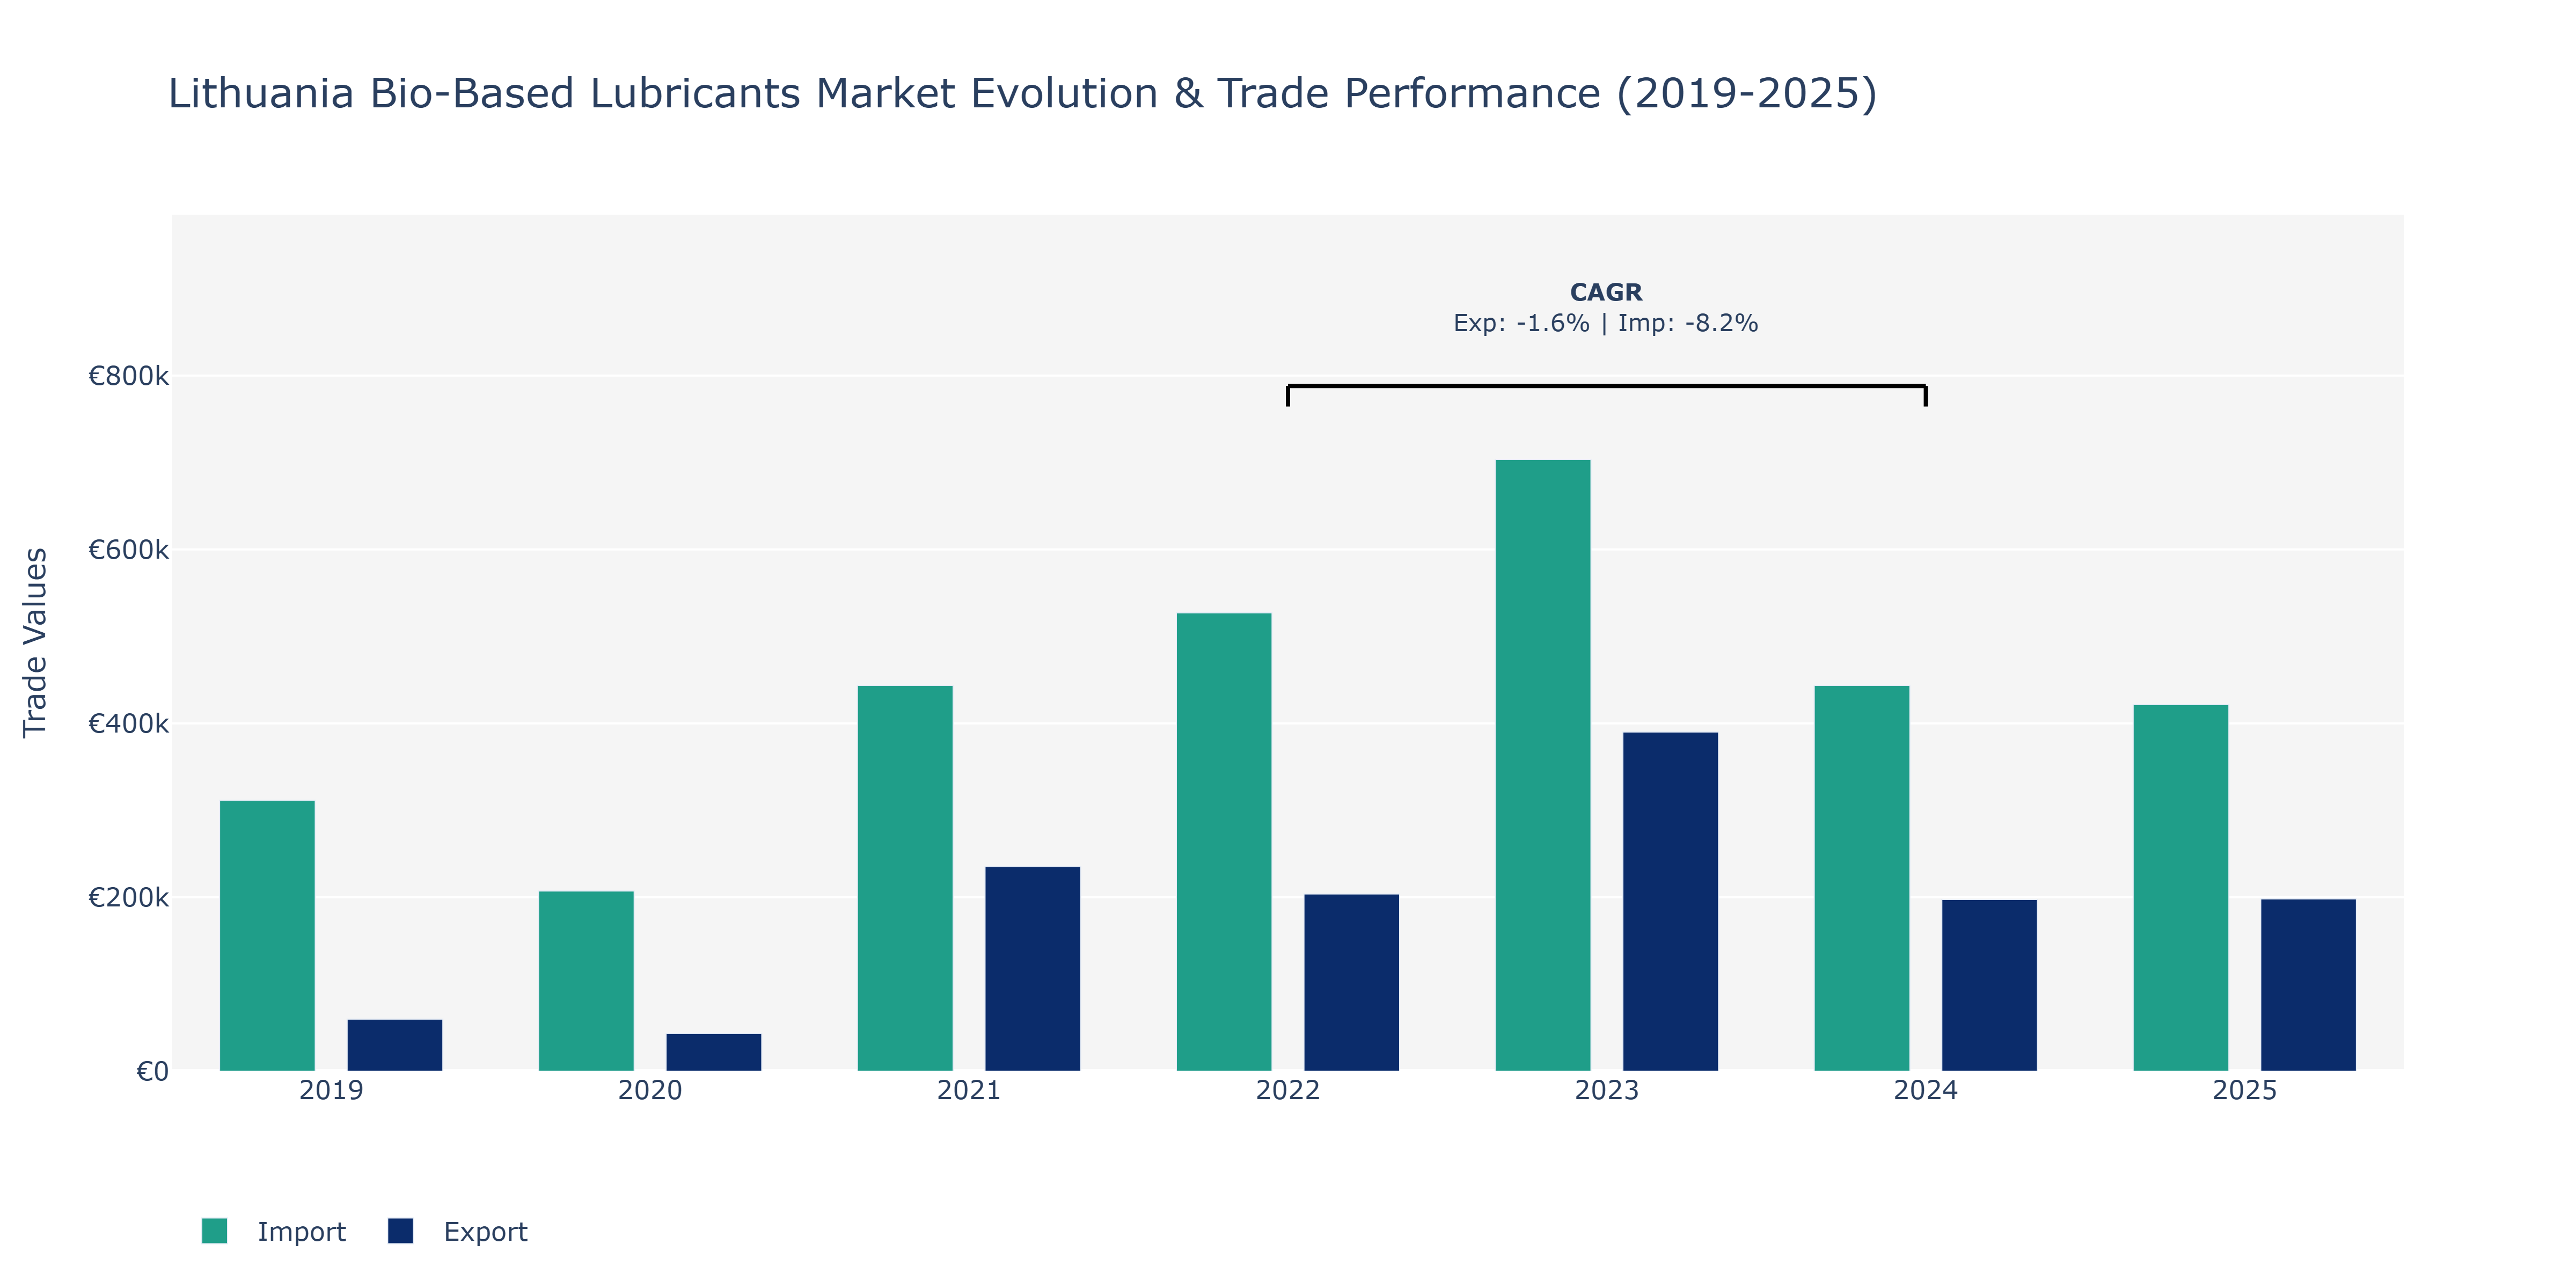
The Lithuania Bio-Based Lubricants Market witnessed fluctuations in both Exports and Imports from 2019 to 2025. In 2019, Exports stood at €59.82 thousand and Imports at a substantially higher €311.56 thousand. The following year saw a decline in both values, with Exports decreasing to €43.28 thousand and Imports falling to €207.17 thousand. However, a significant turnaround occurred in 2021 when Exports surged to €235.24 thousand and Imports to €443.71 thousand, indicating a strong upward trend driven by potentially increased demand for eco-friendly lubricants in the market. Despite a slight dip in 2022, both Exports (€203.86 thousand) and Imports (€527.03 thousand) rebounded in 2023, reaching €389.98 thousand and €703.6 thousand, respectively. Interestingly, 2024 saw a substantial drop in Exports to €197.48 thousand, while Imports remained relatively stable at €443.77 thousand. By 2025, Exports slightly recovered to €198.14 thousand, whereas Imports decreased marginally to €421.48 thousand, suggesting a stabilization in trade flows within the market. The fluctuations in Exports and Imports can be attributed to various factors such as changes in global demand for bio-based lubricants, shifts in regulatory policies promoting environmentally friendly products, and developments in the competitiveness of the domestic bio-based lubricants industry. To further capitalize on the growth potential of the market, stakeholders could focus on enhancing product quality, expanding distribution networks, and fostering innovation in sustainable lubricant technologies.
Key Highlights of the Report:
- Lithuania Bio-Based Lubricants Market Outlook
- Market Size of Lithuania Bio-Based Lubricants Market, 2025
- Forecast of Lithuania Bio-Based Lubricants Market, 2032
- Historical Data and Forecast of Lithuania Bio-Based Lubricants Revenues & Volume for the Period 2022 - 2032F
- Lithuania Bio-Based Lubricants Market Trend Evolution
- Lithuania Bio-Based Lubricants Market Drivers and Challenges
- Lithuania Bio-Based Lubricants Price Trends
- Lithuania Bio-Based Lubricants Porter's Five Forces
- Lithuania Bio-Based Lubricants Industry Life Cycle
- Historical Data and Forecast of Lithuania Bio-Based Lubricants Market Revenues & Volume By Lubricant Type for the Period 2022 - 2032F
- Historical Data and Forecast of Lithuania Bio-Based Lubricants Market Revenues & Volume By Hydraulic Oils for the Period 2022 - 2032F
- Historical Data and Forecast of Lithuania Bio-Based Lubricants Market Revenues & Volume By Gear Oils for the Period 2022 - 2032F
- Historical Data and Forecast of Lithuania Bio-Based Lubricants Market Revenues & Volume By Engine Oils for the Period 2022 - 2032F
- Historical Data and Forecast of Lithuania Bio-Based Lubricants Market Revenues & Volume By Application for the Period 2022 - 2032F
- Historical Data and Forecast of Lithuania Bio-Based Lubricants Market Revenues & Volume By Machinery for the Period 2022 - 2032F
- Historical Data and Forecast of Lithuania Bio-Based Lubricants Market Revenues & Volume By Automotives for the Period 2022 - 2032F
- Historical Data and Forecast of Lithuania Bio-Based Lubricants Market Revenues & Volume By Marine for the Period 2022 - 2032F
- Historical Data and Forecast of Lithuania Bio-Based Lubricants Market Revenues & Volume By End User for the Period 2022 - 2032F
- Historical Data and Forecast of Lithuania Bio-Based Lubricants Market Revenues & Volume By Industrial for the Period 2022 - 2032F
- Historical Data and Forecast of Lithuania Bio-Based Lubricants Market Revenues & Volume By Automotive for the Period 2022 - 2032F
- Historical Data and Forecast of Lithuania Bio-Based Lubricants Market Revenues & Volume By Transportation for the Period 2022 - 2032F
- Historical Data and Forecast of Lithuania Bio-Based Lubricants Market Revenues & Volume By Source for the Period 2022 - 2032F
- Historical Data and Forecast of Lithuania Bio-Based Lubricants Market Revenues & Volume By Corn-Based for the Period 2022 - 2032F
- Historical Data and Forecast of Lithuania Bio-Based Lubricants Market Revenues & Volume By Biomass for the Period 2022 - 2032F
- Historical Data and Forecast of Lithuania Bio-Based Lubricants Market Revenues & Volume By Plant-Based for the Period 2022 - 2032F
- Historical Data and Forecast of Lithuania Bio-Based Lubricants Market Revenues & Volume By Environmental Impact for the Period 2022 - 2032F
- Historical Data and Forecast of Lithuania Bio-Based Lubricants Market Revenues & Volume By Biodegradable for the Period 2022 - 2032F
- Historical Data and Forecast of Lithuania Bio-Based Lubricants Market Revenues & Volume By Low Carbon Footprint for the Period 2022 - 2032F
- Historical Data and Forecast of Lithuania Bio-Based Lubricants Market Revenues & Volume By Renewable for the Period 2022 - 2032F
- Lithuania Bio-Based Lubricants Import Export Trade Statistics
- Market Opportunity Assessment By Lubricant Type
- Market Opportunity Assessment By Application
- Market Opportunity Assessment By End User
- Market Opportunity Assessment By Source
- Market Opportunity Assessment By Environmental Impact
- Lithuania Bio-Based Lubricants Top Companies Market Share
- Lithuania Bio-Based Lubricants Competitive Benchmarking By Technical and Operational Parameters
- Lithuania Bio-Based Lubricants Company Profiles
- Lithuania Bio-Based Lubricants Key Strategic Recommendations
Frequently Asked Questions About the Market Study (FAQs):
6Wresearch actively monitors the Lithuania Bio-Based Lubricants Market and publishes its comprehensive annual report, highlighting emerging trends, growth drivers, revenue analysis, and forecast outlook. Our insights help businesses to make data-backed strategic decisions with ongoing market dynamics. Our analysts track relevent industries related to the Lithuania Bio-Based Lubricants Market, allowing our clients with actionable intelligence and reliable forecasts tailored to emerging regional needs.
Yes, we provide customisation as per your requirements. To learn more, feel free to contact us on sales@6wresearch.com
1 Executive Summary |
2 Introduction |
2.1 Key Highlights of the Report |
2.2 Report Description |
2.3 Market Scope & Segmentation |
2.4 Research Methodology |
2.5 Assumptions |
3 Lithuania Bio-Based Lubricants Market Overview |
3.1 Lithuania Country Macro Economic Indicators |
3.2 Lithuania Bio-Based Lubricants Market Revenues & Volume, 2022 & 2032F |
3.3 Lithuania Bio-Based Lubricants Market - Industry Life Cycle |
3.4 Lithuania Bio-Based Lubricants Market - Porter's Five Forces |
3.5 Lithuania Bio-Based Lubricants Market Revenues & Volume Share, By Lubricant Type, 2022 & 2032F |
3.6 Lithuania Bio-Based Lubricants Market Revenues & Volume Share, By Application, 2022 & 2032F |
3.7 Lithuania Bio-Based Lubricants Market Revenues & Volume Share, By End User, 2022 & 2032F |
3.8 Lithuania Bio-Based Lubricants Market Revenues & Volume Share, By Source, 2022 & 2032F |
3.9 Lithuania Bio-Based Lubricants Market Revenues & Volume Share, By Environmental Impact, 2022 & 2032F |
4 Lithuania Bio-Based Lubricants Market Dynamics |
4.1 Impact Analysis |
4.2 Market Drivers |
4.2.1 Increasing environmental concerns and regulations promoting the use of bio-based lubricants. |
4.2.2 Growing awareness among consumers about the benefits of bio-based lubricants in terms of sustainability and performance. |
4.2.3 Technological advancements leading to the development of more efficient bio-based lubricant products. |
4.3 Market Restraints |
4.3.1 Higher initial cost compared to conventional lubricants. |
4.3.2 Limited availability and variety of bio-based lubricants in the market. |
4.3.3 Challenges related to compatibility with existing equipment and machinery. |
5 Lithuania Bio-Based Lubricants Market Trends |
6 Lithuania Bio-Based Lubricants Market, By Types |
6.1 Lithuania Bio-Based Lubricants Market, By Lubricant Type |
6.1.1 Overview and Analysis |
6.1.2 Lithuania Bio-Based Lubricants Market Revenues & Volume, By Lubricant Type, 2022 - 2032F |
6.1.3 Lithuania Bio-Based Lubricants Market Revenues & Volume, By Hydraulic Oils, 2022 - 2032F |
6.1.4 Lithuania Bio-Based Lubricants Market Revenues & Volume, By Gear Oils, 2022 - 2032F |
6.1.5 Lithuania Bio-Based Lubricants Market Revenues & Volume, By Engine Oils, 2022 - 2032F |
6.2 Lithuania Bio-Based Lubricants Market, By Application |
6.2.1 Overview and Analysis |
6.2.2 Lithuania Bio-Based Lubricants Market Revenues & Volume, By Machinery, 2022 - 2032F |
6.2.3 Lithuania Bio-Based Lubricants Market Revenues & Volume, By Automotives, 2022 - 2032F |
6.2.4 Lithuania Bio-Based Lubricants Market Revenues & Volume, By Marine, 2022 - 2032F |
6.3 Lithuania Bio-Based Lubricants Market, By End User |
6.3.1 Overview and Analysis |
6.3.2 Lithuania Bio-Based Lubricants Market Revenues & Volume, By Industrial, 2022 - 2032F |
6.3.3 Lithuania Bio-Based Lubricants Market Revenues & Volume, By Automotive, 2022 - 2032F |
6.3.4 Lithuania Bio-Based Lubricants Market Revenues & Volume, By Transportation, 2022 - 2032F |
6.4 Lithuania Bio-Based Lubricants Market, By Source |
6.4.1 Overview and Analysis |
6.4.2 Lithuania Bio-Based Lubricants Market Revenues & Volume, By Corn-Based, 2022 - 2032F |
6.4.3 Lithuania Bio-Based Lubricants Market Revenues & Volume, By Biomass, 2022 - 2032F |
6.4.4 Lithuania Bio-Based Lubricants Market Revenues & Volume, By Plant-Based, 2022 - 2032F |
6.5 Lithuania Bio-Based Lubricants Market, By Environmental Impact |
6.5.1 Overview and Analysis |
6.5.2 Lithuania Bio-Based Lubricants Market Revenues & Volume, By Biodegradable, 2022 - 2032F |
6.5.3 Lithuania Bio-Based Lubricants Market Revenues & Volume, By Low Carbon Footprint, 2022 - 2032F |
6.5.4 Lithuania Bio-Based Lubricants Market Revenues & Volume, By Renewable, 2022 - 2032F |
7 Lithuania Bio-Based Lubricants Market Import-Export Trade Statistics |
7.1 Lithuania Bio-Based Lubricants Market Export to Major Countries |
7.2 Lithuania Bio-Based Lubricants Market Imports from Major Countries |
8 Lithuania Bio-Based Lubricants Market Key Performance Indicators |
8.1 Percentage of companies adopting bio-based lubricants in their operations. |
8.2 Number of research and development initiatives focused on enhancing bio-based lubricant technology. |
8.3 Carbon footprint reduction achieved through the use of bio-based lubricants. |
9 Lithuania Bio-Based Lubricants Market - Opportunity Assessment |
9.1 Lithuania Bio-Based Lubricants Market Opportunity Assessment, By Lubricant Type, 2022 & 2032F |
9.2 Lithuania Bio-Based Lubricants Market Opportunity Assessment, By Application, 2022 & 2032F |
9.3 Lithuania Bio-Based Lubricants Market Opportunity Assessment, By End User, 2022 & 2032F |
9.4 Lithuania Bio-Based Lubricants Market Opportunity Assessment, By Source, 2022 & 2032F |
9.5 Lithuania Bio-Based Lubricants Market Opportunity Assessment, By Environmental Impact, 2022 & 2032F |
10 Lithuania Bio-Based Lubricants Market - Competitive Landscape |
10.1 Lithuania Bio-Based Lubricants Market Revenue Share, By Companies, 2025 |
10.2 Lithuania Bio-Based Lubricants Market Competitive Benchmarking, By Operating and Technical Parameters |
11 Company Profiles |
12 Recommendations |
13 Disclaimer |
Global Go To Market Strategy - 2030
Export potential enables firms to identify high-growth global markets with greater confidence by combining advanced trade intelligence with a structured quantitative methodology. The framework analyzes emerging demand trends and country-level import patterns while integrating macroeconomic and trade datasets such as GDP and population forecasts, bilateral import–export flows, tariff structures, elasticity differentials between developed and developing economies, geographic distance, and import demand projections. Using weighted trade values from 2020–2024 as the base period to project country-to-country export potential for 2030, these inputs are operationalized through calculated drivers such as gravity model parameters, tariff impact factors, and projected GDP per-capita growth. Through an analysis of hidden potentials, demand hotspots, and market conditions that are most favorable to success, this method enables firms to focus on target countries, maximize returns, and global expansion with data, backed by accuracy.
By factoring in the projected importer demand gap that is currently unmet and could be potential opportunity, it identifies the potential for the Exporter (Country) among 190 countries, against the general trade analysis, which identifies the biggest importer or exporter.
To discover high-growth global markets and optimize your business strategy:
Click Here
Pricing
- Single User License$ 1,995
- Department License$ 2,400
- Site License$ 3,120
- Global License$ 3,795

Leadership Perspectives from Industry Events
Search
Thought Leadership and Analyst Meet


Our Clients
6WResearch In News
- Doha a strategic location for EV manufacturing hub: IPA Qatar
- Demand for luxury TVs surging in the GCC, says Samsung
- Empowering Growth: The Thriving Journey of Bangladesh’s Cable Industry
- Demand for luxury TVs surging in the GCC, says Samsung
- Video call with a traditional healer? Once unthinkable, it’s now common in South Africa
- Intelligent Buildings To Smooth GCC’s Path To Net Zero
Latest Reports
- Taiwan Airport Wireless Infrastructure Market (2026-2032)
- Vietnam Airport Wireless Infrastructure Market (2026-2032)
- Thailand Airport Wireless Infrastructure Market (2026-2032)
- South Korea Airport Wireless Infrastructure Market (2026-2032)
- Romania Airport Wireless Infrastructure Market (2026-2032)
- Qatar Airport Wireless Infrastructure Market (2026-2032)
- Philippines Airport Wireless Infrastructure Market (2026-2032)
- Japan Airport Wireless Infrastructure Market (2026-2032)
- Taiwan Airport Winter Services Market (2026-2032)
- Vietnam Airport Winter Services Market (2026-2032)
Industry Events and Analyst Meet

HIMTEX 2026

India Refining Summit 2026

India EV Show 2026

EV tech India Expo 2026

Auto Tech Asia 2026
Whitepaper
- Middle East & Africa Commercial Security Market Click here to view more.
- Middle East & Africa Fire Safety Systems & Equipment Market Click here to view more.
- GCC Drone Market Click here to view more.
- Middle East Lighting Fixture Market Click here to view more.
- GCC Physical & Perimeter Security Market Click here to view more.