Lithuania Bio Compatible Dental Materials Market (2026-2032) | Consumer Insights, Value, Supply, Forecast, Growth, Trends, Size, Analysis, Opportunities, Outlook, Pricing Analysis, Strategic Insights, Restraints, Industry, Demand, Strategy, Segments, Competition, Segmentation, Investment Trends, Challenges, Competitive, Companies, Drivers, Share, Revenue
Market Forecast By Material Type (Bio-Ceramics, Bio-Polymers, Bio-Metals), By Application (Dental Crowns, Braces, Dental Implants), By End User (Clinics, Orthodontics, Dental Labs), By Source (Biomass, Plant-Based, Sugar-Based), By Environmental Impact (Biodegradable, Non-Toxic, Durable) And Competitive Landscape
| Product Code: ETC11452794 | Publication Date: Apr 2025 | Updated Date: Apr 2026 | Product Type: Market Research Report | |
| Publisher: 6Wresearch | No. of Pages: 65 | No. of Figures: 34 | No. of Tables: 19 | |
Lithuania Bio Compatible Dental Materials Market Size (2020-2030)
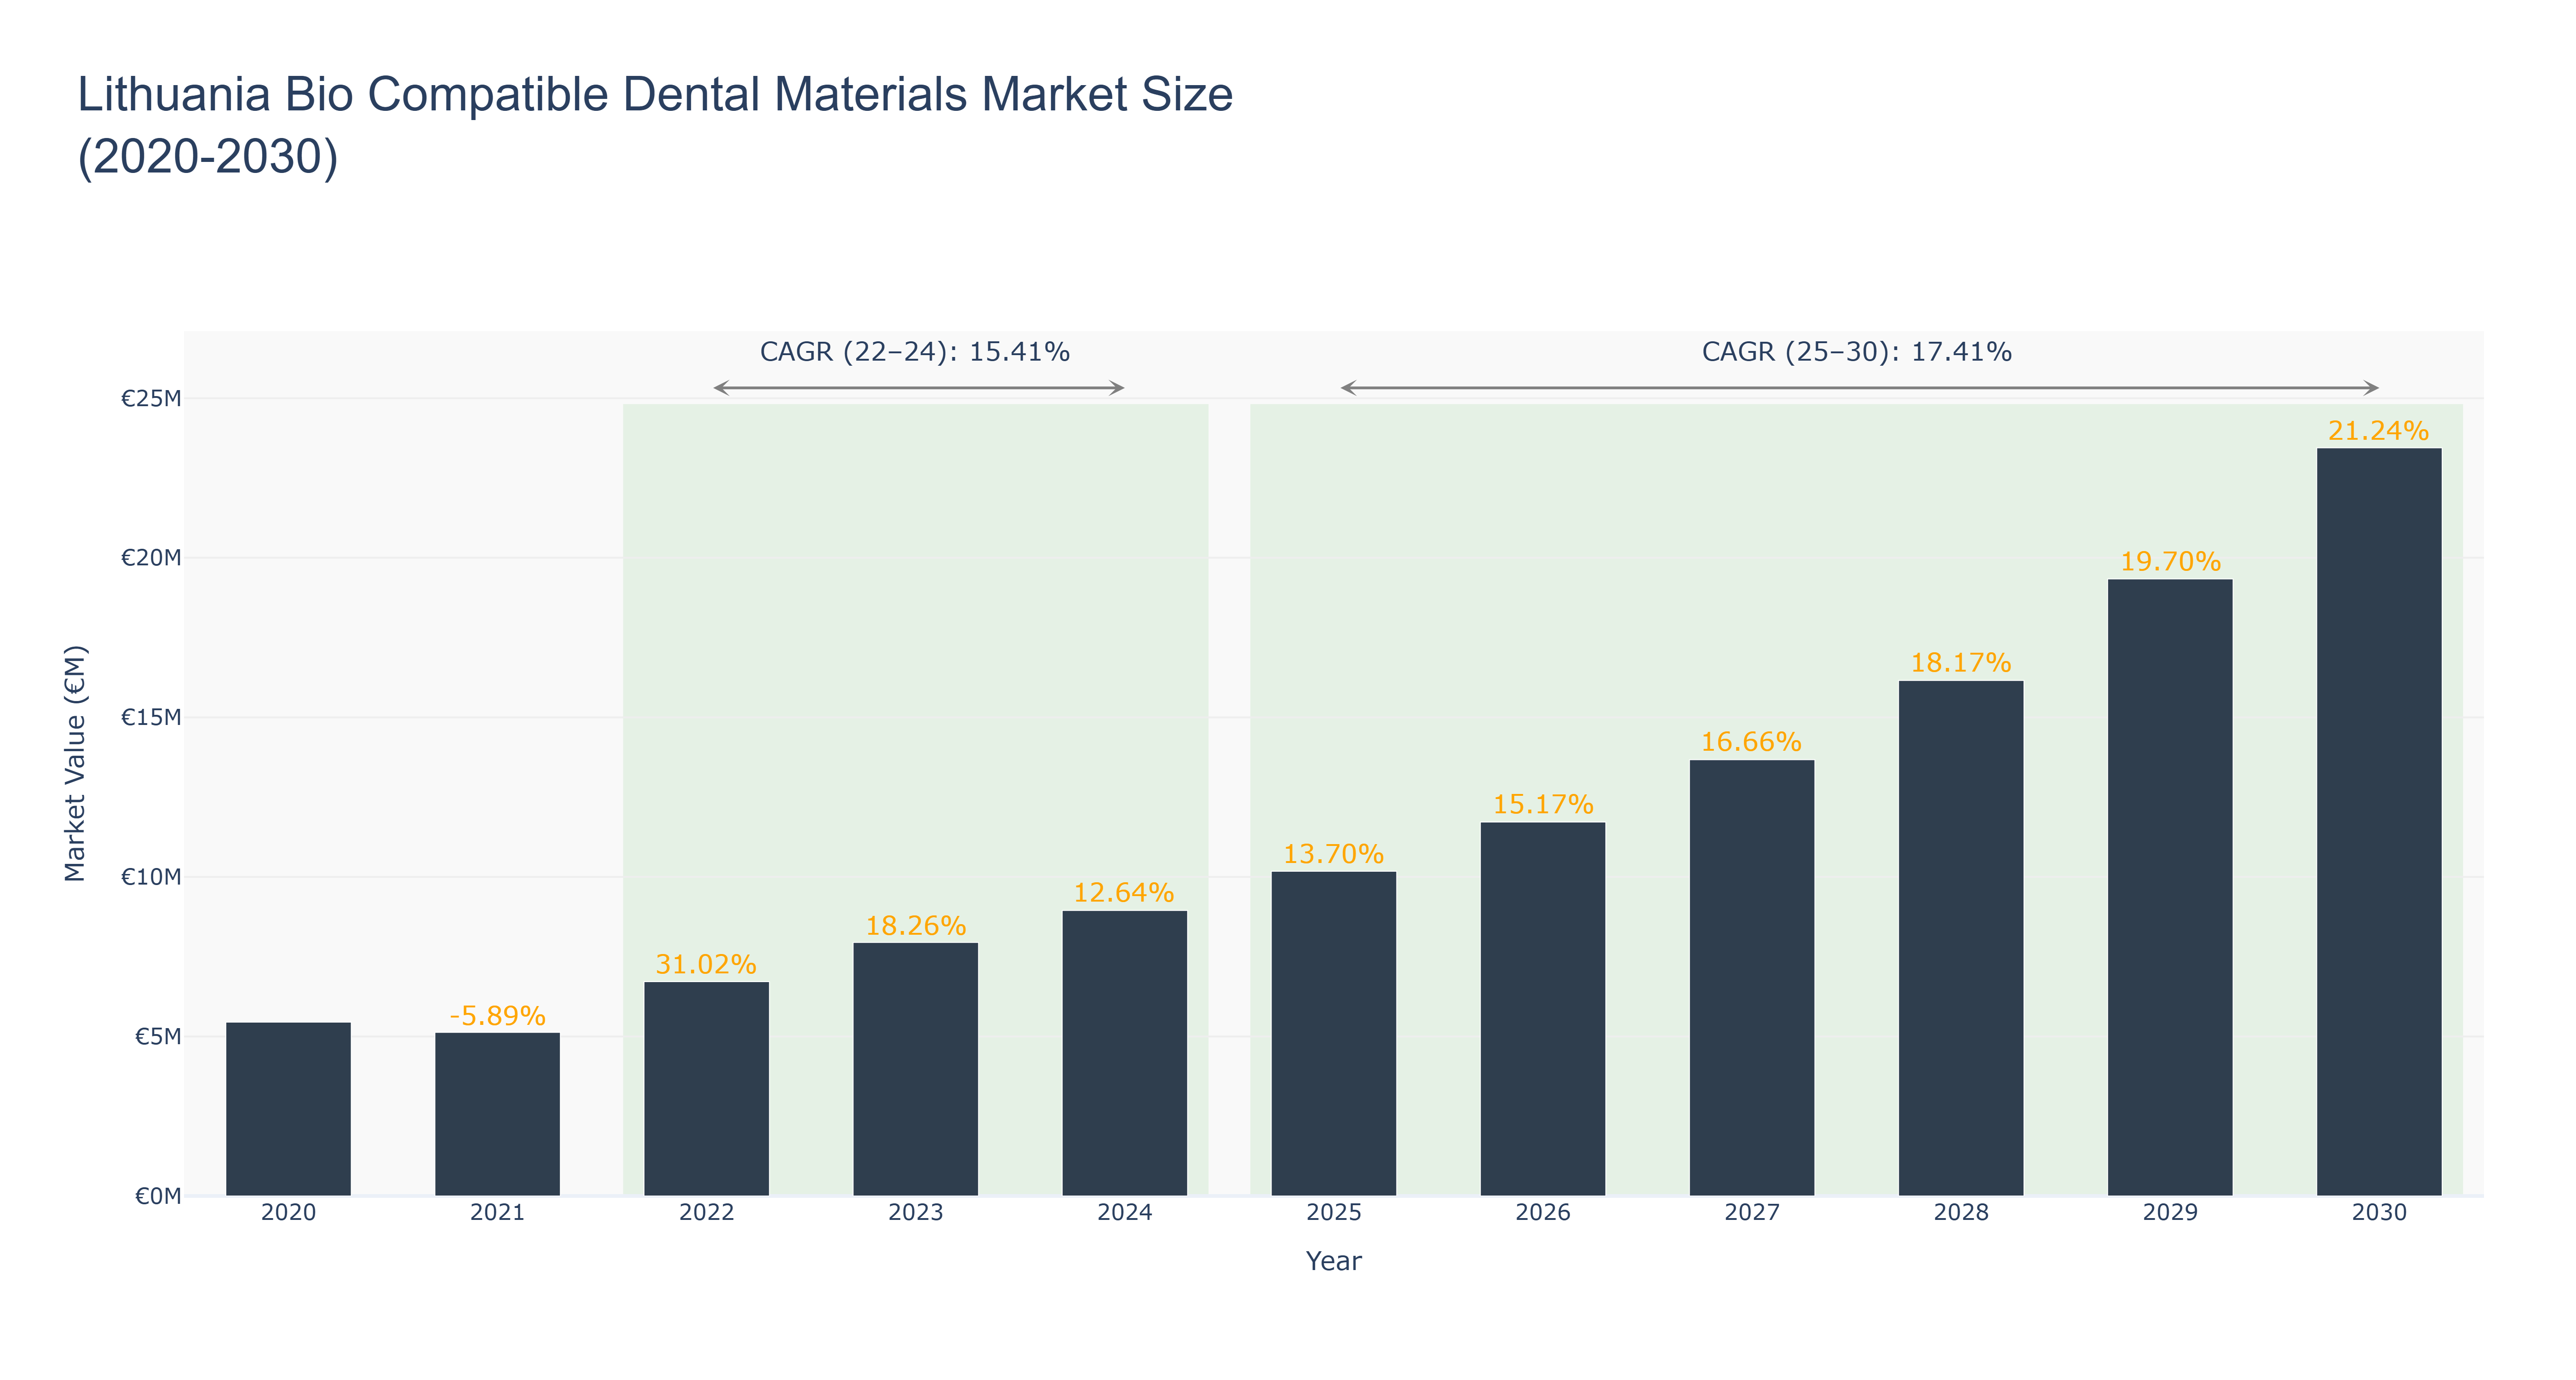
The Lithuania Bio Compatible Dental Materials Market exhibited notable fluctuations from 2020 to 2024, with a peak market size of €7.95 million in 2023, following a decline to €5.13 million in 2021. This period recorded an actual CAGR of 15.41%, reflecting a recovery and growth driven by increased dental procedures and advancements in biocompatible materials. The market is projected to expand further from 2025 to 2030, forecasted to reach €23.45 million by the end of this period, with a robust CAGR of 17.41%. Key drivers for this growth include rising consumer awareness of oral health, technological innovations in dental materials, and an aging population requiring more dental care. Additionally, ongoing investments in dental research and development are expected to enhance product offerings and stimulate market demand. Overall, the outlook for the Lithuanian market remains positive, propelled by these macroeconomic factors and evolving consumer preferences.
Lithuania Bio Compatible Dental Materials Market: Production & Trade Performance (2019-2025)
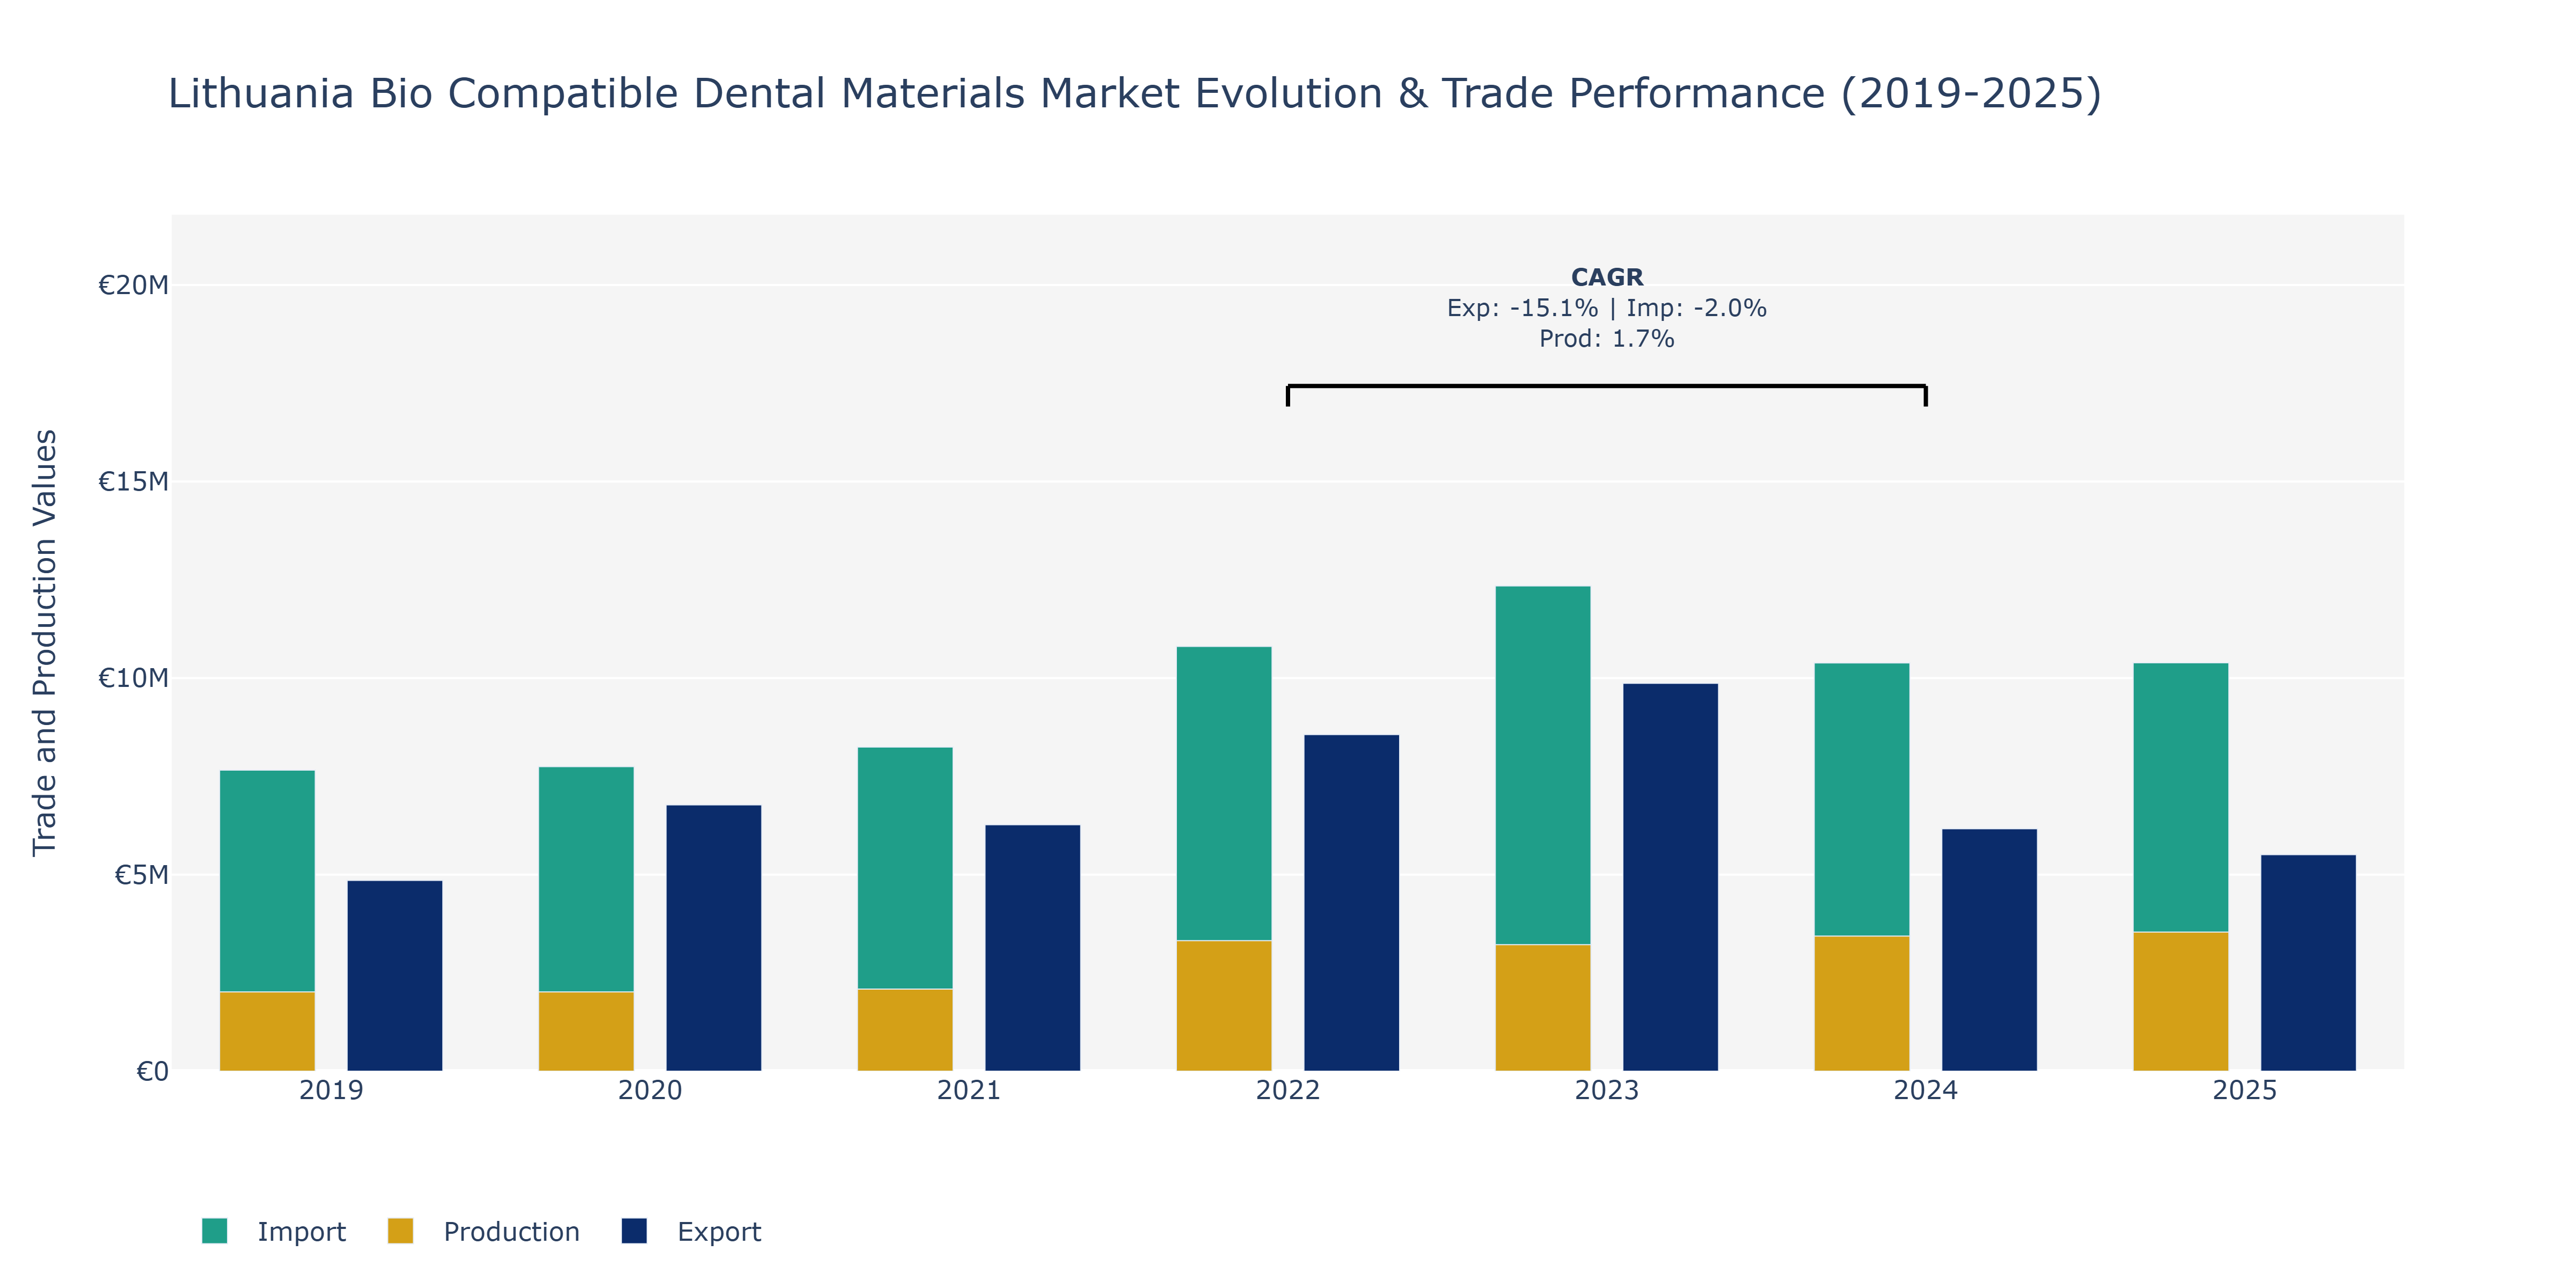
In the Lithuania Bio Compatible Dental Materials Market, exports initially showed a positive growth trajectory from 2019 to 2022, peaking at €8.56 million, before experiencing a notable decline in 2024 to €6.17 million. This decline can be attributed to potential shifts in global demand, pricing pressures, and competitive dynamics within the market. Imports remained relatively stable over the years, hovering around €10.81 million, with a slight increase in 2023. Production, on the other hand, showed consistent growth from 2019 to 2025, reaching €3.54 million. This upward trend in production might be driven by advancements in technology, increased research and development efforts, and rising demand for bio-compatible dental materials in the healthcare sector. As the market continues to evolve, stakeholders should closely monitor export trends to adapt to changing market conditions and maintain competitiveness.
Key Highlights of the Report:
- Lithuania Bio Compatible Dental Materials Market Outlook
- Market Size of Lithuania Bio Compatible Dental Materials Market, 2025
- Forecast of Lithuania Bio Compatible Dental Materials Market, 2032
- Historical Data and Forecast of Lithuania Bio Compatible Dental Materials Revenues & Volume for the Period 2022 - 2032F
- Lithuania Bio Compatible Dental Materials Market Trend Evolution
- Lithuania Bio Compatible Dental Materials Market Drivers and Challenges
- Lithuania Bio Compatible Dental Materials Price Trends
- Lithuania Bio Compatible Dental Materials Porter's Five Forces
- Lithuania Bio Compatible Dental Materials Industry Life Cycle
- Historical Data and Forecast of Lithuania Bio Compatible Dental Materials Market Revenues & Volume By Material Type for the Period 2022 - 2032F
- Historical Data and Forecast of Lithuania Bio Compatible Dental Materials Market Revenues & Volume By Bio-Ceramics for the Period 2022 - 2032F
- Historical Data and Forecast of Lithuania Bio Compatible Dental Materials Market Revenues & Volume By Bio-Polymers for the Period 2022 - 2032F
- Historical Data and Forecast of Lithuania Bio Compatible Dental Materials Market Revenues & Volume By Bio-Metals for the Period 2022 - 2032F
- Historical Data and Forecast of Lithuania Bio Compatible Dental Materials Market Revenues & Volume By Application for the Period 2022 - 2032F
- Historical Data and Forecast of Lithuania Bio Compatible Dental Materials Market Revenues & Volume By Dental Crowns for the Period 2022 - 2032F
- Historical Data and Forecast of Lithuania Bio Compatible Dental Materials Market Revenues & Volume By Braces for the Period 2022 - 2032F
- Historical Data and Forecast of Lithuania Bio Compatible Dental Materials Market Revenues & Volume By Dental Implants for the Period 2022 - 2032F
- Historical Data and Forecast of Lithuania Bio Compatible Dental Materials Market Revenues & Volume By End User for the Period 2022 - 2032F
- Historical Data and Forecast of Lithuania Bio Compatible Dental Materials Market Revenues & Volume By Clinics for the Period 2022 - 2032F
- Historical Data and Forecast of Lithuania Bio Compatible Dental Materials Market Revenues & Volume By Orthodontics for the Period 2022 - 2032F
- Historical Data and Forecast of Lithuania Bio Compatible Dental Materials Market Revenues & Volume By Dental Labs for the Period 2022 - 2032F
- Historical Data and Forecast of Lithuania Bio Compatible Dental Materials Market Revenues & Volume By Source for the Period 2022 - 2032F
- Historical Data and Forecast of Lithuania Bio Compatible Dental Materials Market Revenues & Volume By Biomass for the Period 2022 - 2032F
- Historical Data and Forecast of Lithuania Bio Compatible Dental Materials Market Revenues & Volume By Plant-Based for the Period 2022 - 2032F
- Historical Data and Forecast of Lithuania Bio Compatible Dental Materials Market Revenues & Volume By Sugar-Based for the Period 2022 - 2032F
- Historical Data and Forecast of Lithuania Bio Compatible Dental Materials Market Revenues & Volume By Environmental Impact for the Period 2022 - 2032F
- Historical Data and Forecast of Lithuania Bio Compatible Dental Materials Market Revenues & Volume By Biodegradable for the Period 2022 - 2032F
- Historical Data and Forecast of Lithuania Bio Compatible Dental Materials Market Revenues & Volume By Non-Toxic for the Period 2022 - 2032F
- Historical Data and Forecast of Lithuania Bio Compatible Dental Materials Market Revenues & Volume By Durable for the Period 2022 - 2032F
- Lithuania Bio Compatible Dental Materials Import Export Trade Statistics
- Market Opportunity Assessment By Material Type
- Market Opportunity Assessment By Application
- Market Opportunity Assessment By End User
- Market Opportunity Assessment By Source
- Market Opportunity Assessment By Environmental Impact
- Lithuania Bio Compatible Dental Materials Top Companies Market Share
- Lithuania Bio Compatible Dental Materials Competitive Benchmarking By Technical and Operational Parameters
- Lithuania Bio Compatible Dental Materials Company Profiles
- Lithuania Bio Compatible Dental Materials Key Strategic Recommendations
Frequently Asked Questions About the Market Study (FAQs):
6Wresearch actively monitors the Lithuania Bio Compatible Dental Materials Market and publishes its comprehensive annual report, highlighting emerging trends, growth drivers, revenue analysis, and forecast outlook. Our insights help businesses to make data-backed strategic decisions with ongoing market dynamics. Our analysts track relevent industries related to the Lithuania Bio Compatible Dental Materials Market, allowing our clients with actionable intelligence and reliable forecasts tailored to emerging regional needs.
Yes, we provide customisation as per your requirements. To learn more, feel free to contact us on sales@6wresearch.com
1 Executive Summary |
2 Introduction |
2.1 Key Highlights of the Report |
2.2 Report Description |
2.3 Market Scope & Segmentation |
2.4 Research Methodology |
2.5 Assumptions |
3 Lithuania Bio Compatible Dental Materials Market Overview |
3.1 Lithuania Country Macro Economic Indicators |
3.2 Lithuania Bio Compatible Dental Materials Market Revenues & Volume, 2022 & 2032F |
3.3 Lithuania Bio Compatible Dental Materials Market - Industry Life Cycle |
3.4 Lithuania Bio Compatible Dental Materials Market - Porter's Five Forces |
3.5 Lithuania Bio Compatible Dental Materials Market Revenues & Volume Share, By Material Type, 2022 & 2032F |
3.6 Lithuania Bio Compatible Dental Materials Market Revenues & Volume Share, By Application, 2022 & 2032F |
3.7 Lithuania Bio Compatible Dental Materials Market Revenues & Volume Share, By End User, 2022 & 2032F |
3.8 Lithuania Bio Compatible Dental Materials Market Revenues & Volume Share, By Source, 2022 & 2032F |
3.9 Lithuania Bio Compatible Dental Materials Market Revenues & Volume Share, By Environmental Impact, 2022 & 2032F |
4 Lithuania Bio Compatible Dental Materials Market Dynamics |
4.1 Impact Analysis |
4.2 Market Drivers |
4.2.1 Growing awareness among consumers about the benefits of bio-compatible dental materials |
4.2.2 Increasing demand for aesthetic dental procedures |
4.2.3 Technological advancements in bio-compatible dental materials |
4.3 Market Restraints |
4.3.1 High cost of bio-compatible dental materials compared to traditional materials |
4.3.2 Limited availability of skilled professionals for handling bio-compatible materials |
4.3.3 Regulatory challenges in the approval and certification of bio-compatible dental materials |
5 Lithuania Bio Compatible Dental Materials Market Trends |
6 Lithuania Bio Compatible Dental Materials Market, By Types |
6.1 Lithuania Bio Compatible Dental Materials Market, By Material Type |
6.1.1 Overview and Analysis |
6.1.2 Lithuania Bio Compatible Dental Materials Market Revenues & Volume, By Material Type, 2022 - 2032F |
6.1.3 Lithuania Bio Compatible Dental Materials Market Revenues & Volume, By Bio-Ceramics, 2022 - 2032F |
6.1.4 Lithuania Bio Compatible Dental Materials Market Revenues & Volume, By Bio-Polymers, 2022 - 2032F |
6.1.5 Lithuania Bio Compatible Dental Materials Market Revenues & Volume, By Bio-Metals, 2022 - 2032F |
6.2 Lithuania Bio Compatible Dental Materials Market, By Application |
6.2.1 Overview and Analysis |
6.2.2 Lithuania Bio Compatible Dental Materials Market Revenues & Volume, By Dental Crowns, 2022 - 2032F |
6.2.3 Lithuania Bio Compatible Dental Materials Market Revenues & Volume, By Braces, 2022 - 2032F |
6.2.4 Lithuania Bio Compatible Dental Materials Market Revenues & Volume, By Dental Implants, 2022 - 2032F |
6.3 Lithuania Bio Compatible Dental Materials Market, By End User |
6.3.1 Overview and Analysis |
6.3.2 Lithuania Bio Compatible Dental Materials Market Revenues & Volume, By Clinics, 2022 - 2032F |
6.3.3 Lithuania Bio Compatible Dental Materials Market Revenues & Volume, By Orthodontics, 2022 - 2032F |
6.3.4 Lithuania Bio Compatible Dental Materials Market Revenues & Volume, By Dental Labs, 2022 - 2032F |
6.4 Lithuania Bio Compatible Dental Materials Market, By Source |
6.4.1 Overview and Analysis |
6.4.2 Lithuania Bio Compatible Dental Materials Market Revenues & Volume, By Biomass, 2022 - 2032F |
6.4.3 Lithuania Bio Compatible Dental Materials Market Revenues & Volume, By Plant-Based, 2022 - 2032F |
6.4.4 Lithuania Bio Compatible Dental Materials Market Revenues & Volume, By Sugar-Based, 2022 - 2032F |
6.5 Lithuania Bio Compatible Dental Materials Market, By Environmental Impact |
6.5.1 Overview and Analysis |
6.5.2 Lithuania Bio Compatible Dental Materials Market Revenues & Volume, By Biodegradable, 2022 - 2032F |
6.5.3 Lithuania Bio Compatible Dental Materials Market Revenues & Volume, By Non-Toxic, 2022 - 2032F |
6.5.4 Lithuania Bio Compatible Dental Materials Market Revenues & Volume, By Durable, 2022 - 2032F |
7 Lithuania Bio Compatible Dental Materials Market Import-Export Trade Statistics |
7.1 Lithuania Bio Compatible Dental Materials Market Export to Major Countries |
7.2 Lithuania Bio Compatible Dental Materials Market Imports from Major Countries |
8 Lithuania Bio Compatible Dental Materials Market Key Performance Indicators |
8.1 Adoption rate of bio-compatible dental materials by dental clinics and practitioners |
8.2 Number of research studies and publications on the efficacy of bio-compatible materials |
8.3 Percentage of dental procedures using bio-compatible materials compared to traditional materials |
9 Lithuania Bio Compatible Dental Materials Market - Opportunity Assessment |
9.1 Lithuania Bio Compatible Dental Materials Market Opportunity Assessment, By Material Type, 2022 & 2032F |
9.2 Lithuania Bio Compatible Dental Materials Market Opportunity Assessment, By Application, 2022 & 2032F |
9.3 Lithuania Bio Compatible Dental Materials Market Opportunity Assessment, By End User, 2022 & 2032F |
9.4 Lithuania Bio Compatible Dental Materials Market Opportunity Assessment, By Source, 2022 & 2032F |
9.5 Lithuania Bio Compatible Dental Materials Market Opportunity Assessment, By Environmental Impact, 2022 & 2032F |
10 Lithuania Bio Compatible Dental Materials Market - Competitive Landscape |
10.1 Lithuania Bio Compatible Dental Materials Market Revenue Share, By Companies, 2025 |
10.2 Lithuania Bio Compatible Dental Materials Market Competitive Benchmarking, By Operating and Technical Parameters |
11 Company Profiles |
12 Recommendations |
13 Disclaimer |
Global Go To Market Strategy - 2030
Export potential enables firms to identify high-growth global markets with greater confidence by combining advanced trade intelligence with a structured quantitative methodology. The framework analyzes emerging demand trends and country-level import patterns while integrating macroeconomic and trade datasets such as GDP and population forecasts, bilateral import–export flows, tariff structures, elasticity differentials between developed and developing economies, geographic distance, and import demand projections. Using weighted trade values from 2020–2024 as the base period to project country-to-country export potential for 2030, these inputs are operationalized through calculated drivers such as gravity model parameters, tariff impact factors, and projected GDP per-capita growth. Through an analysis of hidden potentials, demand hotspots, and market conditions that are most favorable to success, this method enables firms to focus on target countries, maximize returns, and global expansion with data, backed by accuracy.
By factoring in the projected importer demand gap that is currently unmet and could be potential opportunity, it identifies the potential for the Exporter (Country) among 190 countries, against the general trade analysis, which identifies the biggest importer or exporter.
To discover high-growth global markets and optimize your business strategy:
Click Here
Pricing
- Single User License$ 1,995
- Department License$ 2,400
- Site License$ 3,120
- Global License$ 3,795

Leadership Perspectives from Industry Events
Search
Thought Leadership and Analyst Meet


Our Clients
6WResearch In News
- Doha a strategic location for EV manufacturing hub: IPA Qatar
- Demand for luxury TVs surging in the GCC, says Samsung
- Empowering Growth: The Thriving Journey of Bangladesh’s Cable Industry
- Demand for luxury TVs surging in the GCC, says Samsung
- Video call with a traditional healer? Once unthinkable, it’s now common in South Africa
- Intelligent Buildings To Smooth GCC’s Path To Net Zero
Latest Reports
- Taiwan Airport Wireless Infrastructure Market (2026-2032)
- Vietnam Airport Wireless Infrastructure Market (2026-2032)
- Thailand Airport Wireless Infrastructure Market (2026-2032)
- South Korea Airport Wireless Infrastructure Market (2026-2032)
- Romania Airport Wireless Infrastructure Market (2026-2032)
- Qatar Airport Wireless Infrastructure Market (2026-2032)
- Philippines Airport Wireless Infrastructure Market (2026-2032)
- Japan Airport Wireless Infrastructure Market (2026-2032)
- Taiwan Airport Winter Services Market (2026-2032)
- Vietnam Airport Winter Services Market (2026-2032)
Industry Events and Analyst Meet

HIMTEX 2026

India Refining Summit 2026

India EV Show 2026

EV tech India Expo 2026

Auto Tech Asia 2026
Whitepaper
- Middle East & Africa Commercial Security Market Click here to view more.
- Middle East & Africa Fire Safety Systems & Equipment Market Click here to view more.
- GCC Drone Market Click here to view more.
- Middle East Lighting Fixture Market Click here to view more.
- GCC Physical & Perimeter Security Market Click here to view more.