Lithuania Brewers Spent Grain Market (2026-2032) | Value, Competitive Landscape, Size & Revenue, Companies, Outlook, Growth, Forecast, Trends, Analysis, Industry, Segmentation, Share
Market Forecast By Product (Wheat, Barley, Rye, Oats, Other Grains), By Application (Animal Feed, Food & Beverages, Dietary Supplements, Breweries (Return)) And Competitive Landscape
| Product Code: ETC8036241 | Publication Date: Sep 2024 | Updated Date: Apr 2026 | Product Type: Market Research Report | |
| Publisher: 6Wresearch | Author: Sumit Sagar | No. of Pages: 75 | No. of Figures: 35 | No. of Tables: 20 |
Lithuania Brewers Spent Grain Market Size (2020-2030)
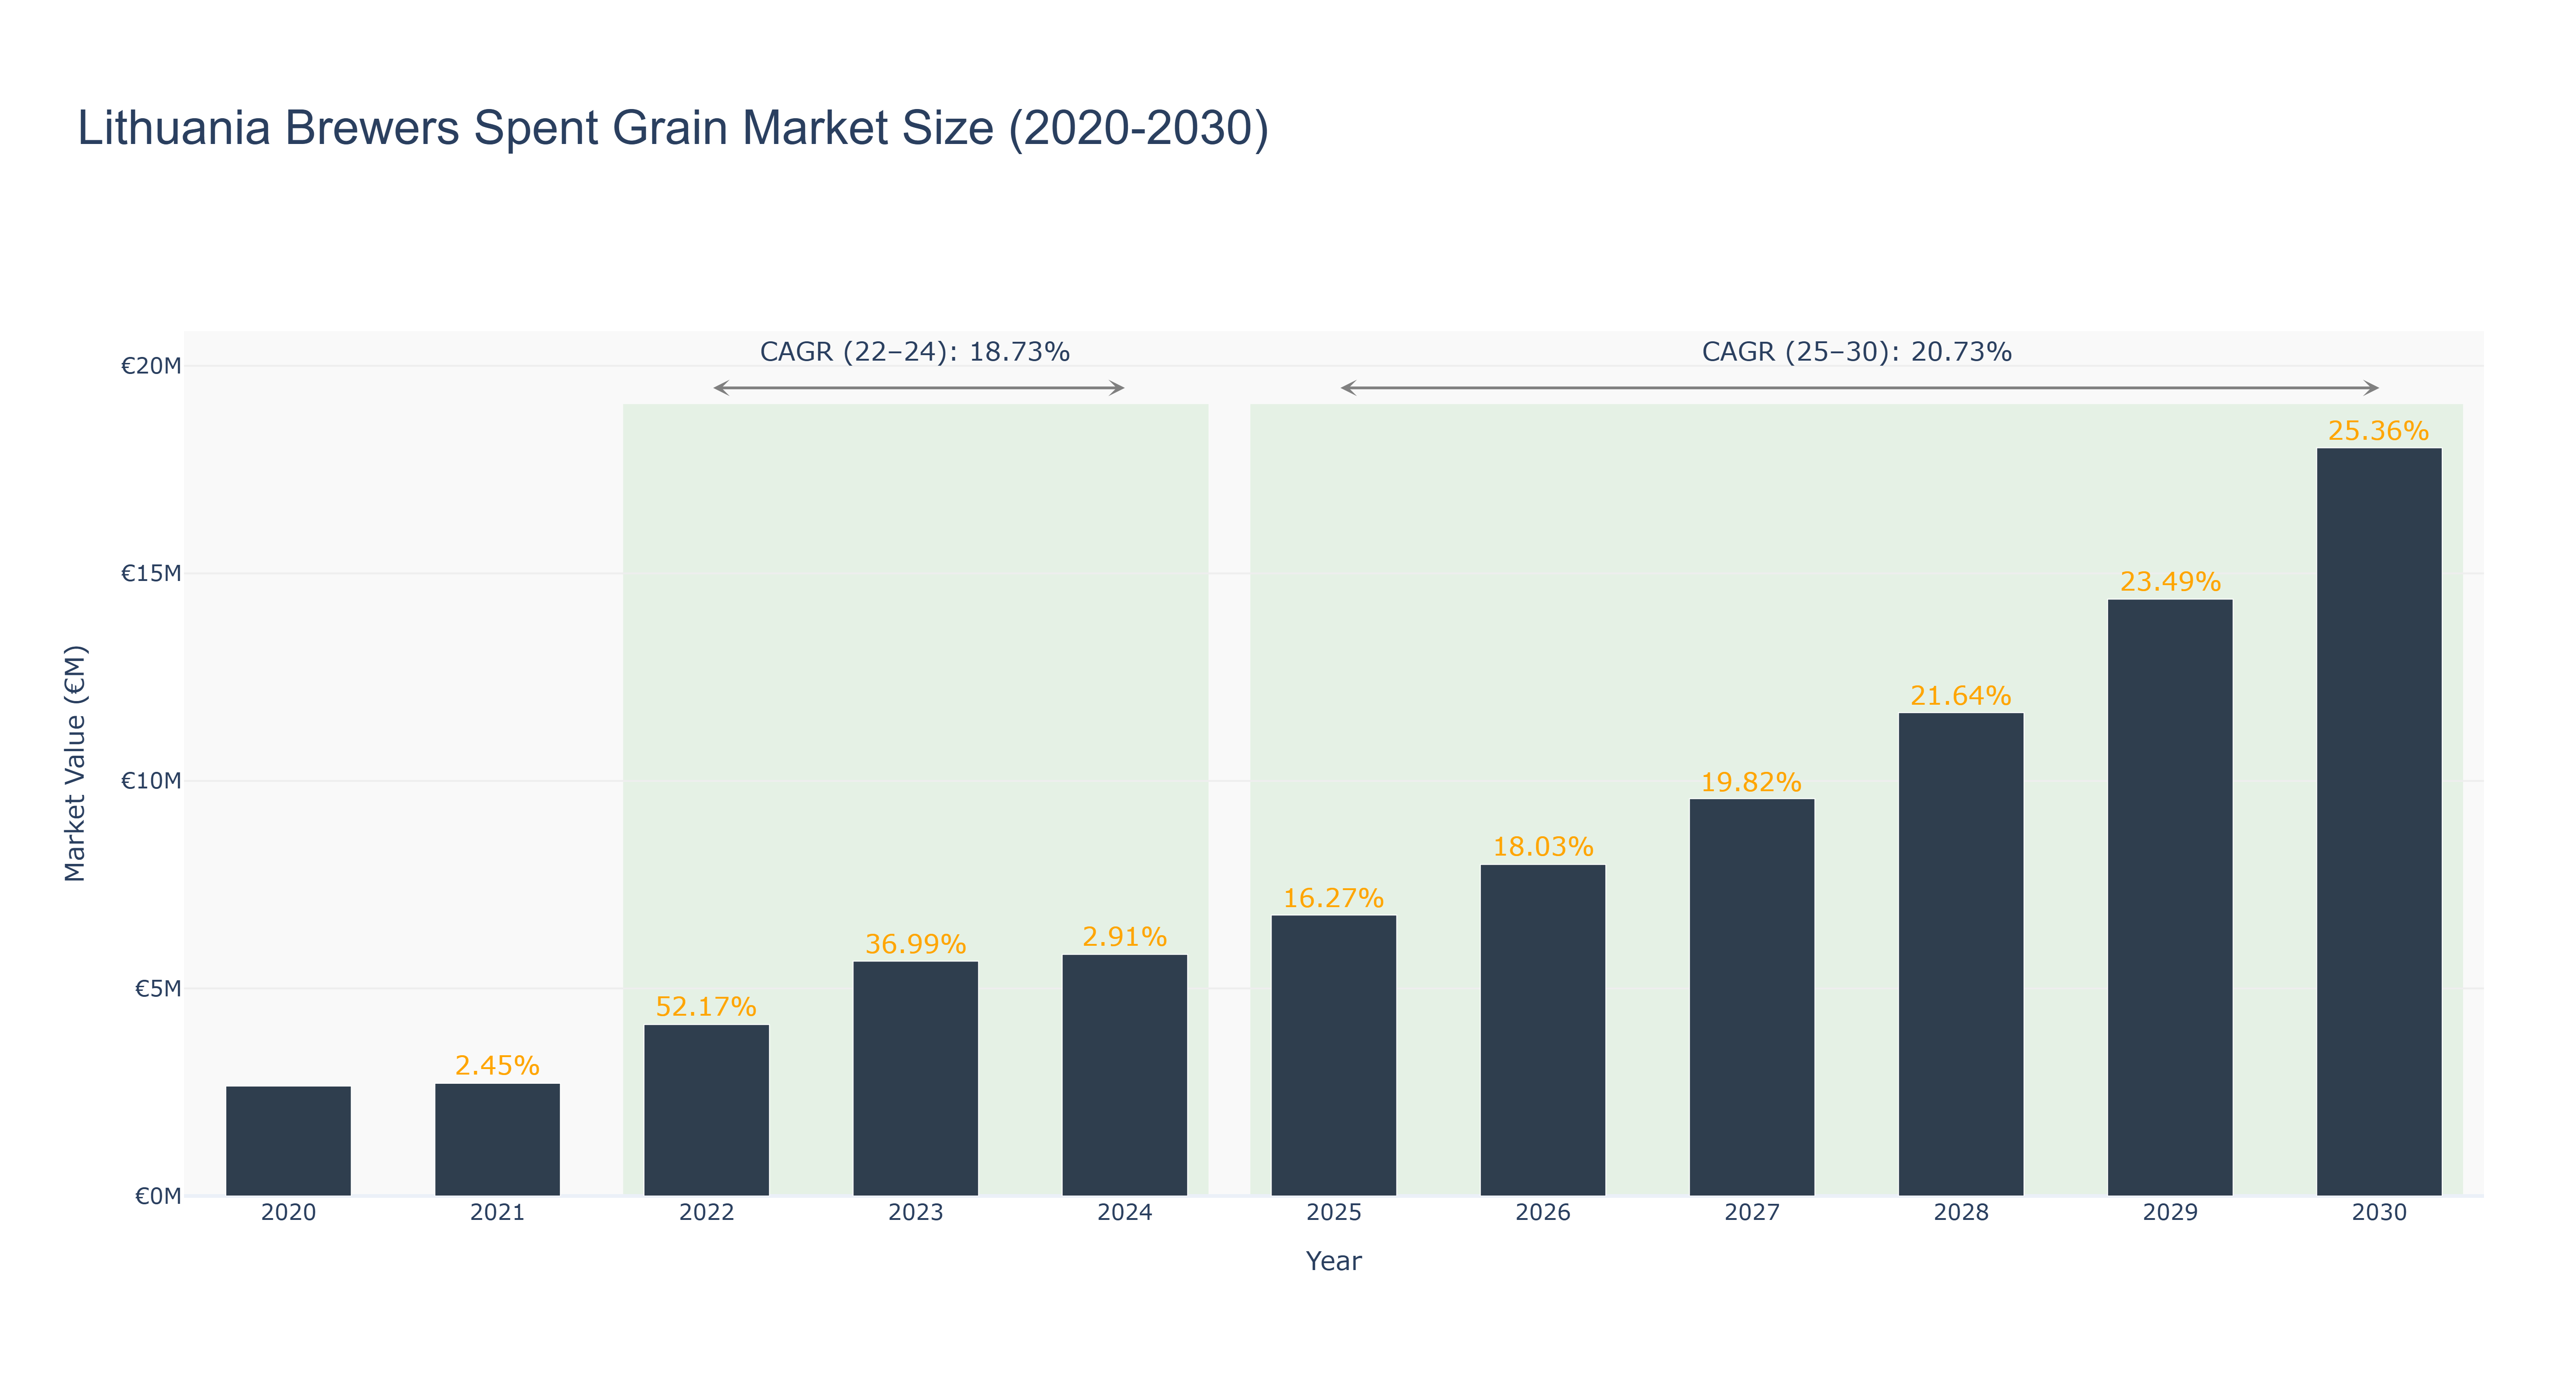
The Lithuania Brewers Spent Grain Market has shown a steady growth trajectory over the years. The market size peaked at €18.03 million in 2030, with a Compound Annual Growth Rate (CAGR) of 25.36% from 2025 to 2030. The actual market size increased from €2.65 million in 2020 to €5.82 million in 2024, driven by increasing consumer awareness of sustainable practices. The forecasted growth from 2025 to 2030 is expected to be robust, with a CAGR of 20.73%. The market's growth can be attributed to the rising demand for eco-friendly products and the implementation of stringent environmental regulations. Looking ahead, Lithuania is set to invest in sustainable waste management projects, further boosting the Brewers Spent Grain Market.
Lithuania Brewers Spent Grain Market: Production & Trade Performance (2019-2025)
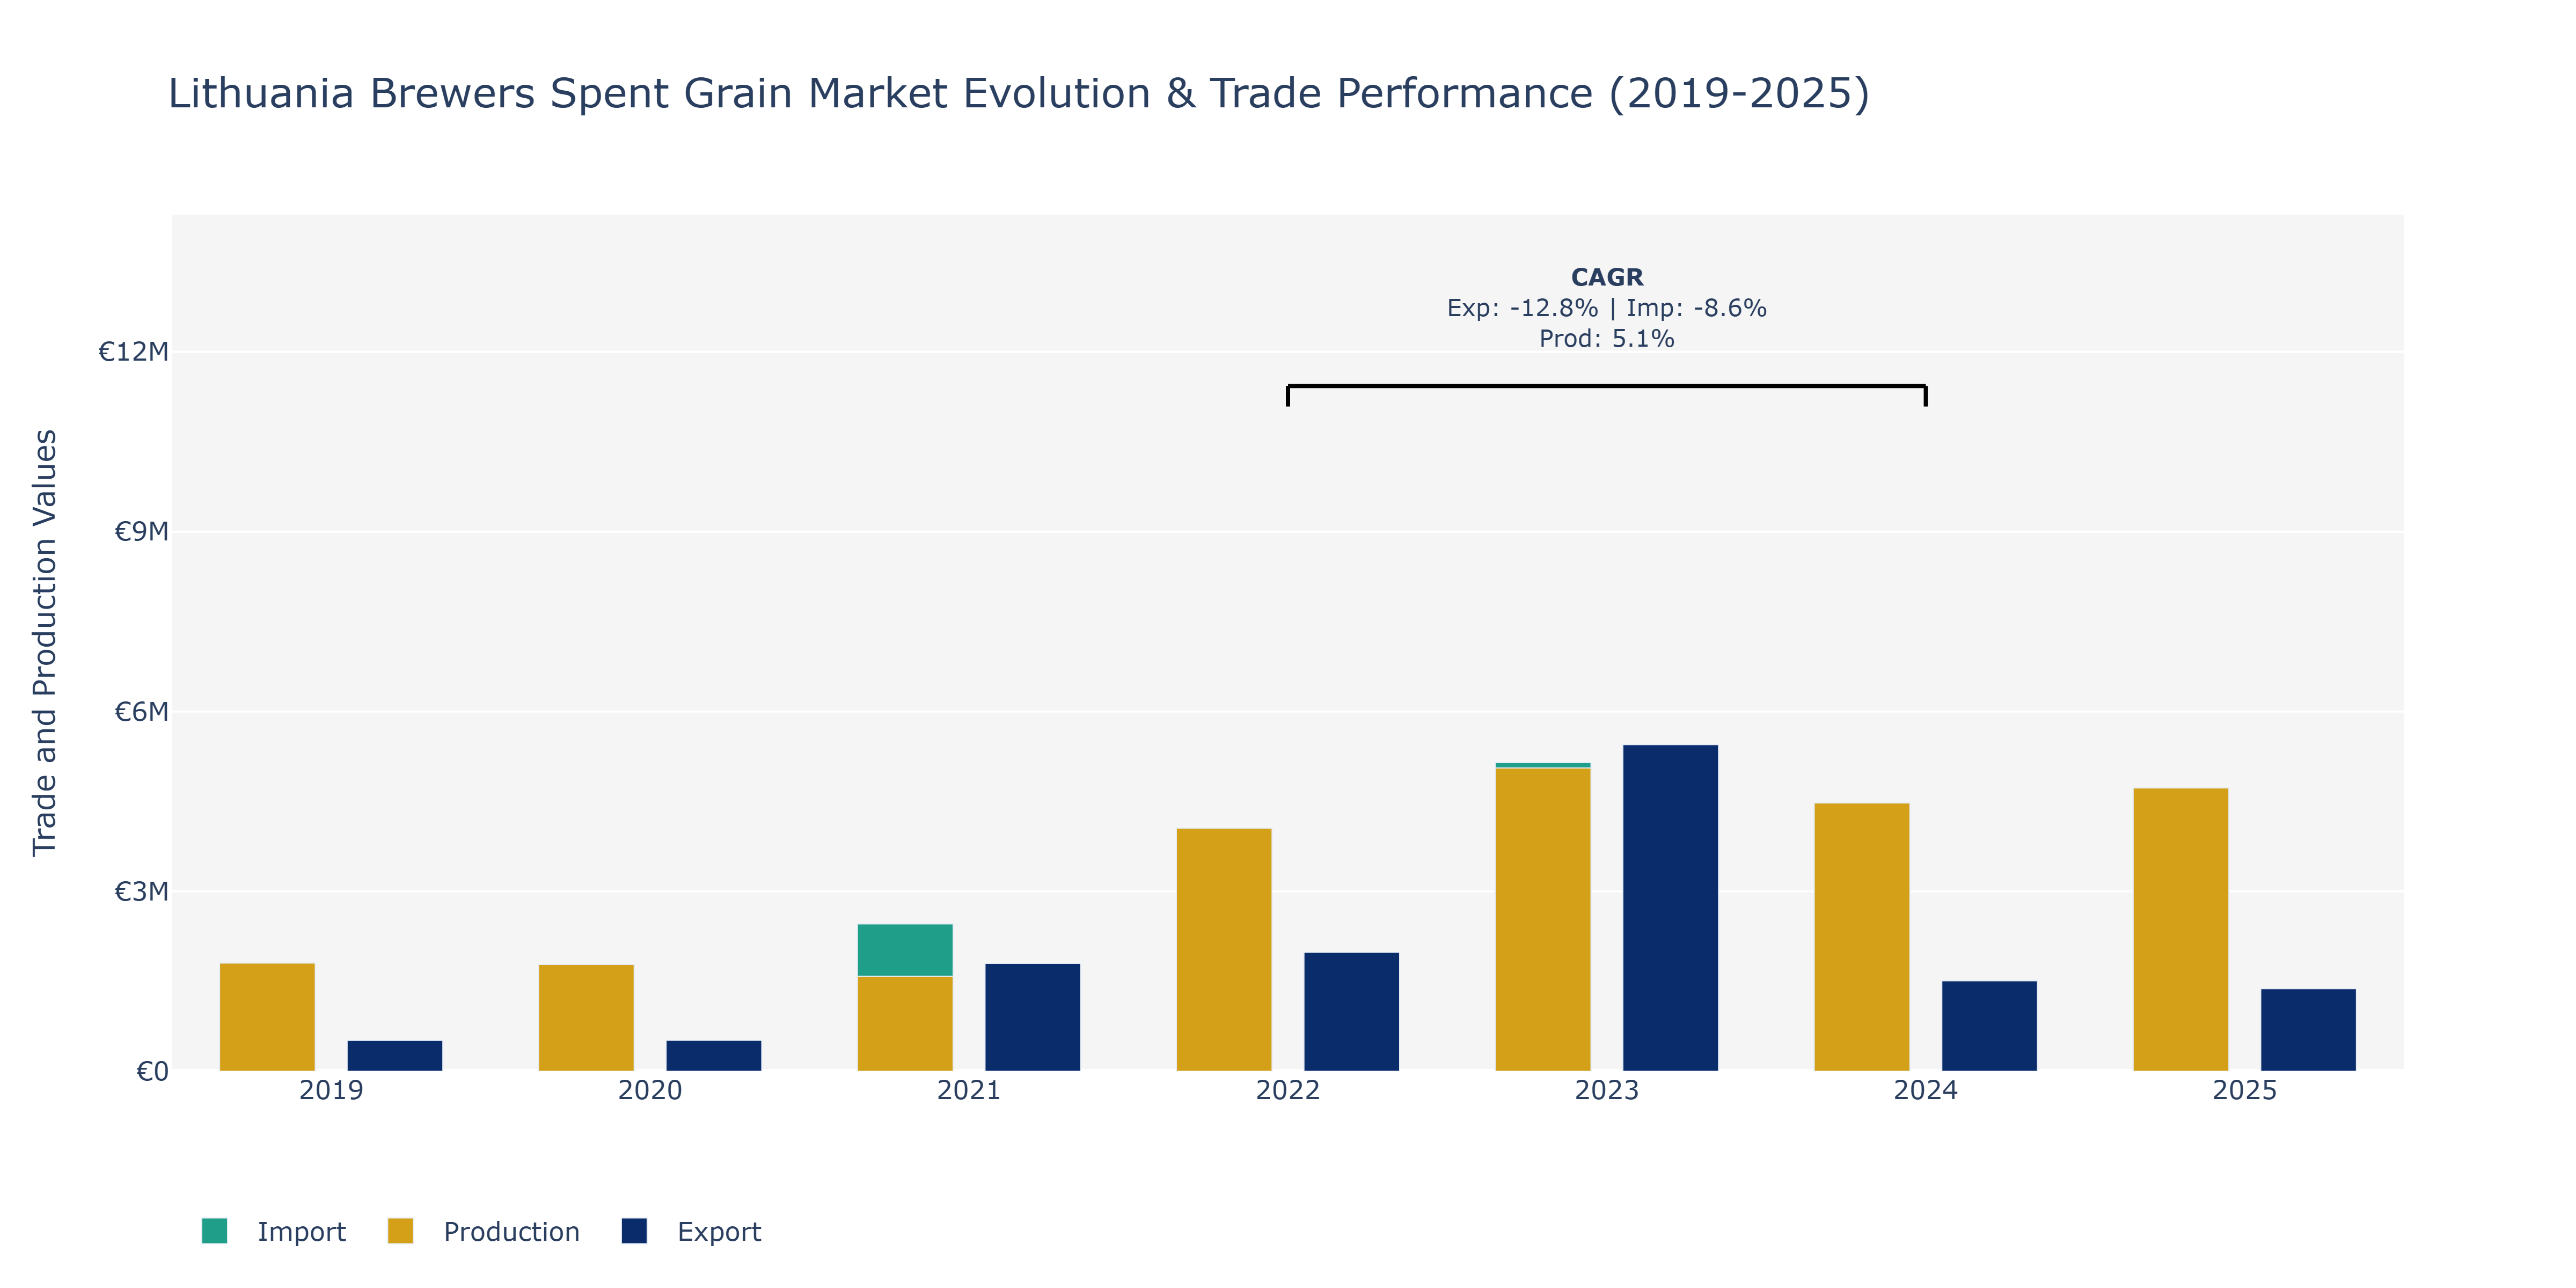
In the Lithuania Brewers Spent Grain Market, from 2019 to 2025, exports displayed fluctuations with a peak in 2023 at €5.45 million, dropping to around €1.51 million in 2024 and 2025. Imports followed a similar trend, peaking in 2023 at €5.15 million and then decreasing to approximately €2.41 million by 2025. Production saw steady growth from 2019 to 2023, reaching €5.1 million, likely driven by increased demand for spent grain utilization in various industries. However, a slight decline was observed in 2024 and 2025, possibly due to supply chain disruptions or shifts in consumer preferences. The market's performance reflects global trends in sustainability, with breweries seeking innovative ways to repurpose by-products. The fluctuations in exports and imports could be influenced by international trade policies impacting market dynamics and economic conditions affecting supply chain operations.
Key Highlights of the Report:
- Lithuania Brewers Spent Grain Market Outlook
- Market Size of Lithuania Brewers Spent Grain Market, 2025
- Forecast of Lithuania Brewers Spent Grain Market, 2032
- Historical Data and Forecast of Lithuania Brewers Spent Grain Revenues & Volume for the Period 2022 - 2032
- Lithuania Brewers Spent Grain Market Trend Evolution
- Lithuania Brewers Spent Grain Market Drivers and Challenges
- Lithuania Brewers Spent Grain Price Trends
- Lithuania Brewers Spent Grain Porter's Five Forces
- Lithuania Brewers Spent Grain Industry Life Cycle
- Historical Data and Forecast of Lithuania Brewers Spent Grain Market Revenues & Volume By Product for the Period 2022 - 2032
- Historical Data and Forecast of Lithuania Brewers Spent Grain Market Revenues & Volume By Wheat for the Period 2022 - 2032
- Historical Data and Forecast of Lithuania Brewers Spent Grain Market Revenues & Volume By Barley for the Period 2022 - 2032
- Historical Data and Forecast of Lithuania Brewers Spent Grain Market Revenues & Volume By Rye for the Period 2022 - 2032
- Historical Data and Forecast of Lithuania Brewers Spent Grain Market Revenues & Volume By Oats for the Period 2022 - 2032
- Historical Data and Forecast of Lithuania Brewers Spent Grain Market Revenues & Volume By Other Grains for the Period 2022 - 2032
- Historical Data and Forecast of Lithuania Brewers Spent Grain Market Revenues & Volume By Application for the Period 2022 - 2032
- Historical Data and Forecast of Lithuania Brewers Spent Grain Market Revenues & Volume By Animal Feed for the Period 2022 - 2032
- Historical Data and Forecast of Lithuania Brewers Spent Grain Market Revenues & Volume By Food & Beverages for the Period 2022 - 2032
- Historical Data and Forecast of Lithuania Brewers Spent Grain Market Revenues & Volume By Dietary Supplements for the Period 2022 - 2032
- Historical Data and Forecast of Lithuania Brewers Spent Grain Market Revenues & Volume By Breweries (Return) for the Period 2022 - 2032
- Lithuania Brewers Spent Grain Import Export Trade Statistics
- Market Opportunity Assessment By Product
- Market Opportunity Assessment By Application
- Lithuania Brewers Spent Grain Top Companies Market Share
- Lithuania Brewers Spent Grain Competitive Benchmarking By Technical and Operational Parameters
- Lithuania Brewers Spent Grain Company Profiles
- Lithuania Brewers Spent Grain Key Strategic Recommendations
Frequently Asked Questions About the Market Study (FAQs):
6Wresearch actively monitors the Lithuania Brewers Spent Grain Market and publishes its comprehensive annual report, highlighting emerging trends, growth drivers, revenue analysis, and forecast outlook. Our insights help businesses to make data-backed strategic decisions with ongoing market dynamics. Our analysts track relevent industries related to the Lithuania Brewers Spent Grain Market, allowing our clients with actionable intelligence and reliable forecasts tailored to emerging regional needs.
Yes, we provide customisation as per your requirements. To learn more, feel free to contact us on sales@6wresearch.com
1 Executive Summary |
2 Introduction |
2.1 Key Highlights of the Report |
2.2 Report Description |
2.3 Market Scope & Segmentation |
2.4 Research Methodology |
2.5 Assumptions |
3 Lithuania Brewers Spent Grain Market Overview |
3.1 Lithuania Country Macro Economic Indicators |
3.2 Lithuania Brewers Spent Grain Market Revenues & Volume, 2022 & 2032F |
3.3 Lithuania Brewers Spent Grain Market - Industry Life Cycle |
3.4 Lithuania Brewers Spent Grain Market - Porter's Five Forces |
3.5 Lithuania Brewers Spent Grain Market Revenues & Volume Share, By Product, 2022 & 2032F |
3.6 Lithuania Brewers Spent Grain Market Revenues & Volume Share, By Application, 2022 & 2032F |
4 Lithuania Brewers Spent Grain Market Dynamics |
4.1 Impact Analysis |
4.2 Market Drivers |
4.2.1 Growing awareness about sustainable practices in the brewing industry |
4.2.2 Increasing demand for animal feed with high nutritional value |
4.2.3 Government initiatives promoting the use of by-products in various industries |
4.3 Market Restraints |
4.3.1 Fluctuations in raw material prices affecting production costs |
4.3.2 Limited infrastructure for efficient collection and processing of brewers spent grain |
4.3.3 Competition from alternative sources of animal feed |
5 Lithuania Brewers Spent Grain Market Trends |
6 Lithuania Brewers Spent Grain Market, By Types |
6.1 Lithuania Brewers Spent Grain Market, By Product |
6.1.1 Overview and Analysis |
6.1.2 Lithuania Brewers Spent Grain Market Revenues & Volume, By Product, 2022 - 2032F |
6.1.3 Lithuania Brewers Spent Grain Market Revenues & Volume, By Wheat, 2022 - 2032F |
6.1.4 Lithuania Brewers Spent Grain Market Revenues & Volume, By Barley, 2022 - 2032F |
6.1.5 Lithuania Brewers Spent Grain Market Revenues & Volume, By Rye, 2022 - 2032F |
6.1.6 Lithuania Brewers Spent Grain Market Revenues & Volume, By Oats, 2022 - 2032F |
6.1.7 Lithuania Brewers Spent Grain Market Revenues & Volume, By Other Grains, 2022 - 2032F |
6.2 Lithuania Brewers Spent Grain Market, By Application |
6.2.1 Overview and Analysis |
6.2.2 Lithuania Brewers Spent Grain Market Revenues & Volume, By Animal Feed, 2022 - 2032F |
6.2.3 Lithuania Brewers Spent Grain Market Revenues & Volume, By Food & Beverages, 2022 - 2032F |
6.2.4 Lithuania Brewers Spent Grain Market Revenues & Volume, By Dietary Supplements, 2022 - 2032F |
6.2.5 Lithuania Brewers Spent Grain Market Revenues & Volume, By Breweries (Return), 2022 - 2032F |
7 Lithuania Brewers Spent Grain Market Import-Export Trade Statistics |
7.1 Lithuania Brewers Spent Grain Market Export to Major Countries |
7.2 Lithuania Brewers Spent Grain Market Imports from Major Countries |
8 Lithuania Brewers Spent Grain Market Key Performance Indicators |
8.1 Percentage of brewers utilizing spent grain for animal feed production |
8.2 Amount of spent grain diverted from landfills |
8.3 Number of partnerships between breweries and animal feed producers for spent grain utilization |
9 Lithuania Brewers Spent Grain Market - Opportunity Assessment |
9.1 Lithuania Brewers Spent Grain Market Opportunity Assessment, By Product, 2022 & 2032F |
9.2 Lithuania Brewers Spent Grain Market Opportunity Assessment, By Application, 2022 & 2032F |
10 Lithuania Brewers Spent Grain Market - Competitive Landscape |
10.1 Lithuania Brewers Spent Grain Market Revenue Share, By Companies, 2025 |
10.2 Lithuania Brewers Spent Grain Market Competitive Benchmarking, By Operating and Technical Parameters |
11 Company Profiles |
12 Recommendations |
13 Disclaimer |
Export potential assessment - trade Analytics for 2030
Export potential enables firms to identify high-growth global markets with greater confidence by combining advanced trade intelligence with a structured quantitative methodology. The framework analyzes emerging demand trends and country-level import patterns while integrating macroeconomic and trade datasets such as GDP and population forecasts, bilateral import–export flows, tariff structures, elasticity differentials between developed and developing economies, geographic distance, and import demand projections. Using weighted trade values from 2020–2024 as the base period to project country-to-country export potential for 2030, these inputs are operationalized through calculated drivers such as gravity model parameters, tariff impact factors, and projected GDP per-capita growth. Through an analysis of hidden potentials, demand hotspots, and market conditions that are most favorable to success, this method enables firms to focus on target countries, maximize returns, and global expansion with data, backed by accuracy.
By factoring in the projected importer demand gap that is currently unmet and could be potential opportunity, it identifies the potential for the Exporter (Country) among 190 countries, against the general trade analysis, which identifies the biggest importer or exporter.
To discover high-growth global markets and optimize your business strategy:
Click Here
Pricing
- Single User License$ 1,995
- Department License$ 2,400
- Site License$ 3,120
- Global License$ 3,795

Search
Thought Leadership and Analyst Meet


Our Clients
Latest Reports
- Canada Cloud CFD Market (2026-2032) | Size & Revenue, Industry, Growth, Competitive Landscape, Forecast, Segmentation, Value, Outlook, Trends, Share, Analysis, Companies
- Taiwan Food Delivery Platform Market (2026-2032) | Companies, Outlook, Analysis, Trends, Value, Revenue, Segmentation, Share, Forecast, Competitive Landscape, Growth, Size & Forecast
- United Kingdom (UK) Long-term Care Insurance Market (2026-2032) | Growth, Share, Consumer Insights, Drivers, Opportunities, Competition, Pricing Analysis, Segments, Restraints, Companies, Competitive, Value, Outlook, Size, Demand, Analysis, Challenges, Strategic Insights, Investment Trends, Revenue, Trends, Supply, Forecast
- United Kingdom (UK) Long Term Care Market (2026-2032) | Companies, Outlook, Analysis, Trends, Value, Revenue, Segmentation, Share, Forecast, Competitive Landscape, Growth, Size & Forecast
- Iraq Insulation and Waterproofing Market (2026-2032) | Outlook, Drivers, Growth, Size, Share, Industry, Revenue, Trends, Demand, Competitive, Strategic Insights, Opportunities, Segments, Companies, Challenges, Strategy, Consumer Insights, Analysis, Investment Trends, Value, Segmentation, Forecast, Restraints
- India Switchgear Market Outlook (2026-2032) | Size, Share, Trends, Growth, Revenue, Forecast, Analysis, Value, Outlook
- Pakistan Contraceptive Implants Market (2025-2031) | Demand, Growth, Size, Share, Industry, Pricing Analysis, Competitive, Strategic Insights, Strategy, Consumer Insights, Analysis, Investment Trends, Opportunities, Revenue, Segments, Value, Segmentation, Supply, Forecast, Restraints, Outlook, Competition, Drivers, Trends, Companies, Challenges
- Sri Lanka Packaging Market (2026-2032) | Outlook, Competition, Drivers, Trends, Demand, Pricing Analysis, Competitive, Strategic Insights, Companies, Challenges, Strategy, Consumer Insights, Analysis, Investment Trends, Opportunities, Growth, Size, Share, Industry, Revenue, Segments, Value, Segmentation, Supply, Forecast, Restraints
- India Kids Watches Market (2026-2032) | Strategy, Consumer Insights, Analysis, Investment Trends, Opportunities, Growth, Size, Share, Industry, Revenue, Segments, Value, Segmentation, Supply, Forecast, Restraints, Outlook, Competition, Drivers, Trends, Demand, Pricing Analysis, Competitive, Strategic Insights, Companies, Challenges
- Saudi Arabia Core Assurance Service Market (2025-2031) | Strategy, Consumer Insights, Analysis, Investment Trends, Opportunities, Growth, Size, Share, Industry, Revenue, Segments, Value, Segmentation, Supply, Forecast, Restraints, Outlook, Competition, Drivers, Trends, Demand, Pricing Analysis, Competitive, Strategic Insights, Companies, Challenges
Industry Events and Analyst Meet

India EV Show 2026

EV tech India Expo 2026

Auto Tech Asia 2026

Battery Tech India 2026

Smart Production Solutions Guangzhou 2026
Whitepaper
- Middle East & Africa Commercial Security Market Click here to view more.
- Middle East & Africa Fire Safety Systems & Equipment Market Click here to view more.
- GCC Drone Market Click here to view more.
- Middle East Lighting Fixture Market Click here to view more.
- GCC Physical & Perimeter Security Market Click here to view more.
6WResearch In News
- Doha a strategic location for EV manufacturing hub: IPA Qatar
- Demand for luxury TVs surging in the GCC, says Samsung
- Empowering Growth: The Thriving Journey of Bangladesh’s Cable Industry
- Demand for luxury TVs surging in the GCC, says Samsung
- Video call with a traditional healer? Once unthinkable, it’s now common in South Africa
- Intelligent Buildings To Smooth GCC’s Path To Net Zero