Lithuania Cake Market (2026-2032) | Forecast, Size, Strategy, Companies, Revenue, Value, Competitive, Pricing Analysis, Demand, Share, Investment Trends, Drivers, Restraints, Trends, Supply, Segmentation, Challenges, Analysis, Consumer Insights, Strategic Insights, Opportunities, Industry, Outlook, Competition, Segments, Growth
Market Forecast By Product Type (Sponge Cake, Cheesecake, Fruit Cake), By Application (Bakery, Desserts, Celebrations), By End User (Restaurants, Cafes, Households), By Ingredient (Flour-Based, Sugar-Based, Egg-Free), By Packaging Type (Boxes, Trays, Wrappers) And Competitive Landscape
| Product Code: ETC11467002 | Publication Date: Apr 2025 | Updated Date: Apr 2026 | Product Type: Market Research Report | |
| Publisher: 6Wresearch | No. of Pages: 65 | No. of Figures: 34 | No. of Tables: 19 | |
Lithuania Cake Market Size (2020-2030)
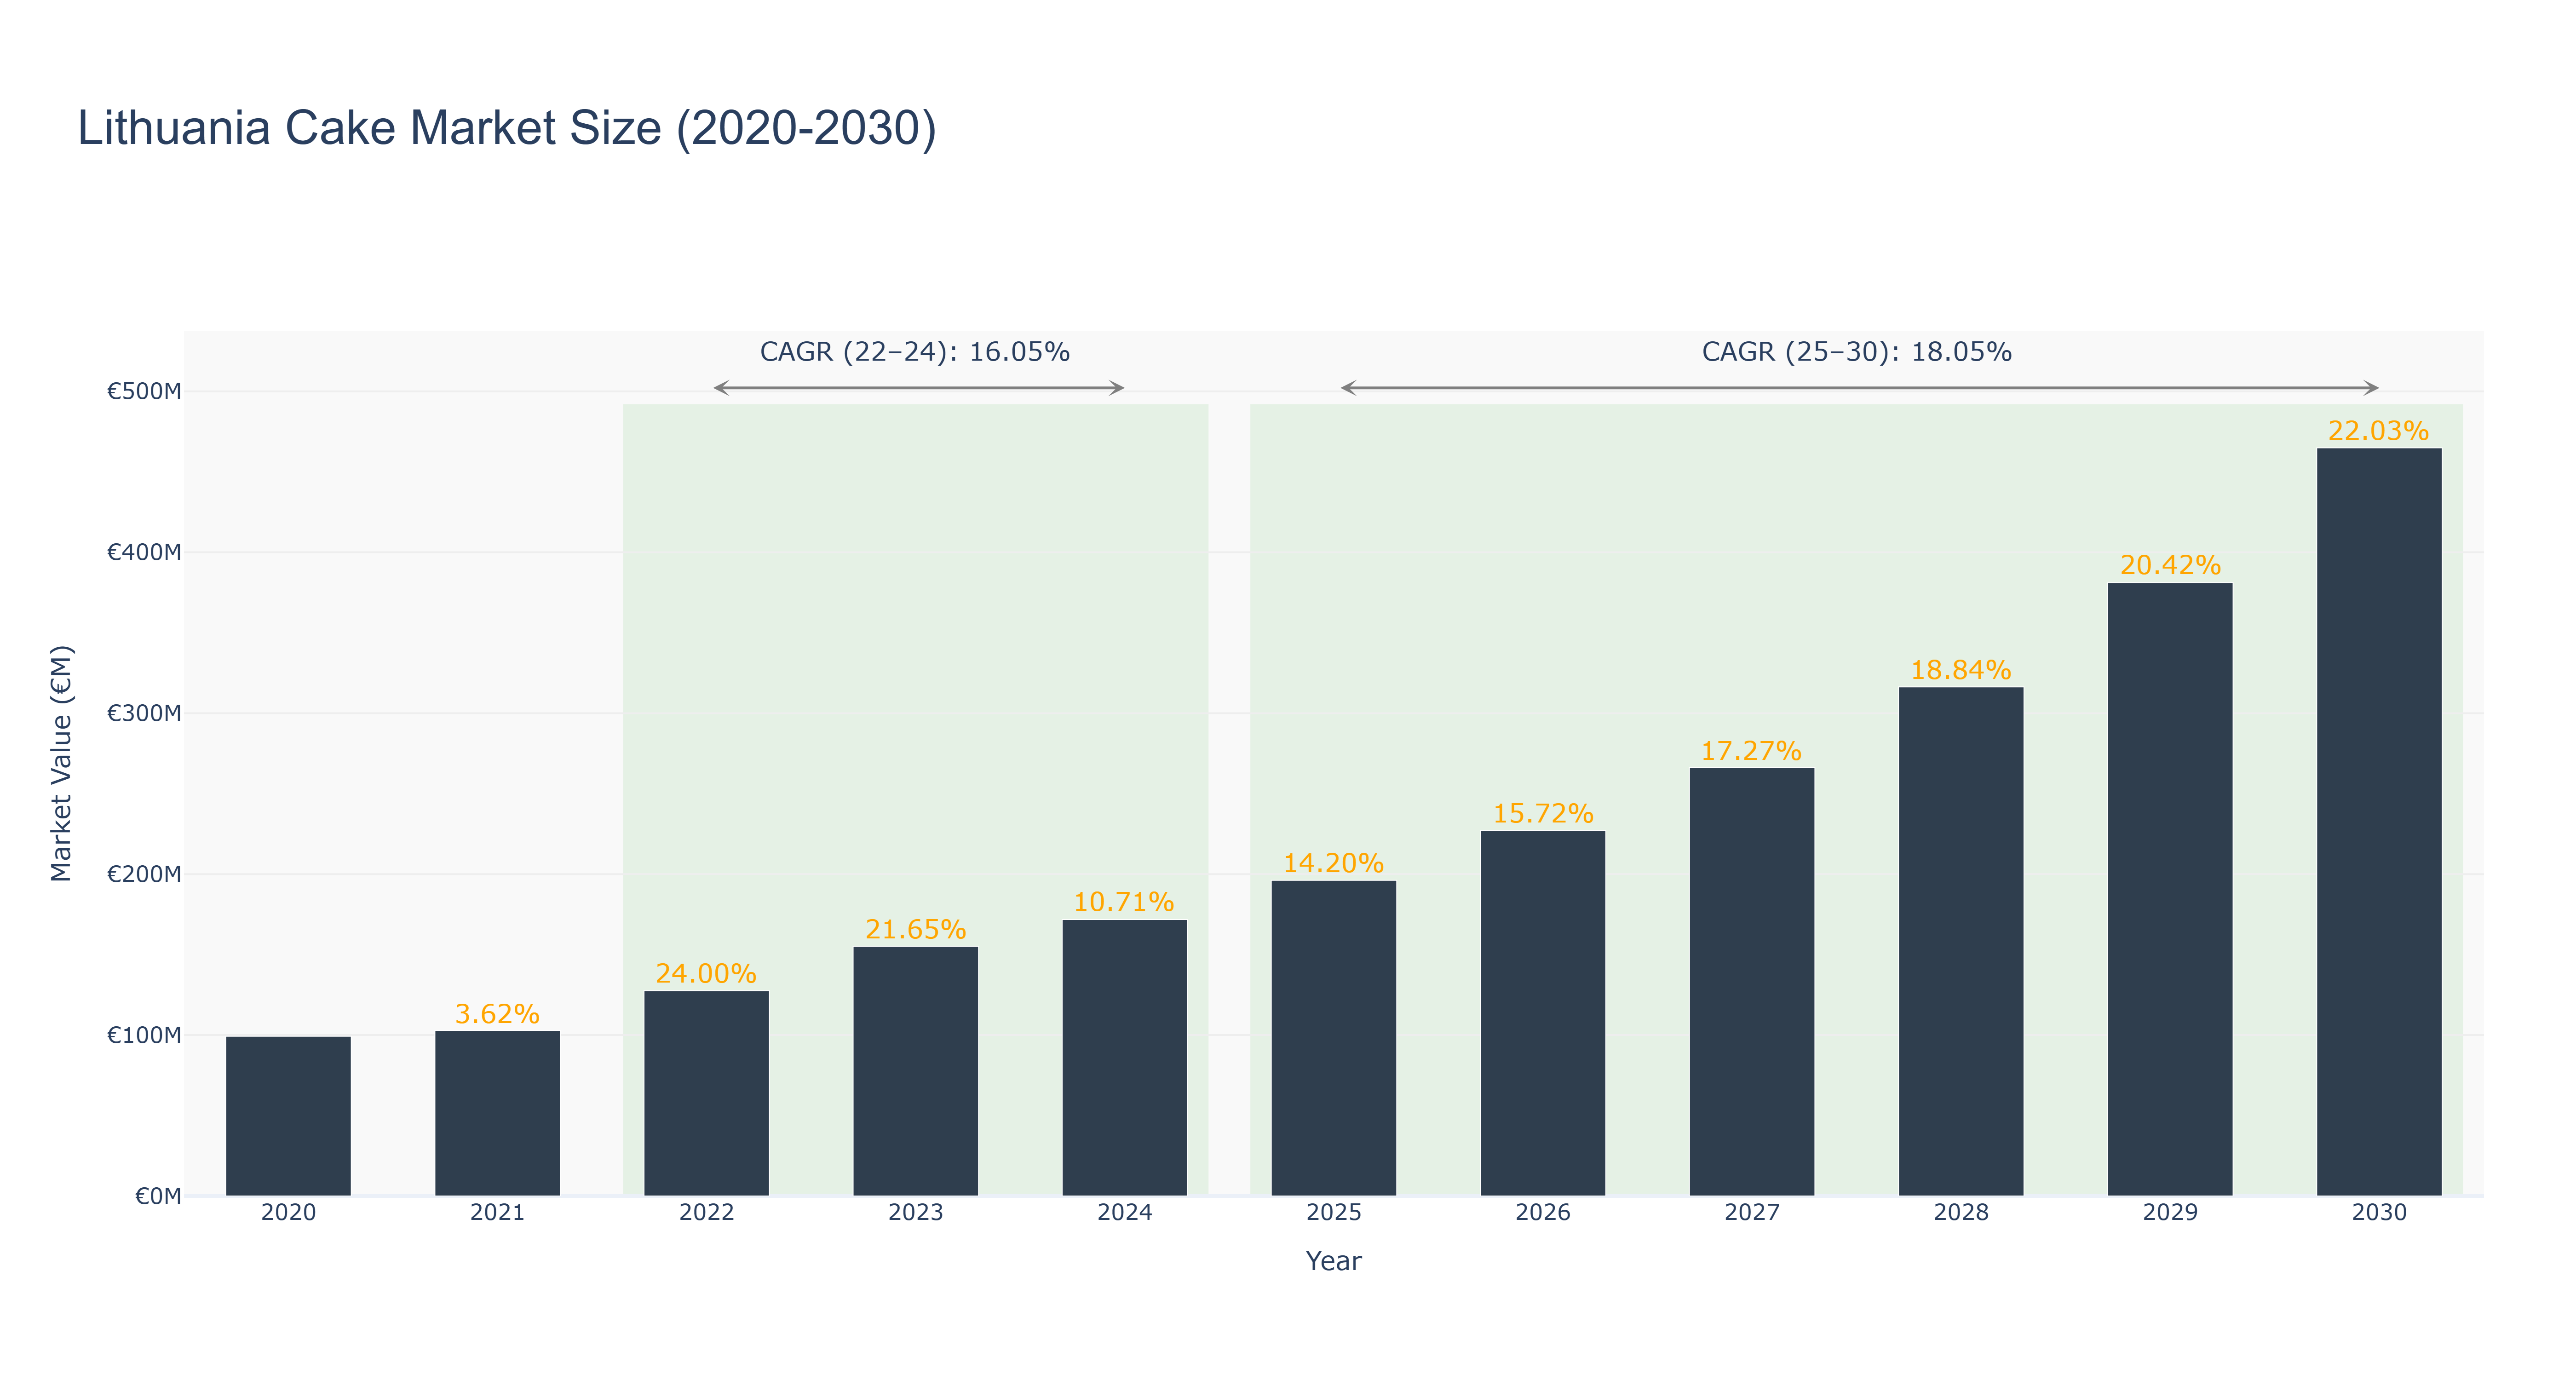
The Lithuania Cake Market has demonstrated robust growth in recent years, with the market size reaching €127.55 million in 2022, followed by €155.16 million in 2023 and €171.78 million in 2024, reflecting a Compound Annual Growth Rate (CAGR) of 16.05% from 2022 to 2024. This growth can be attributed to increasing consumer demand for premium and artisanal cakes, as well as a rising trend of personalized baked goods for celebrations. Looking ahead, the market is projected to grow significantly, with forecasted values of €196.17 million in 2025, €266.21 million in 2027, and €464.91 million by 2030, indicating a CAGR of 18.05% from 2025 to 2030. Factors driving this forecasted expansion include an increasing inclination towards cake customization, heightened disposable incomes, and a growing café culture in Lithuania. As the market evolves, innovations in flavors and health-conscious options are likely to play a pivotal role in shaping consumer preferences.
Lithuania Cake Market: Production & Trade Performance (2019-2025)
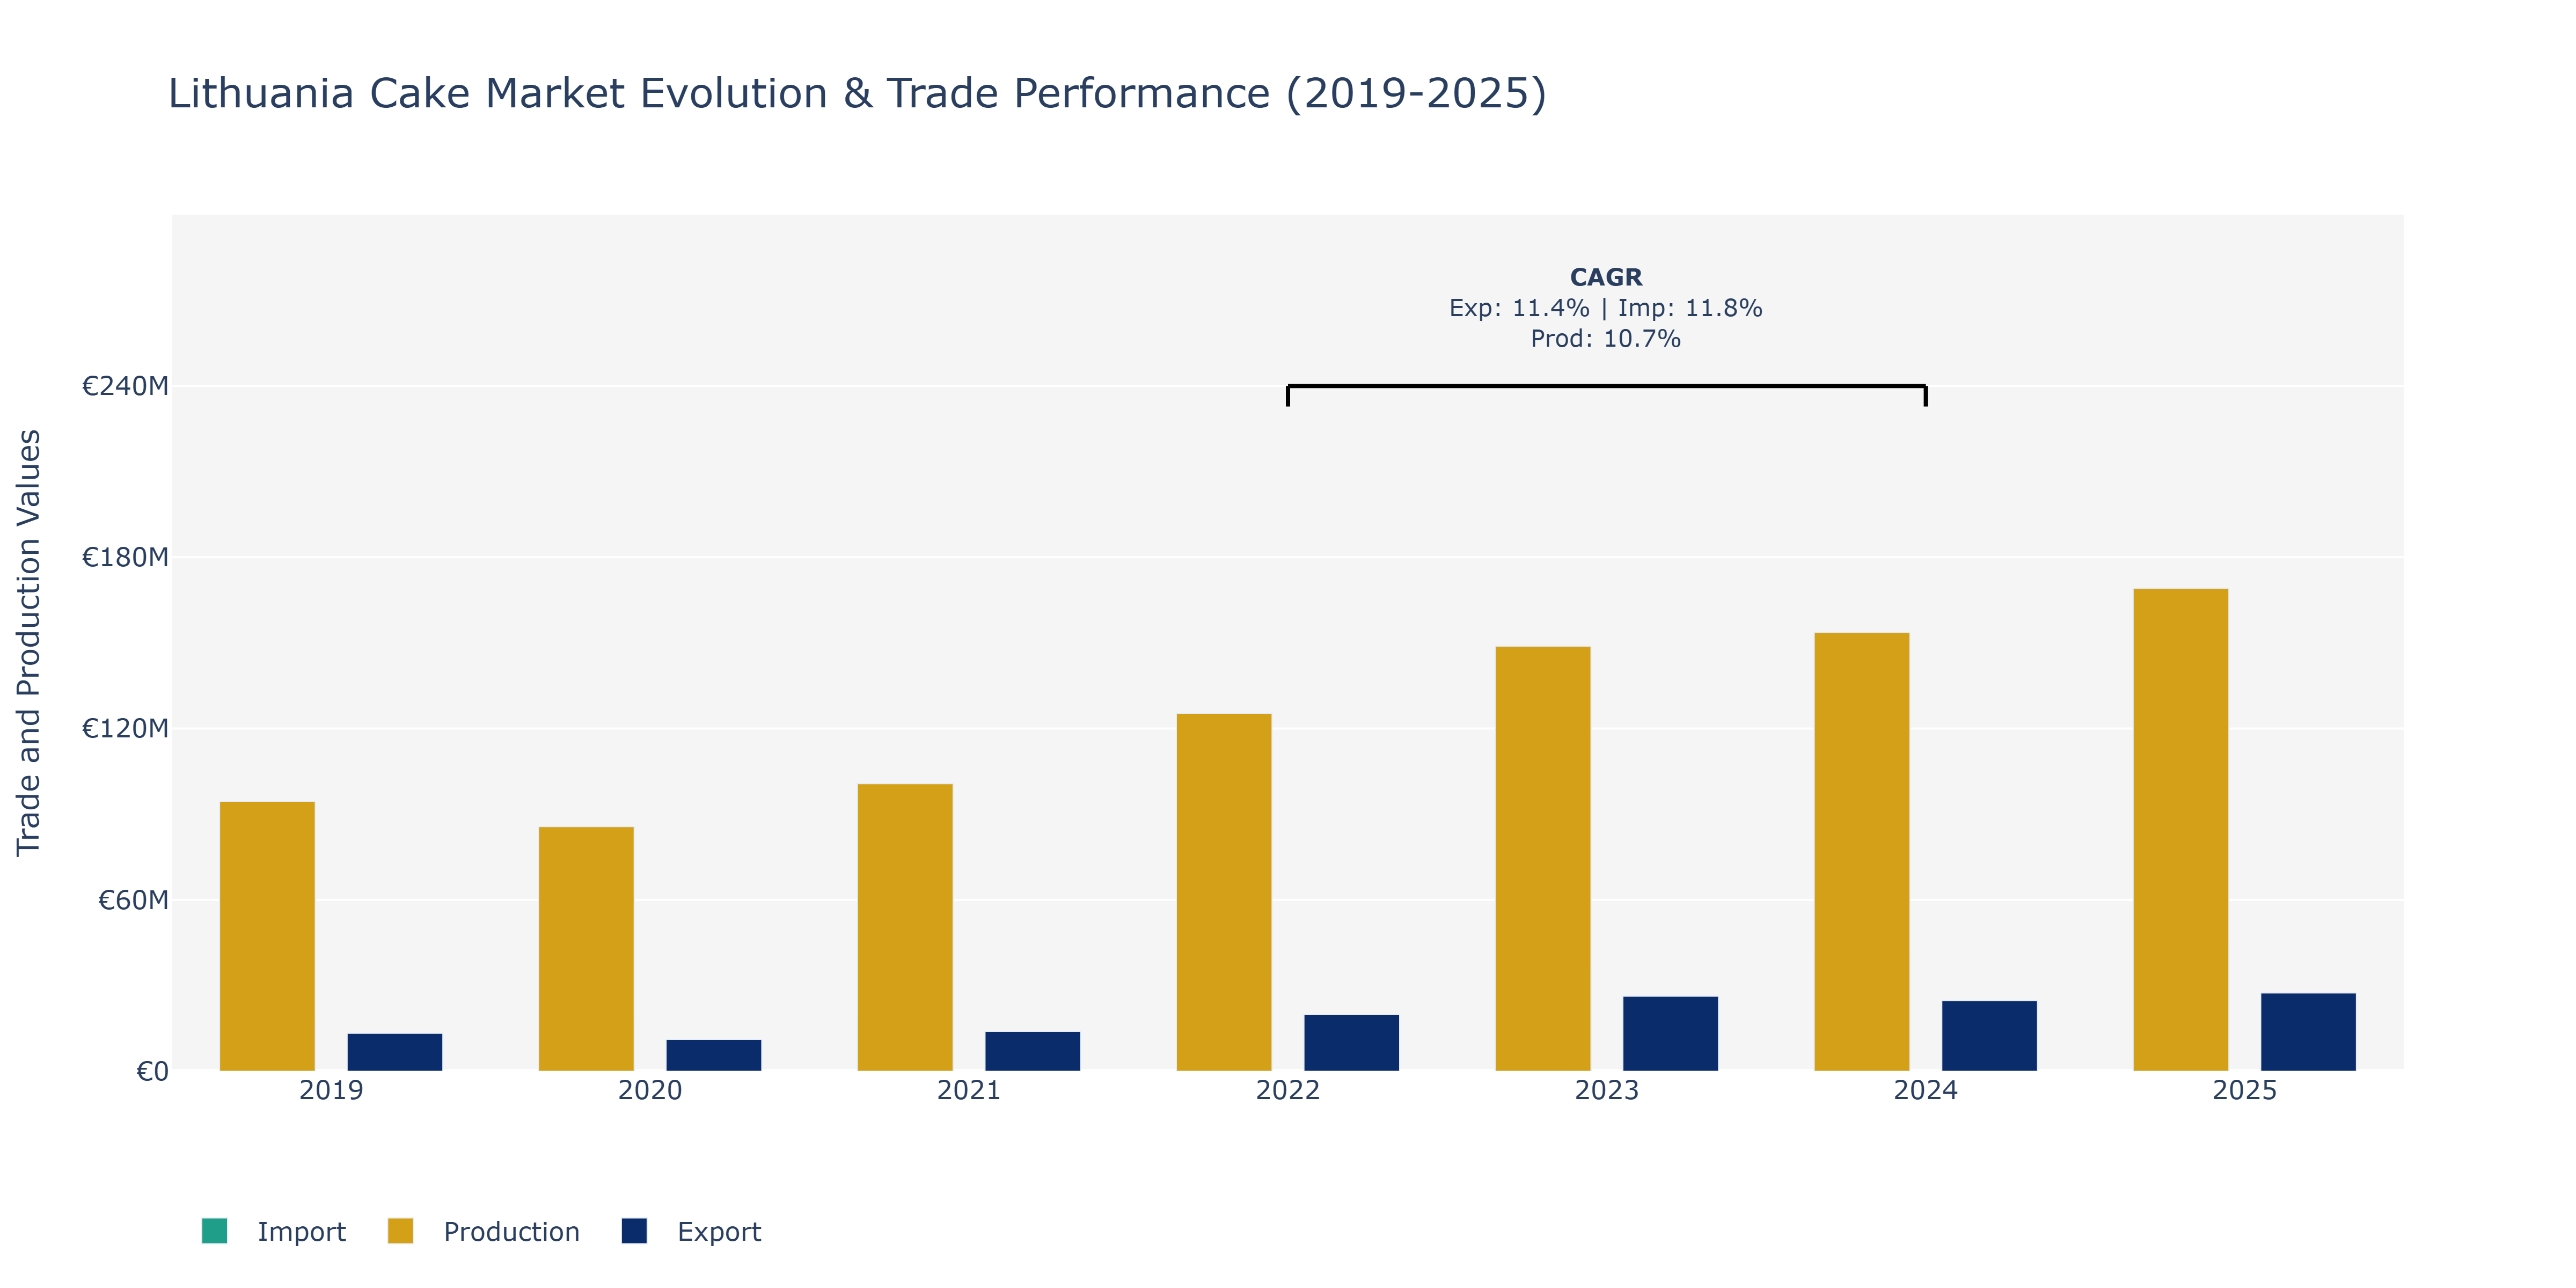
Between 2019 and 2025, the Lithuania Cake Market witnessed varying trends in Exports, Imports, and Production. Exports started at €13.26 million in 2019, decreased to €11.12 million in 2020, and then exhibited a steady upward trajectory, reaching a peak of €27.37 million in 2025. Imports followed a similar pattern, beginning at €18.39 million in 2019, dipping to €17.2 million in 2020, and then consistently rising to €45.15 million in 2025. Production, on the other hand, showed a continuous growth from €94.54 million in 2019 to €169.13 million in 2025. These fluctuations can be attributed to evolving consumer preferences, economic conditions affecting purchasing power, and advancements in production technologies driving efficiency and output. Real-world developments like increasing demand for high-quality baked goods in Lithuania and expanding global trade relations could have influenced these market dynamics.
Key Highlights of the Report:
- Lithuania Cake Market Outlook
- Market Size of Lithuania Cake Market, 2025
- Forecast of Lithuania Cake Market, 2032
- Historical Data and Forecast of Lithuania Cake Revenues & Volume for the Period 2022 - 2032F
- Lithuania Cake Market Trend Evolution
- Lithuania Cake Market Drivers and Challenges
- Lithuania Cake Price Trends
- Lithuania Cake Porter's Five Forces
- Lithuania Cake Industry Life Cycle
- Historical Data and Forecast of Lithuania Cake Market Revenues & Volume By Product Type for the Period 2022 - 2032F
- Historical Data and Forecast of Lithuania Cake Market Revenues & Volume By Sponge Cake for the Period 2022 - 2032F
- Historical Data and Forecast of Lithuania Cake Market Revenues & Volume By Cheesecake for the Period 2022 - 2032F
- Historical Data and Forecast of Lithuania Cake Market Revenues & Volume By Fruit Cake for the Period 2022 - 2032F
- Historical Data and Forecast of Lithuania Cake Market Revenues & Volume By Application for the Period 2022 - 2032F
- Historical Data and Forecast of Lithuania Cake Market Revenues & Volume By Bakery for the Period 2022 - 2032F
- Historical Data and Forecast of Lithuania Cake Market Revenues & Volume By Desserts for the Period 2022 - 2032F
- Historical Data and Forecast of Lithuania Cake Market Revenues & Volume By Celebrations for the Period 2022 - 2032F
- Historical Data and Forecast of Lithuania Cake Market Revenues & Volume By End User for the Period 2022 - 2032F
- Historical Data and Forecast of Lithuania Cake Market Revenues & Volume By Restaurants for the Period 2022 - 2032F
- Historical Data and Forecast of Lithuania Cake Market Revenues & Volume By Cafes for the Period 2022 - 2032F
- Historical Data and Forecast of Lithuania Cake Market Revenues & Volume By Households for the Period 2022 - 2032F
- Historical Data and Forecast of Lithuania Cake Market Revenues & Volume By Ingredient for the Period 2022 - 2032F
- Historical Data and Forecast of Lithuania Cake Market Revenues & Volume By Flour-Based for the Period 2022 - 2032F
- Historical Data and Forecast of Lithuania Cake Market Revenues & Volume By Sugar-Based for the Period 2022 - 2032F
- Historical Data and Forecast of Lithuania Cake Market Revenues & Volume By Egg-Free for the Period 2022 - 2032F
- Historical Data and Forecast of Lithuania Cake Market Revenues & Volume By Packaging Type for the Period 2022 - 2032F
- Historical Data and Forecast of Lithuania Cake Market Revenues & Volume By Boxes for the Period 2022 - 2032F
- Historical Data and Forecast of Lithuania Cake Market Revenues & Volume By Trays for the Period 2022 - 2032F
- Historical Data and Forecast of Lithuania Cake Market Revenues & Volume By Wrappers for the Period 2022 - 2032F
- Lithuania Cake Import Export Trade Statistics
- Market Opportunity Assessment By Product Type
- Market Opportunity Assessment By Application
- Market Opportunity Assessment By End User
- Market Opportunity Assessment By Ingredient
- Market Opportunity Assessment By Packaging Type
- Lithuania Cake Top Companies Market Share
- Lithuania Cake Competitive Benchmarking By Technical and Operational Parameters
- Lithuania Cake Company Profiles
- Lithuania Cake Key Strategic Recommendations
Frequently Asked Questions About the Market Study (FAQs):
6Wresearch actively monitors the Lithuania Cake Market and publishes its comprehensive annual report, highlighting emerging trends, growth drivers, revenue analysis, and forecast outlook. Our insights help businesses to make data-backed strategic decisions with ongoing market dynamics. Our analysts track relevent industries related to the Lithuania Cake Market, allowing our clients with actionable intelligence and reliable forecasts tailored to emerging regional needs.
Yes, we provide customisation as per your requirements. To learn more, feel free to contact us on sales@6wresearch.com
1 Executive Summary |
2 Introduction |
2.1 Key Highlights of the Report |
2.2 Report Description |
2.3 Market Scope & Segmentation |
2.4 Research Methodology |
2.5 Assumptions |
3 Lithuania Cake Market Overview |
3.1 Lithuania Country Macro Economic Indicators |
3.2 Lithuania Cake Market Revenues & Volume, 2022 & 2032F |
3.3 Lithuania Cake Market - Industry Life Cycle |
3.4 Lithuania Cake Market - Porter's Five Forces |
3.5 Lithuania Cake Market Revenues & Volume Share, By Product Type, 2022 & 2032F |
3.6 Lithuania Cake Market Revenues & Volume Share, By Application, 2022 & 2032F |
3.7 Lithuania Cake Market Revenues & Volume Share, By End User, 2022 & 2032F |
3.8 Lithuania Cake Market Revenues & Volume Share, By Ingredient, 2022 & 2032F |
3.9 Lithuania Cake Market Revenues & Volume Share, By Packaging Type, 2022 & 2032F |
4 Lithuania Cake Market Dynamics |
4.1 Impact Analysis |
4.2 Market Drivers |
4.3 Market Restraints |
5 Lithuania Cake Market Trends |
6 Lithuania Cake Market, By Types |
6.1 Lithuania Cake Market, By Product Type |
6.1.1 Overview and Analysis |
6.1.2 Lithuania Cake Market Revenues & Volume, By Product Type, 2022 - 2032F |
6.1.3 Lithuania Cake Market Revenues & Volume, By Sponge Cake, 2022 - 2032F |
6.1.4 Lithuania Cake Market Revenues & Volume, By Cheesecake, 2022 - 2032F |
6.1.5 Lithuania Cake Market Revenues & Volume, By Fruit Cake, 2022 - 2032F |
6.2 Lithuania Cake Market, By Application |
6.2.1 Overview and Analysis |
6.2.2 Lithuania Cake Market Revenues & Volume, By Bakery, 2022 - 2032F |
6.2.3 Lithuania Cake Market Revenues & Volume, By Desserts, 2022 - 2032F |
6.2.4 Lithuania Cake Market Revenues & Volume, By Celebrations, 2022 - 2032F |
6.3 Lithuania Cake Market, By End User |
6.3.1 Overview and Analysis |
6.3.2 Lithuania Cake Market Revenues & Volume, By Restaurants, 2022 - 2032F |
6.3.3 Lithuania Cake Market Revenues & Volume, By Cafes, 2022 - 2032F |
6.3.4 Lithuania Cake Market Revenues & Volume, By Households, 2022 - 2032F |
6.4 Lithuania Cake Market, By Ingredient |
6.4.1 Overview and Analysis |
6.4.2 Lithuania Cake Market Revenues & Volume, By Flour-Based, 2022 - 2032F |
6.4.3 Lithuania Cake Market Revenues & Volume, By Sugar-Based, 2022 - 2032F |
6.4.4 Lithuania Cake Market Revenues & Volume, By Egg-Free, 2022 - 2032F |
6.5 Lithuania Cake Market, By Packaging Type |
6.5.1 Overview and Analysis |
6.5.2 Lithuania Cake Market Revenues & Volume, By Boxes, 2022 - 2032F |
6.5.3 Lithuania Cake Market Revenues & Volume, By Trays, 2022 - 2032F |
6.5.4 Lithuania Cake Market Revenues & Volume, By Wrappers, 2022 - 2032F |
7 Lithuania Cake Market Import-Export Trade Statistics |
7.1 Lithuania Cake Market Export to Major Countries |
7.2 Lithuania Cake Market Imports from Major Countries |
8 Lithuania Cake Market Key Performance Indicators |
9 Lithuania Cake Market - Opportunity Assessment |
9.1 Lithuania Cake Market Opportunity Assessment, By Product Type, 2022 & 2032F |
9.2 Lithuania Cake Market Opportunity Assessment, By Application, 2022 & 2032F |
9.3 Lithuania Cake Market Opportunity Assessment, By End User, 2022 & 2032F |
9.4 Lithuania Cake Market Opportunity Assessment, By Ingredient, 2022 & 2032F |
9.5 Lithuania Cake Market Opportunity Assessment, By Packaging Type, 2022 & 2032F |
10 Lithuania Cake Market - Competitive Landscape |
10.1 Lithuania Cake Market Revenue Share, By Companies, 2025 |
10.2 Lithuania Cake Market Competitive Benchmarking, By Operating and Technical Parameters |
11 Company Profiles |
12 Recommendations |
13 Disclaimer |
Global Go To Market Strategy - 2030
Export potential enables firms to identify high-growth global markets with greater confidence by combining advanced trade intelligence with a structured quantitative methodology. The framework analyzes emerging demand trends and country-level import patterns while integrating macroeconomic and trade datasets such as GDP and population forecasts, bilateral import–export flows, tariff structures, elasticity differentials between developed and developing economies, geographic distance, and import demand projections. Using weighted trade values from 2020–2024 as the base period to project country-to-country export potential for 2030, these inputs are operationalized through calculated drivers such as gravity model parameters, tariff impact factors, and projected GDP per-capita growth. Through an analysis of hidden potentials, demand hotspots, and market conditions that are most favorable to success, this method enables firms to focus on target countries, maximize returns, and global expansion with data, backed by accuracy.
By factoring in the projected importer demand gap that is currently unmet and could be potential opportunity, it identifies the potential for the Exporter (Country) among 190 countries, against the general trade analysis, which identifies the biggest importer or exporter.
To discover high-growth global markets and optimize your business strategy:
Click Here
Pricing
- Single User License$ 1,995
- Department License$ 2,400
- Site License$ 3,120
- Global License$ 3,795

Leadership Perspectives from Industry Events
Search
Thought Leadership and Analyst Meet


Our Clients
6WResearch In News
- Doha a strategic location for EV manufacturing hub: IPA Qatar
- Demand for luxury TVs surging in the GCC, says Samsung
- Empowering Growth: The Thriving Journey of Bangladesh’s Cable Industry
- Demand for luxury TVs surging in the GCC, says Samsung
- Video call with a traditional healer? Once unthinkable, it’s now common in South Africa
- Intelligent Buildings To Smooth GCC’s Path To Net Zero
Latest Reports
- New Zealand Aseptic Manufacturing Market (2026-2032)
- Netherlands Aseptic Manufacturing Market (2026-2032)
- Nauru Aseptic Manufacturing Market (2026-2032)
- Namibia Aseptic Manufacturing Market (2026-2032)
- Mozambique Aseptic Manufacturing Market (2026-2032)
- Montenegro Aseptic Manufacturing Market (2026-2032)
- Mongolia Aseptic Manufacturing Market (2026-2032)
- Monaco Aseptic Manufacturing Market (2026-2032)
- Micronesia Aseptic Manufacturing Market (2026-2032)
- Mauritius Aseptic Manufacturing Market (2026-2032)
Industry Events and Analyst Meet

HIMTEX 2026

India Refining Summit 2026

India EV Show 2026

EV tech India Expo 2026

Auto Tech Asia 2026
Whitepaper
- Middle East & Africa Commercial Security Market Click here to view more.
- Middle East & Africa Fire Safety Systems & Equipment Market Click here to view more.
- GCC Drone Market Click here to view more.
- Middle East Lighting Fixture Market Click here to view more.
- GCC Physical & Perimeter Security Market Click here to view more.