Lithuania Cement Clinker Market (2025-2031) | Outlook, Analysis, Value, Revenue, Industry, Trends, Growth, Forecast, Segmentation, Companies, Share & Size
Market Forecast By Product Type (White Clinker, Portland Clinker, Sulfate Resistant Clinker, Other), By Applications (Residential, Non-residential, Infrastructure) And Competitive Landscape
| Product Code: ETC5255953 | Publication Date: Nov 2023 | Updated Date: Apr 2026 | Product Type: Market Research Report | |
| Publisher: 6Wresearch | Author: Ravi Bhandari | No. of Pages: 60 | No. of Figures: 30 | No. of Tables: 5 |
Lithuania Cement Clinker Market Size (2020-2030)
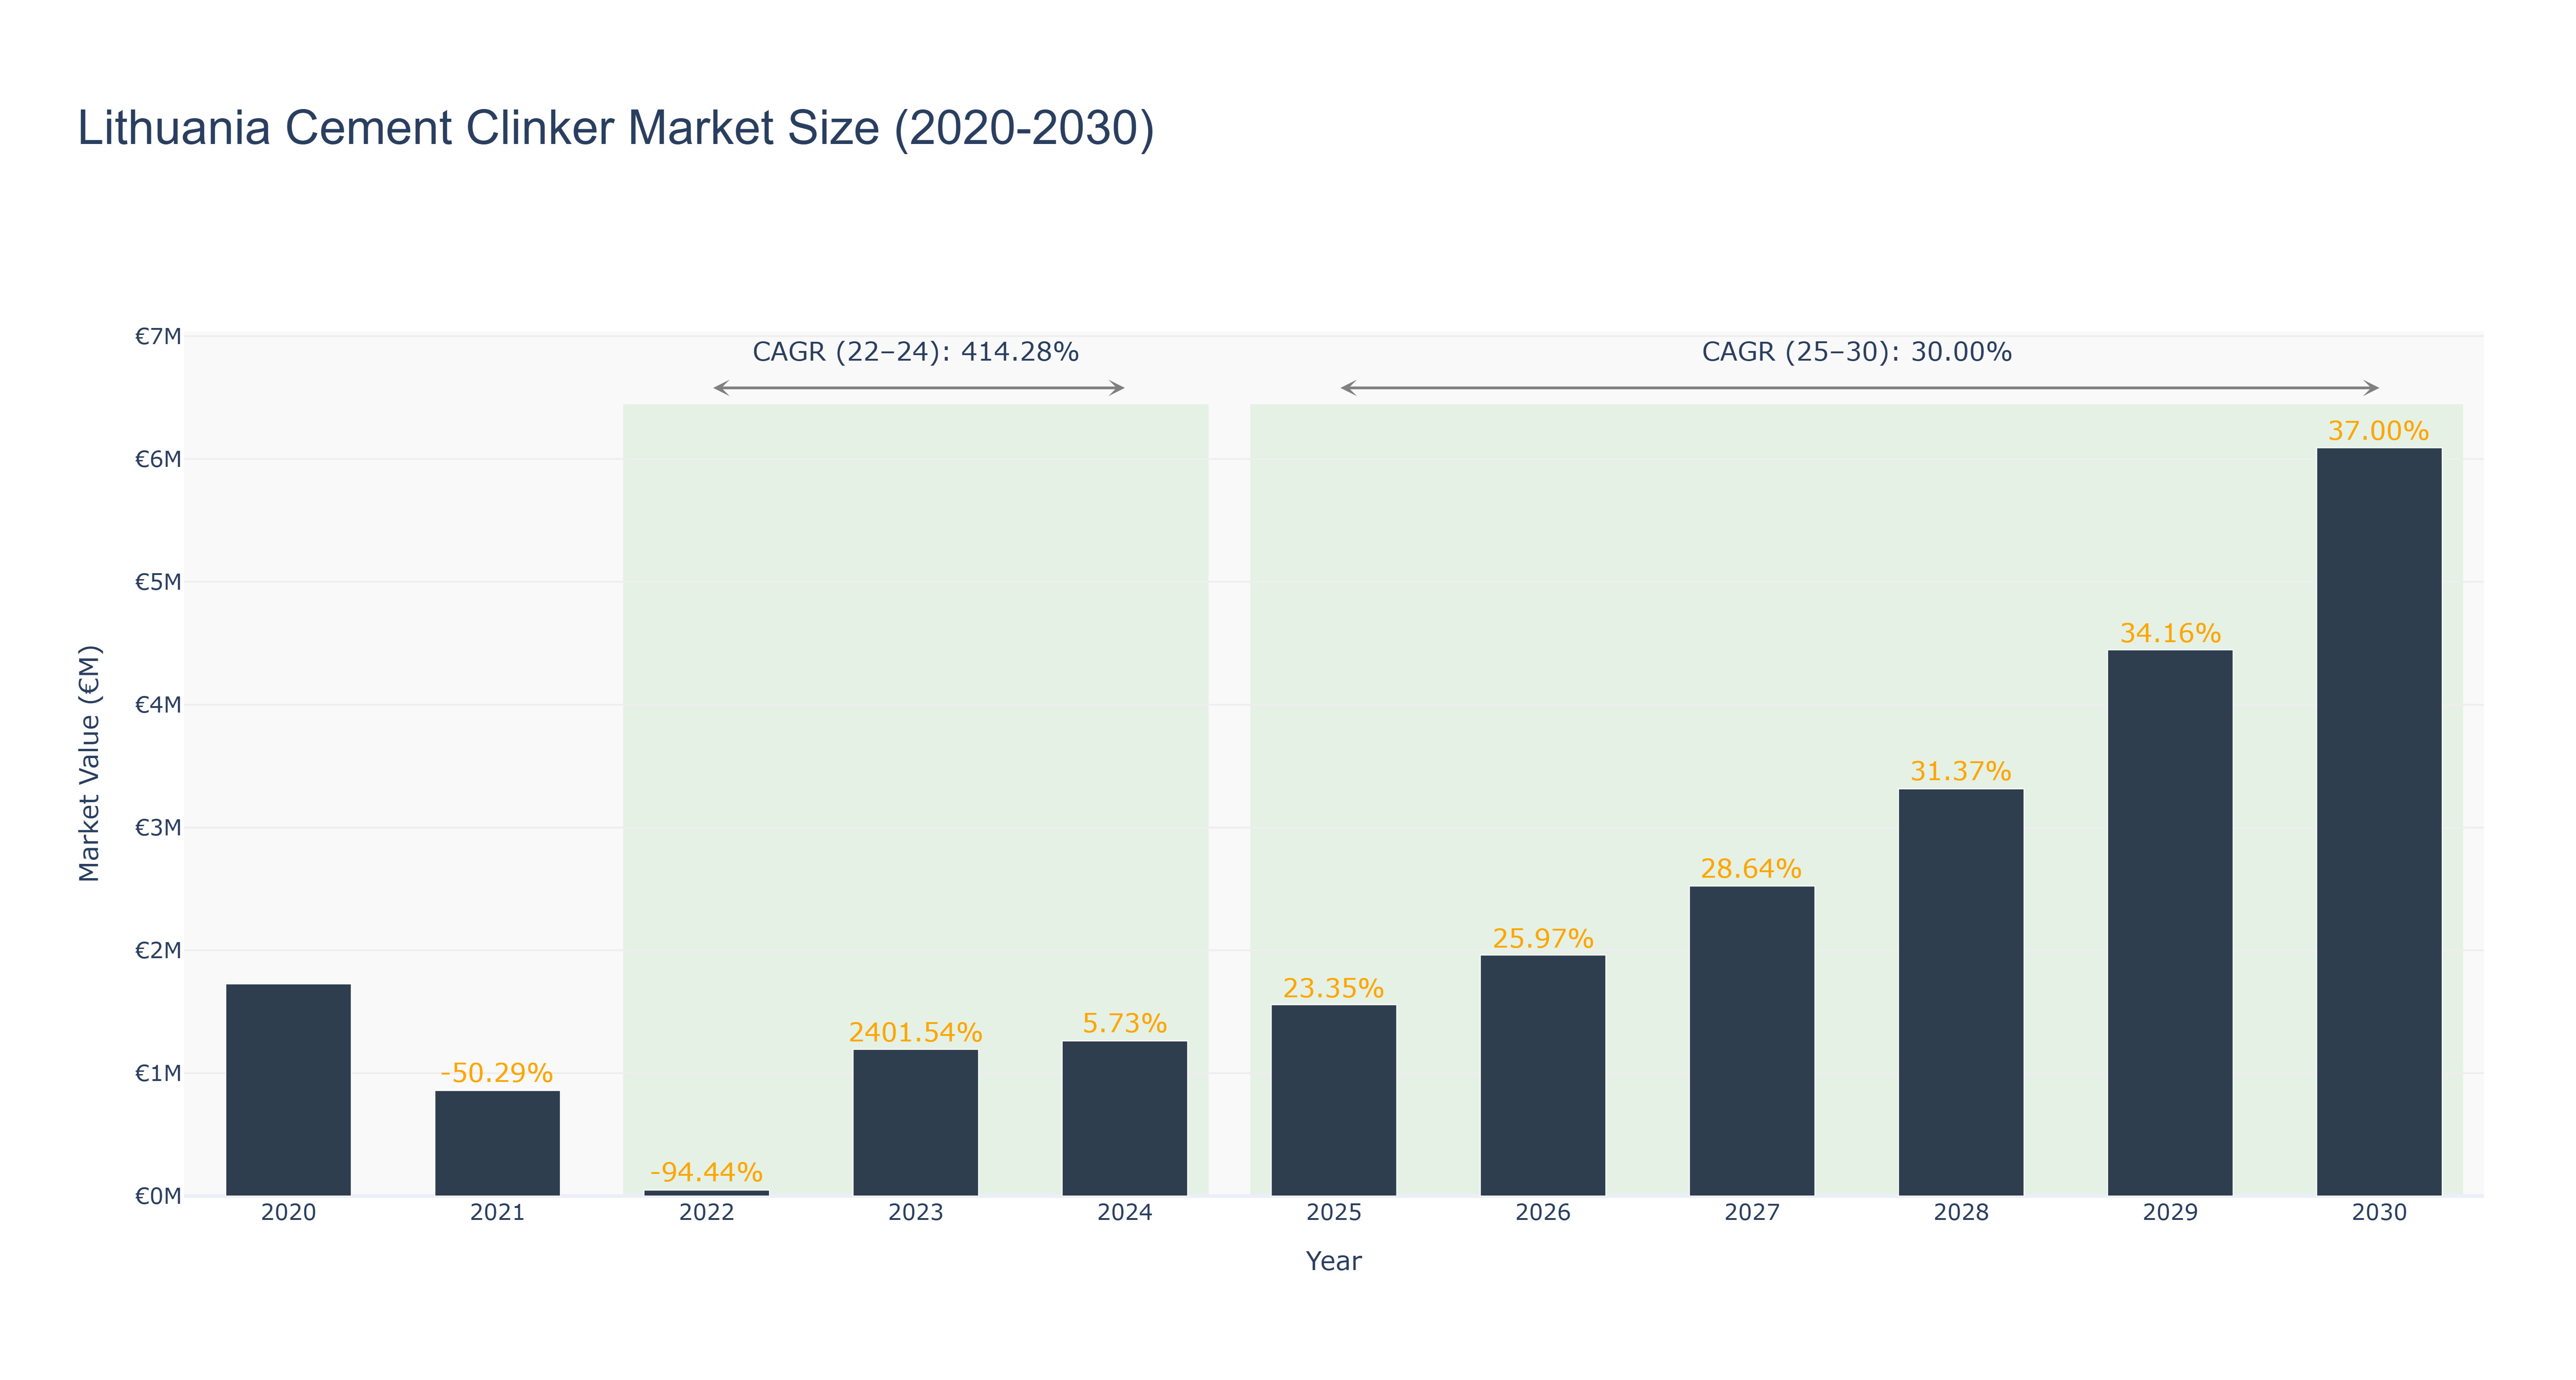
The Lithuania Cement Clinker Market exhibited significant volatility from 2020 to 2024, peaking at €1.73 million in 2020 before experiencing a drastic decline to €47.71 thousand in 2022, reflecting a staggering growth rate of -94.44%. However, this downturn was followed by a remarkable recovery in 2023, with the market rebounding to €1.19 million, showcasing an extraordinary growth of 2401.54%. The actual data from 2022 to 2024 reveals a compound annual growth rate (CAGR) of 414.28%, driven by increased construction activity and infrastructure projects in Lithuania. Looking ahead, the forecasted period from 2025 to 2030 anticipates steady growth, with market sizes projected to reach €6.09 million by 2030, reflecting a CAGR of 30.00%. This optimistic outlook is supported by ongoing investments in the construction sector and a growing demand for sustainable building materials, positioning Lithuania as a key player in the regional cement clinker market.
Lithuania Cement Clinker Market: Production & Trade Performance (2019-2025)
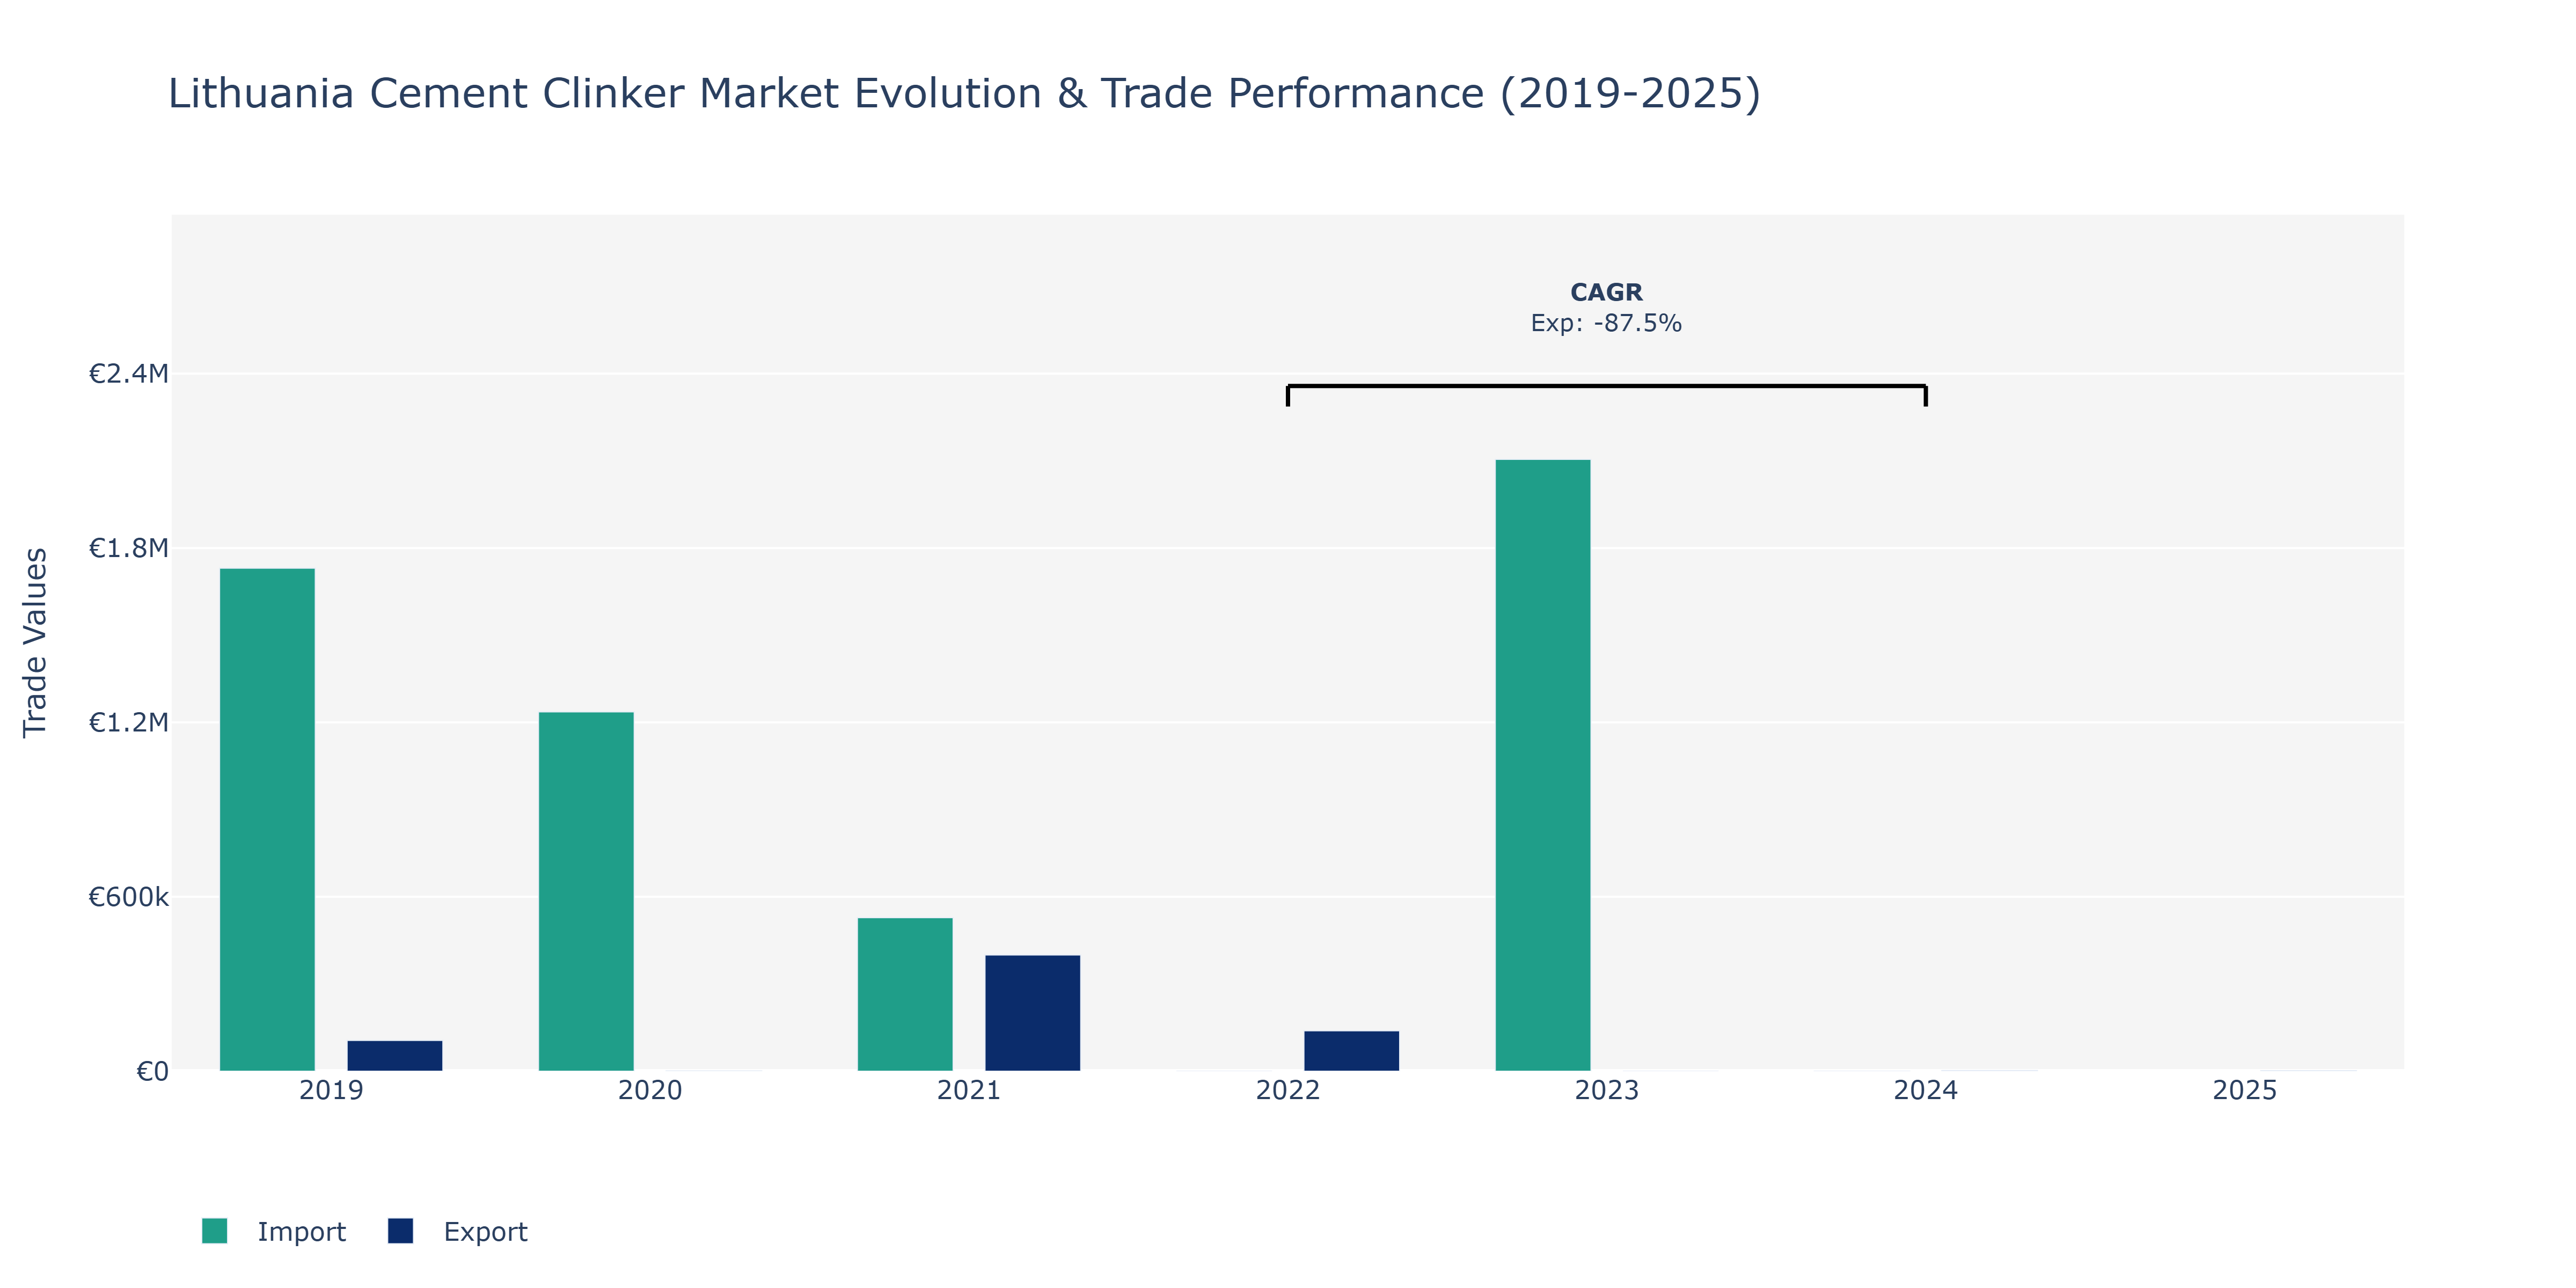
In the Lithuania Cement Clinker Market, exports and imports experienced notable fluctuations over the years. In 2019, imports dominated at €1.73 million, significantly surpassing exports at €105.74 thousand. However, in 2020, both exports and imports declined, with exports plummeting to €733 thousand and imports to €1.24 million. The market saw a sharp rebound in 2021, with exports surging to €399.76 thousand and imports declining to €528.34 thousand. Interestingly, 2022 witnessed a substantial drop in exports to €138.81 thousand, while imports experienced a significant increase to €2.1 million in 2023. 2024 highlighted a minor recovery in exports to €2.16 thousand, accompanied by a drastic fall in imports to €99 million. The market closed in 2025 with exports at €1.62 thousand. These fluctuations could be attributed to global market demand, trade agreements, currency exchange rates, and infrastructure developments impacting the cement industry in Lithuania.
Key Highlights of the Report:
- Lithuania Cement Clinker Market Outlook
- Market Size of Lithuania Cement Clinker Market, 2024
- Forecast of Lithuania Cement Clinker Market, 2031
- Historical Data and Forecast of Lithuania Cement Clinker Revenues & Volume for the Period 2021-2031
- Lithuania Cement Clinker Market Trend Evolution
- Lithuania Cement Clinker Market Drivers and Challenges
- Lithuania Cement Clinker Price Trends
- Lithuania Cement Clinker Porter`s Five Forces
- Lithuania Cement Clinker Industry Life Cycle
- Historical Data and Forecast of Lithuania Cement Clinker Market Revenues & Volume By Product Type for the Period 2021-2031
- Historical Data and Forecast of Lithuania Cement Clinker Market Revenues & Volume By White Clinker for the Period 2021-2031
- Historical Data and Forecast of Lithuania Cement Clinker Market Revenues & Volume By Portland Clinker for the Period 2021-2031
- Historical Data and Forecast of Lithuania Cement Clinker Market Revenues & Volume By Sulfate Resistant Clinker for the Period 2021-2031
- Historical Data and Forecast of Lithuania Cement Clinker Market Revenues & Volume By Other for the Period 2021-2031
- Historical Data and Forecast of Lithuania Cement Clinker Market Revenues & Volume By Applications for the Period 2021-2031
- Historical Data and Forecast of Lithuania Cement Clinker Market Revenues & Volume By Residential for the Period 2021-2031
- Historical Data and Forecast of Lithuania Cement Clinker Market Revenues & Volume By Non-residential for the Period 2021-2031
- Historical Data and Forecast of Lithuania Cement Clinker Market Revenues & Volume By Infrastructure for the Period 2021-2031
- Lithuania Cement Clinker Import Export Trade Statistics
- Market Opportunity Assessment By Product Type
- Market Opportunity Assessment By Applications
- Lithuania Cement Clinker Top Companies Market Share
- Lithuania Cement Clinker Competitive Benchmarking By Technical and Operational Parameters
- Lithuania Cement Clinker Company Profiles
- Lithuania Cement Clinker Key Strategic Recommendations
Frequently Asked Questions About the Market Study (FAQs):
6Wresearch actively monitors the Lithuania Cement Clinker Market and publishes its comprehensive annual report, highlighting emerging trends, growth drivers, revenue analysis, and forecast outlook. Our insights help businesses to make data-backed strategic decisions with ongoing market dynamics. Our analysts track relevent industries related to the Lithuania Cement Clinker Market, allowing our clients with actionable intelligence and reliable forecasts tailored to emerging regional needs.
Yes, we provide customisation as per your requirements. To learn more, feel free to contact us on sales@6wresearch.com
1 Executive Summary |
2 Introduction |
2.1 Key Highlights of the Report |
2.2 Report Description |
2.3 Market Scope & Segmentation |
2.4 Research Methodology |
2.5 Assumptions |
3 Lithuania Cement Clinker Market Overview |
3.1 Lithuania Country Macro Economic Indicators |
3.2 Lithuania Cement Clinker Market Revenues & Volume, 2021 & 2031F |
3.3 Lithuania Cement Clinker Market - Industry Life Cycle |
3.4 Lithuania Cement Clinker Market - Porter's Five Forces |
3.5 Lithuania Cement Clinker Market Revenues & Volume Share, By Product Type, 2021 & 2031F |
3.6 Lithuania Cement Clinker Market Revenues & Volume Share, By Applications, 2021 & 2031F |
4 Lithuania Cement Clinker Market Dynamics |
4.1 Impact Analysis |
4.2 Market Drivers |
4.2.1 Increasing construction activities in Lithuania |
4.2.2 Infrastructure development projects driving demand for cement clinker |
4.2.3 Growing focus on sustainable construction practices |
4.3 Market Restraints |
4.3.1 Fluctuating raw material prices impacting production costs |
4.3.2 Competition from alternative building materials |
4.3.3 Environmental regulations affecting production processes |
5 Lithuania Cement Clinker Market Trends |
6 Lithuania Cement Clinker Market Segmentations |
6.1 Lithuania Cement Clinker Market, By Product Type |
6.1.1 Overview and Analysis |
6.1.2 Lithuania Cement Clinker Market Revenues & Volume, By White Clinker, 2021-2031F |
6.1.3 Lithuania Cement Clinker Market Revenues & Volume, By Portland Clinker, 2021-2031F |
6.1.4 Lithuania Cement Clinker Market Revenues & Volume, By Sulfate Resistant Clinker, 2021-2031F |
6.1.5 Lithuania Cement Clinker Market Revenues & Volume, By Other, 2021-2031F |
6.2 Lithuania Cement Clinker Market, By Applications |
6.2.1 Overview and Analysis |
6.2.2 Lithuania Cement Clinker Market Revenues & Volume, By Residential, 2021-2031F |
6.2.3 Lithuania Cement Clinker Market Revenues & Volume, By Non-residential, 2021-2031F |
6.2.4 Lithuania Cement Clinker Market Revenues & Volume, By Infrastructure, 2021-2031F |
7 Lithuania Cement Clinker Market Import-Export Trade Statistics |
7.1 Lithuania Cement Clinker Market Export to Major Countries |
7.2 Lithuania Cement Clinker Market Imports from Major Countries |
8 Lithuania Cement Clinker Market Key Performance Indicators |
8.1 Energy efficiency improvements in cement clinker production |
8.2 Carbon footprint reduction initiatives |
8.3 Adoption of alternative fuels in manufacturing processes |
9 Lithuania Cement Clinker Market - Opportunity Assessment |
9.1 Lithuania Cement Clinker Market Opportunity Assessment, By Product Type, 2021 & 2031F |
9.2 Lithuania Cement Clinker Market Opportunity Assessment, By Applications, 2021 & 2031F |
10 Lithuania Cement Clinker Market - Competitive Landscape |
10.1 Lithuania Cement Clinker Market Revenue Share, By Companies, 2024 |
10.2 Lithuania Cement Clinker Market Competitive Benchmarking, By Operating and Technical Parameters |
11 Company Profiles |
12 Recommendations | 13 Disclaimer |
Global Go To Market Strategy - 2030
Export potential enables firms to identify high-growth global markets with greater confidence by combining advanced trade intelligence with a structured quantitative methodology. The framework analyzes emerging demand trends and country-level import patterns while integrating macroeconomic and trade datasets such as GDP and population forecasts, bilateral import–export flows, tariff structures, elasticity differentials between developed and developing economies, geographic distance, and import demand projections. Using weighted trade values from 2020–2024 as the base period to project country-to-country export potential for 2030, these inputs are operationalized through calculated drivers such as gravity model parameters, tariff impact factors, and projected GDP per-capita growth. Through an analysis of hidden potentials, demand hotspots, and market conditions that are most favorable to success, this method enables firms to focus on target countries, maximize returns, and global expansion with data, backed by accuracy.
By factoring in the projected importer demand gap that is currently unmet and could be potential opportunity, it identifies the potential for the Exporter (Country) among 190 countries, against the general trade analysis, which identifies the biggest importer or exporter.
To discover high-growth global markets and optimize your business strategy:
Click Here
Pricing
- Single User License$ 1,995
- Department License$ 2,400
- Site License$ 3,120
- Global License$ 3,795

Leadership Perspectives from Industry Events
Search
Thought Leadership and Analyst Meet


Our Clients
6WResearch In News
- India Air Conditioner Market Set for Strong Rebound in 2026 After Weather-Led Correction and GST-Driven Recovery: 6Wresearch
- ADAS in India: How Automatic Emergency Braking, Blind Spot Detection & Driver Monitoring are Transforming Road Safety
- Doha a strategic location for EV manufacturing hub: IPA Qatar
- Demand for luxury TVs surging in the GCC, says Samsung
- Empowering Growth: The Thriving Journey of Bangladesh’s Cable Industry
- Demand for luxury TVs surging in the GCC, says Samsung
Latest Reports
- Poland Fire Protection Systems Market (2026-2032)
- Cape Verde Portable Hand-Thrown Extinguisher Market (2026-2032)
- Canada Portable Hand-Thrown Extinguisher Market (2026-2032)
- Cameroon Portable Hand-Thrown Extinguisher Market (2026-2032)
- Burundi Portable Hand-Thrown Extinguisher Market (2026-2032)
- Burkina Faso Portable Hand-Thrown Extinguisher Market (2026-2032)
- Bulgaria Portable Hand-Thrown Extinguisher Market (2026-2032)
- Brunei Portable Hand-Thrown Extinguisher Market (2026-2032)
- Botswana Portable Hand-Thrown Extinguisher Market (2026-2032)
- Bosnia and Herzegovina Portable Hand-Thrown Extinguisher Market (2026-2032)
Industry Events and Analyst Meet

HIMTEX 2026

India Refining Summit 2026

India EV Show 2026

EV tech India Expo 2026

Auto Tech Asia 2026
Whitepaper
- Middle East & Africa Commercial Security Market Click here to view more.
- Middle East & Africa Fire Safety Systems & Equipment Market Click here to view more.
- GCC Drone Market Click here to view more.
- Middle East Lighting Fixture Market Click here to view more.
- GCC Physical & Perimeter Security Market Click here to view more.