Lithuania Chainsaw Market (2026-2032) | Companies, Trends, Value, Forecast, Share, Size, Growth, Outlook, Analysis, Industry, Revenue & Segmentation
Market Forecast By Product Type (Gas-Powered, Electric and Battery Powered, ), By Application (Residential Construction, Commercial and Industrial Construction) And Competitive Landscape
| Product Code: ETC5172296 | Publication Date: Nov 2023 | Updated Date: Apr 2026 | Product Type: Market Research Report | |
| Publisher: 6Wresearch | Author: Shubham Padhi | No. of Pages: 60 | No. of Figures: 30 | No. of Tables: 5 |
Lithuania Chainsaw Market Size (2020-2030)
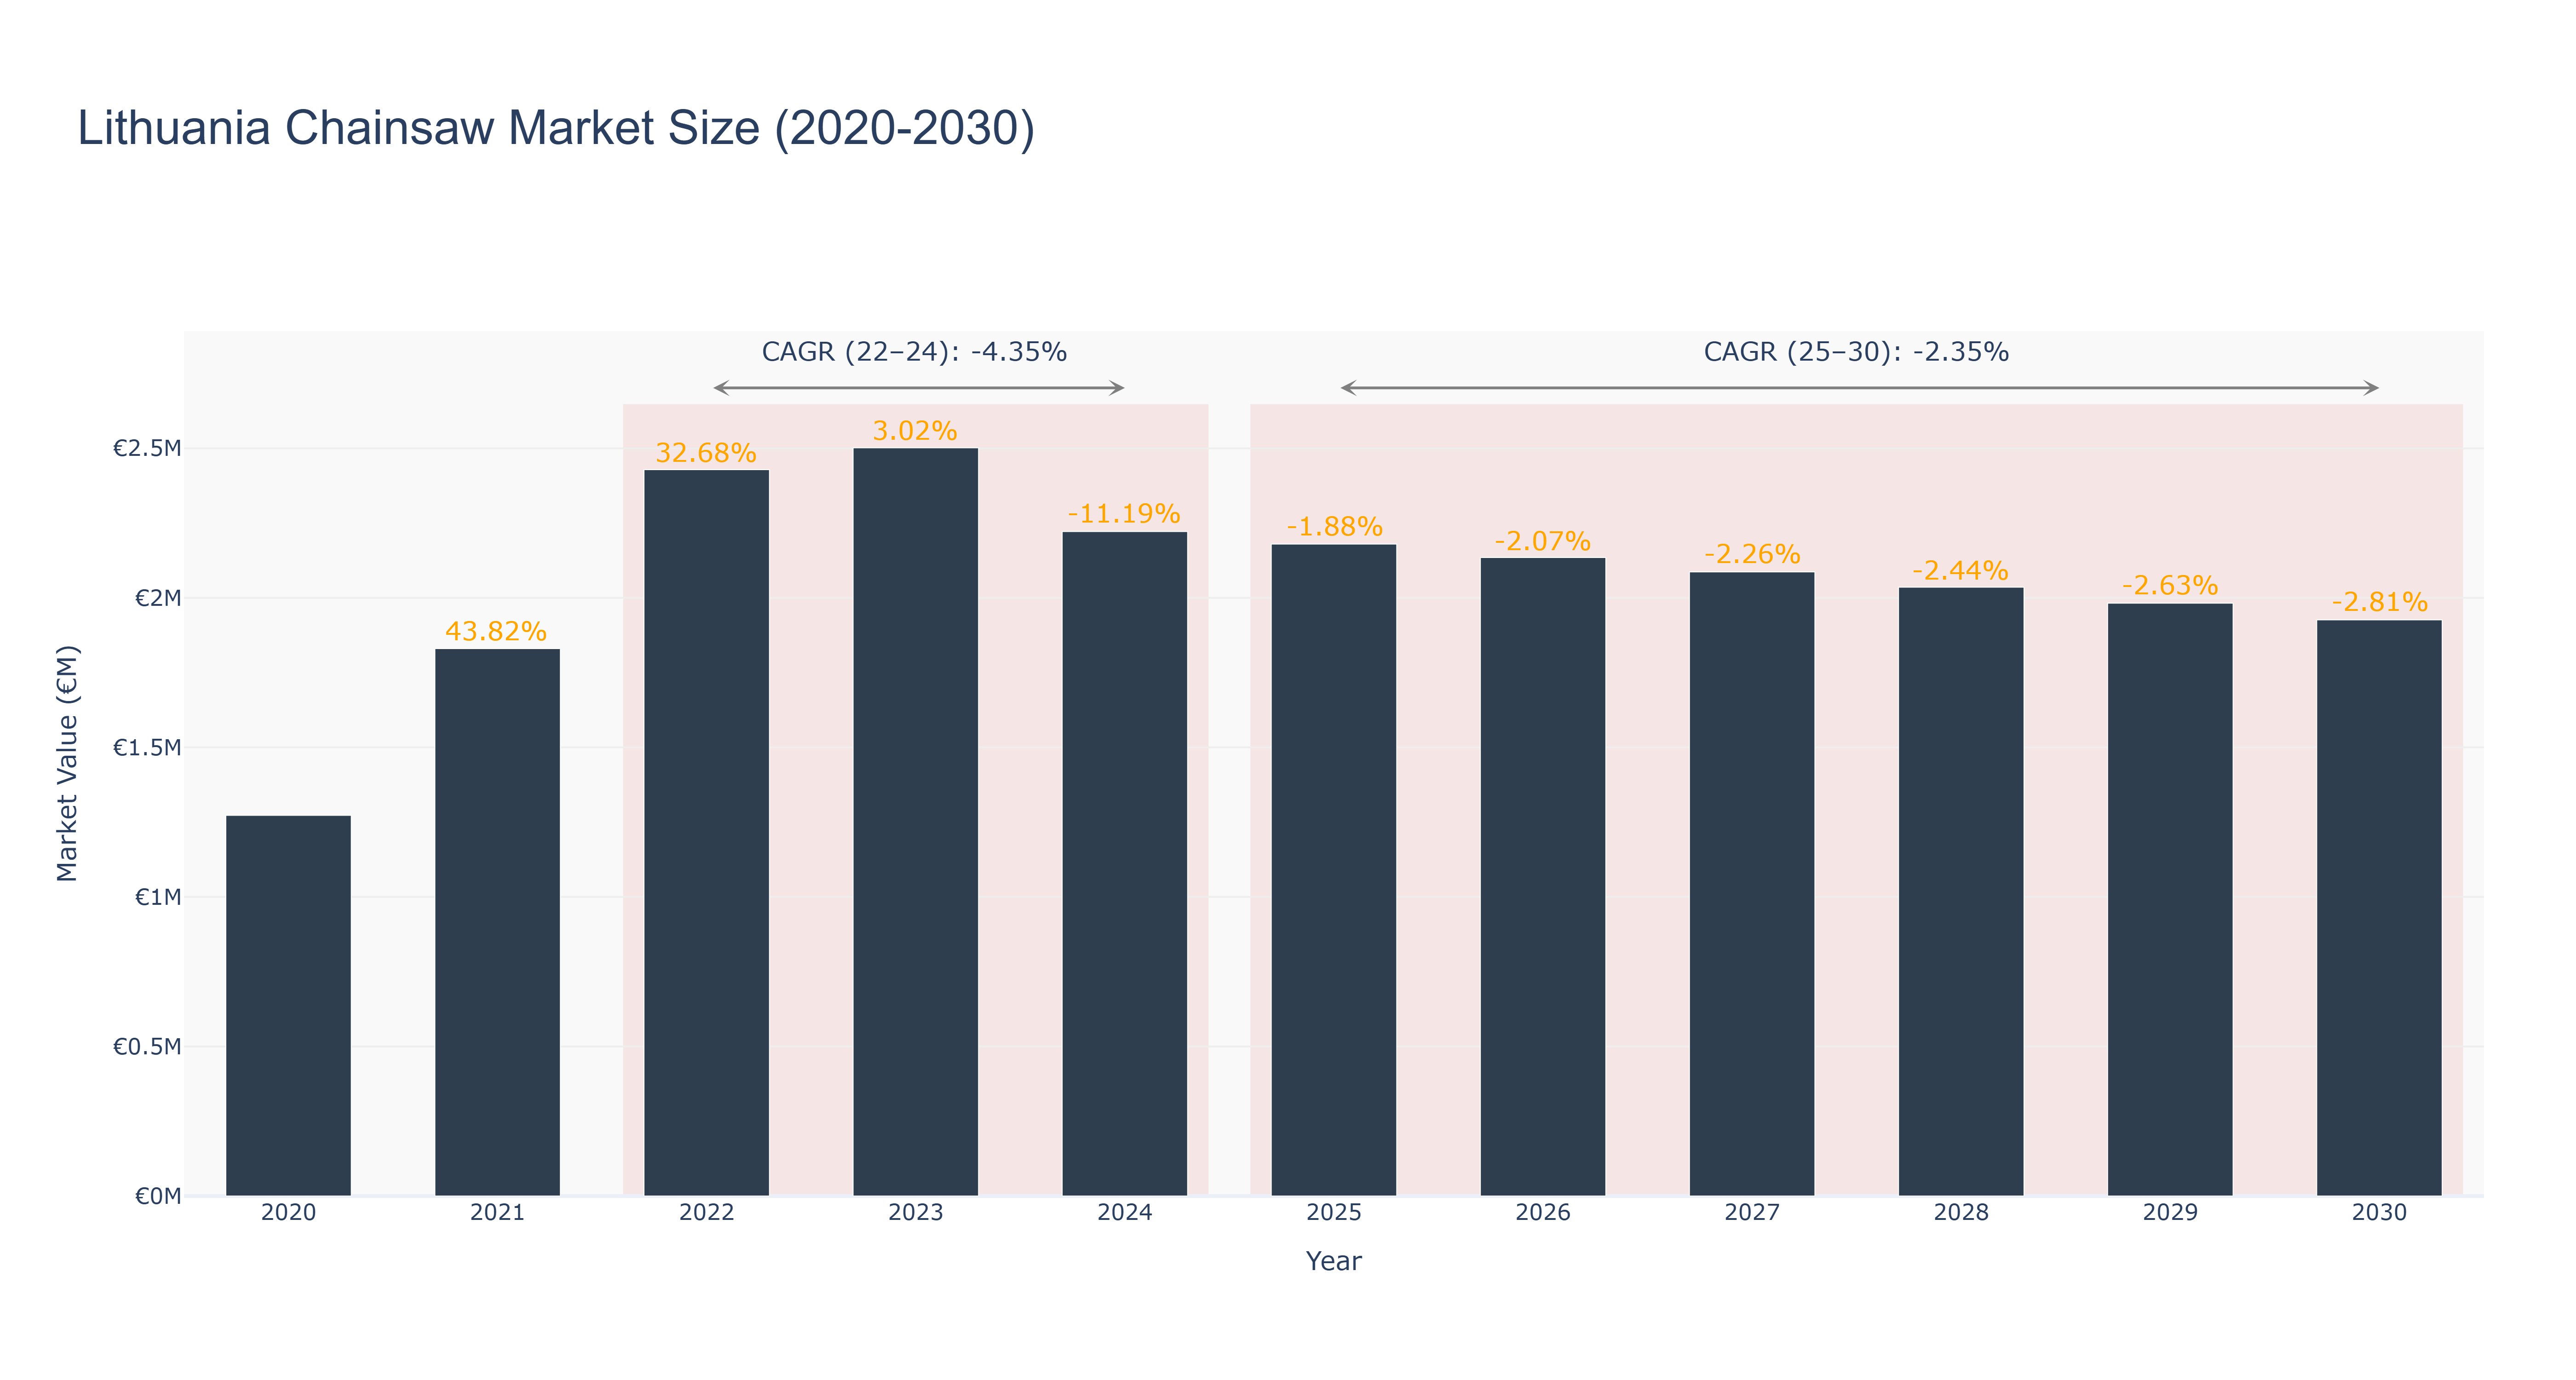
The Lithuania Chainsaw Market experienced significant growth from 2021 to 2022, peaking at a market size of €2.50 million in 2023, following a remarkable increase of 32.68% in 2022. However, the market faced a decline starting in 2024, with an actual market size of €2.22 million and a negative growth rate of -11.19%. This downward trend is projected to continue, with forecasted values decreasing from €2.18 million in 2025 to €1.93 million by 2030, reflecting a compound annual growth rate (CAGR) of -2.35% for the forecast period. Contributing factors to this decline may include market saturation, shifts toward alternative forestry practices, and environmental regulations limiting chainsaw usage. While there are no specific upcoming projects identified within the market, macroeconomic trends and technological advancements in sustainable forestry equipment will be crucial in shaping future dynamics.
Lithuania Chainsaw Market: Production & Trade Performance (2019-2025)
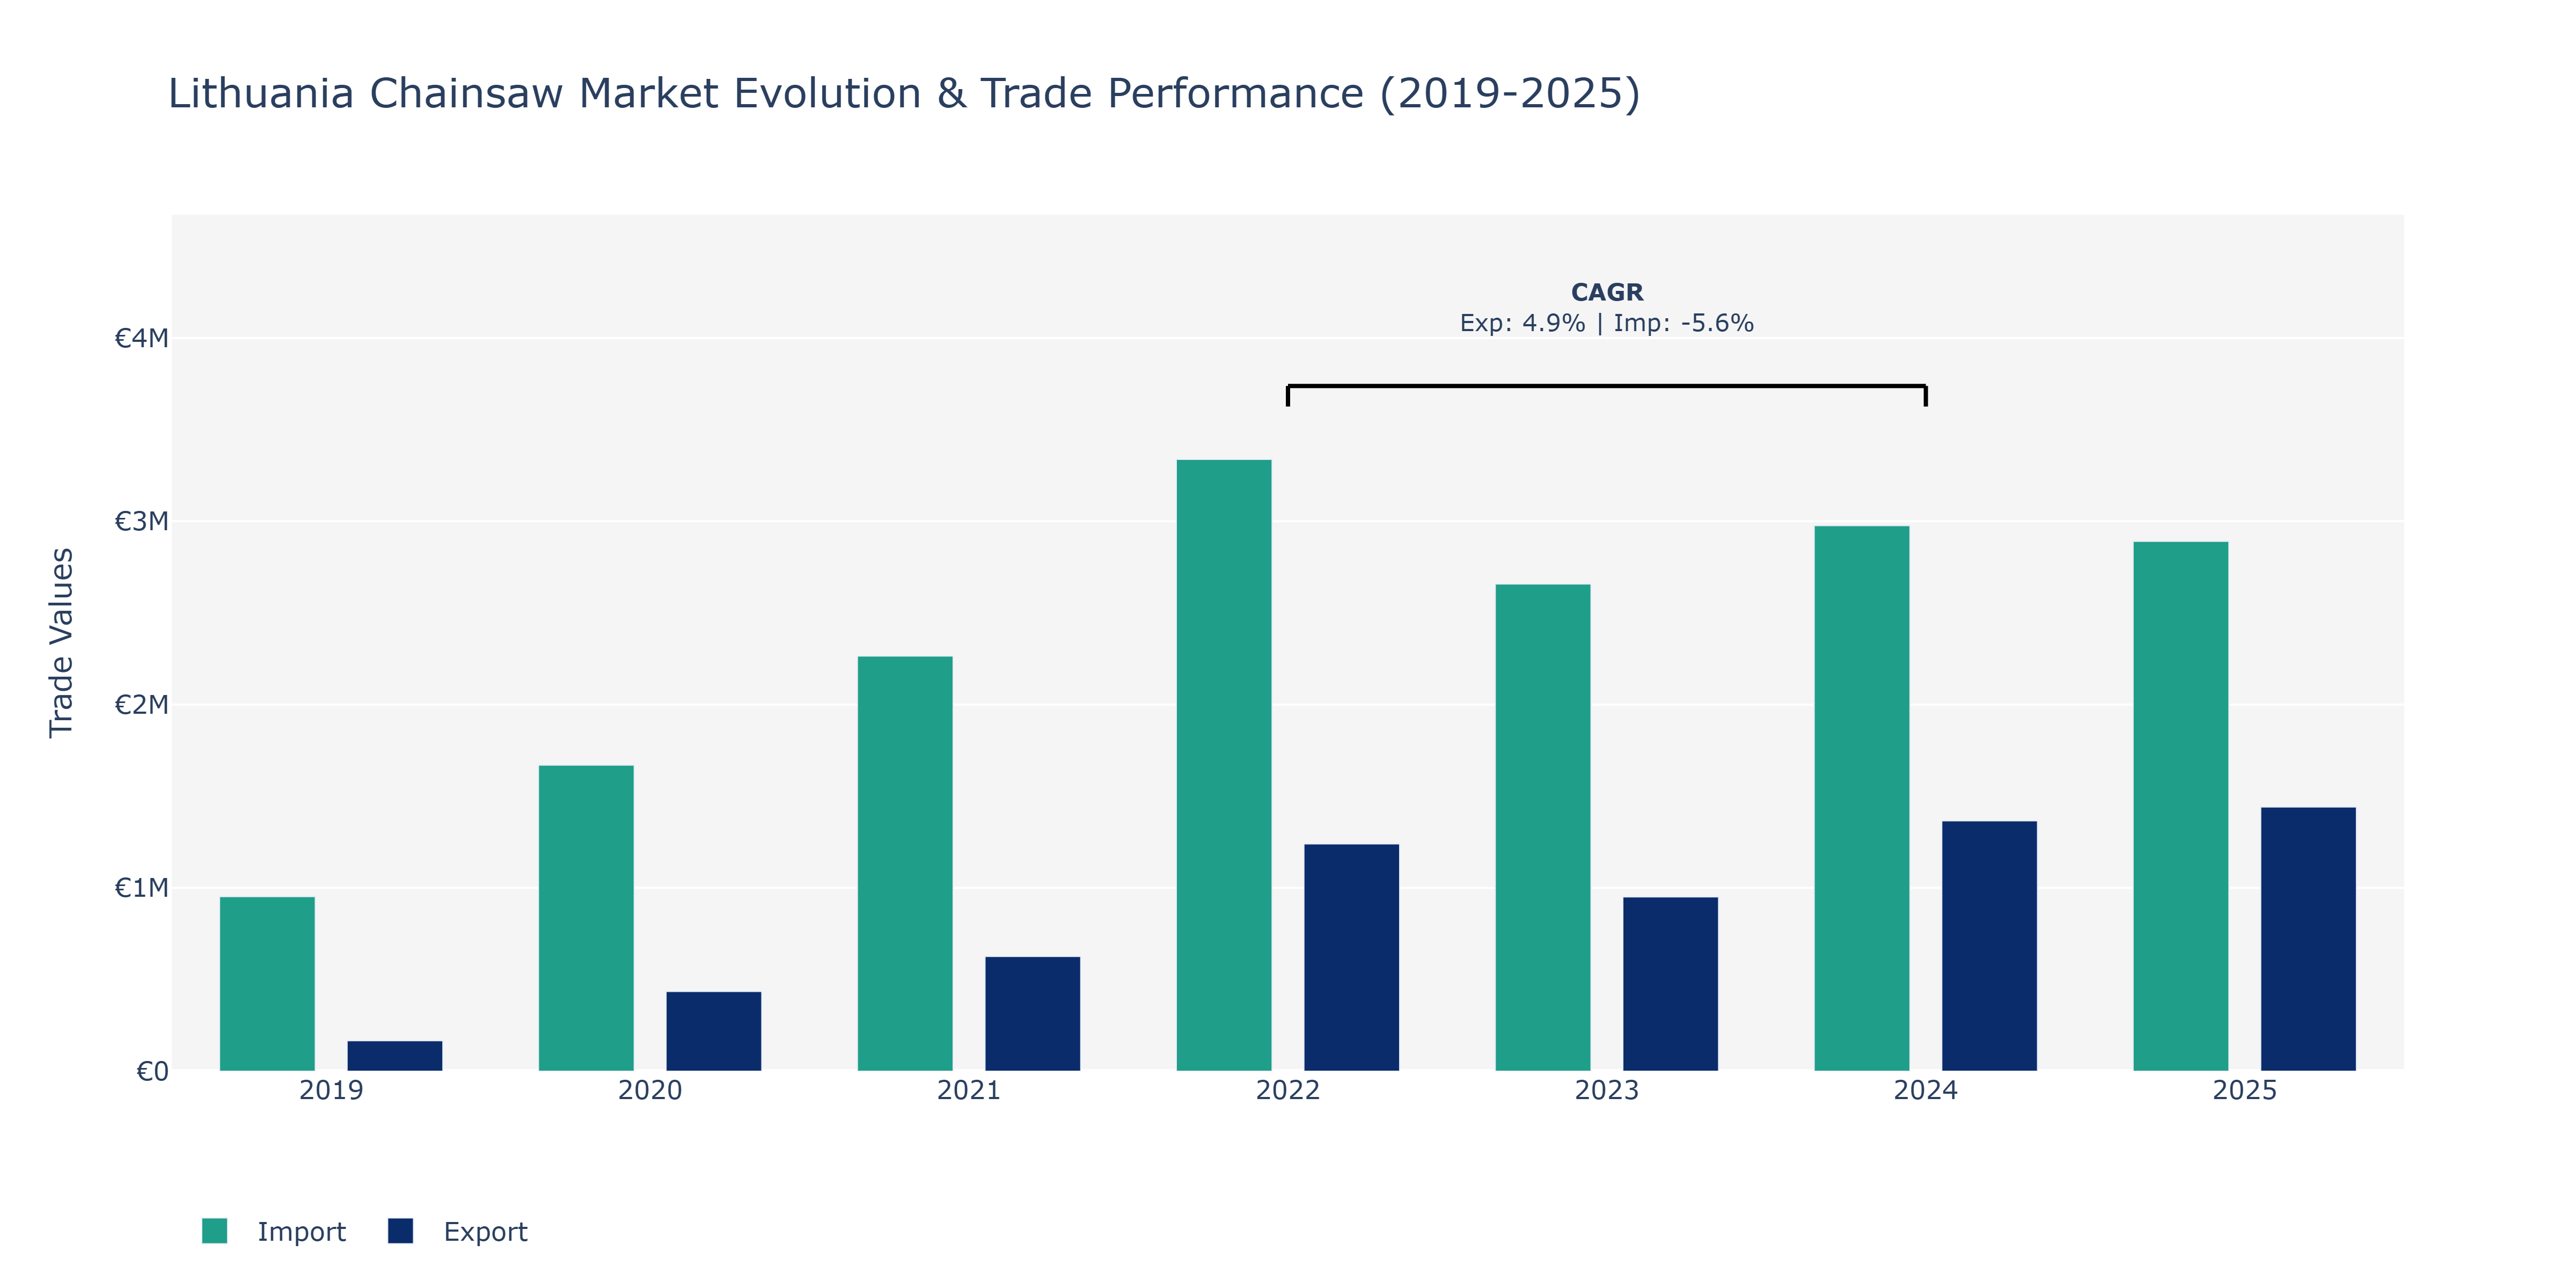
The Lithuania Chainsaw Market's exports demonstrated a consistent upward trajectory from 2019 to 2025, starting at €166.17 thousand and reaching €1.44 million in 2025. The peak point occurred in 2025, indicating a substantial growth in demand for Lithuanian chainsaws internationally. In contrast, imports also exhibited growth over the years, rising from €952.4 thousand in 2019 to €2.89 million in 2025. The peak for imports was observed in 2022. The notable decline in imports between 2022 and 2023 could be attributed to various factors such as changes in trade policies, economic conditions, or shifts in sourcing strategies by local businesses. Despite the decrease in imports during that period, the market rebounded in subsequent years, showcasing resilience and adaptability to external factors. The positive export trend aligns with the global rise in demand for forestry and logging equipment, reflecting a robust market positioning for Lithuanian chainsaw manufacturers in the international landscape.
Key Highlights of the Report:
- Lithuania Chainsaw Market Outlook
- Market Size of Lithuania Chainsaw Market, 2025
- Forecast of Lithuania Chainsaw Market, 2032
- Historical Data and Forecast of Lithuania Chainsaw Revenues & Volume for the Period 2022 - 2032F
- Lithuania Chainsaw Market Trend Evolution
- Lithuania Chainsaw Market Drivers and Challenges
- Lithuania Chainsaw Price Trends
- Lithuania Chainsaw Porter`s Five Forces
- Lithuania Chainsaw Industry Life Cycle
- Historical Data and Forecast of Lithuania Chainsaw Market Revenues & Volume By Product Type for the Period 2022 - 2032F
- Historical Data and Forecast of Lithuania Chainsaw Market Revenues & Volume By Gas-Powered for the Period 2022 - 2032F
- Historical Data and Forecast of Lithuania Chainsaw Market Revenues & Volume By Electric and Battery Powered for the Period 2022 - 2032F
- Historical Data and Forecast of Lithuania Chainsaw Market Revenues & Volume By for the Period 2022 - 2032F
- Historical Data and Forecast of Lithuania Chainsaw Market Revenues & Volume By Application for the Period 2022 - 2032F
- Historical Data and Forecast of Lithuania Chainsaw Market Revenues & Volume By Residential Construction for the Period 2022 - 2032F
- Historical Data and Forecast of Lithuania Chainsaw Market Revenues & Volume By Commercial and Industrial Construction for the Period 2022 - 2032F
- Lithuania Chainsaw Import Export Trade Statistics
- Market Opportunity Assessment By Product Type
- Market Opportunity Assessment By Application
- Lithuania Chainsaw Top Companies Market Share
- Lithuania Chainsaw Competitive Benchmarking By Technical and Operational Parameters
- Lithuania Chainsaw Company Profiles
- Lithuania Chainsaw Key Strategic Recommendations
Frequently Asked Questions About the Market Study (FAQs):
6Wresearch actively monitors the Lithuania Chainsaw Market and publishes its comprehensive annual report, highlighting emerging trends, growth drivers, revenue analysis, and forecast outlook. Our insights help businesses to make data-backed strategic decisions with ongoing market dynamics. Our analysts track relevent industries related to the Lithuania Chainsaw Market, allowing our clients with actionable intelligence and reliable forecasts tailored to emerging regional needs.
Yes, we provide customisation as per your requirements. To learn more, feel free to contact us on sales@6wresearch.com
1 Executive Summary |
2 Introduction |
2.1 Key Highlights of the Report |
2.2 Report Description |
2.3 Market Scope & Segmentation |
2.4 Research Methodology |
2.5 Assumptions |
3 Lithuania Chainsaw Market Overview |
3.1 Lithuania Country Macro Economic Indicators |
3.2 Lithuania Chainsaw Market Revenues & Volume, 2022 & 2032F |
3.3 Lithuania Chainsaw Market - Industry Life Cycle |
3.4 Lithuania Chainsaw Market - Porter's Five Forces |
3.5 Lithuania Chainsaw Market Revenues & Volume Share, By Product Type, 2022 & 2032F |
3.6 Lithuania Chainsaw Market Revenues & Volume Share, By Application, 2022 & 2032F |
4 Lithuania Chainsaw Market Dynamics |
4.1 Impact Analysis |
4.2 Market Drivers |
4.2.1 Increasing demand for efficient and time-saving tools in forestry and agriculture sectors. |
4.2.2 Growing popularity of DIY culture and home improvement projects. |
4.2.3 Technological advancements leading to more powerful and durable chainsaw models. |
4.3 Market Restraints |
4.3.1 Stringent regulations and policies related to environmental concerns and noise pollution. |
4.3.2 Economic fluctuations impacting consumer purchasing power. |
4.3.3 Competition from alternative tools and equipment in the market. |
5 Lithuania Chainsaw Market Trends |
6 Lithuania Chainsaw Market Segmentations |
6.1 Lithuania Chainsaw Market, By Product Type |
6.1.1 Overview and Analysis |
6.1.2 Lithuania Chainsaw Market Revenues & Volume, By Gas-Powered, 2022 - 2032F |
6.1.3 Lithuania Chainsaw Market Revenues & Volume, By Electric and Battery Powered, 2022 - 2032F |
6.1.4 Lithuania Chainsaw Market Revenues & Volume, By , 2022 - 2032F |
6.2 Lithuania Chainsaw Market, By Application |
6.2.1 Overview and Analysis |
6.2.2 Lithuania Chainsaw Market Revenues & Volume, By Residential Construction, 2022 - 2032F |
6.2.3 Lithuania Chainsaw Market Revenues & Volume, By Commercial and Industrial Construction, 2022 - 2032F |
7 Lithuania Chainsaw Market Import-Export Trade Statistics |
7.1 Lithuania Chainsaw Market Export to Major Countries |
7.2 Lithuania Chainsaw Market Imports from Major Countries |
8 Lithuania Chainsaw Market Key Performance Indicators |
8.1 Number of new product launches and innovations in the chainsaw market. |
8.2 Adoption rate of lithium-ion battery-powered chainsaws. |
8.3 Customer satisfaction levels with the performance and durability of chainsaw models. |
8.4 Percentage increase in online searches for chainsaw-related keywords. |
9 Lithuania Chainsaw Market - Opportunity Assessment |
9.1 Lithuania Chainsaw Market Opportunity Assessment, By Product Type, 2022 & 2032F |
9.2 Lithuania Chainsaw Market Opportunity Assessment, By Application, 2022 & 2032F |
10 Lithuania Chainsaw Market - Competitive Landscape |
10.1 Lithuania Chainsaw Market Revenue Share, By Companies, 2025 |
10.2 Lithuania Chainsaw Market Competitive Benchmarking, By Operating and Technical Parameters |
11 Company Profiles |
12 Recommendations | 13 Disclaimer |
Global Go To Market Strategy - 2030
Export potential enables firms to identify high-growth global markets with greater confidence by combining advanced trade intelligence with a structured quantitative methodology. The framework analyzes emerging demand trends and country-level import patterns while integrating macroeconomic and trade datasets such as GDP and population forecasts, bilateral import–export flows, tariff structures, elasticity differentials between developed and developing economies, geographic distance, and import demand projections. Using weighted trade values from 2020–2024 as the base period to project country-to-country export potential for 2030, these inputs are operationalized through calculated drivers such as gravity model parameters, tariff impact factors, and projected GDP per-capita growth. Through an analysis of hidden potentials, demand hotspots, and market conditions that are most favorable to success, this method enables firms to focus on target countries, maximize returns, and global expansion with data, backed by accuracy.
By factoring in the projected importer demand gap that is currently unmet and could be potential opportunity, it identifies the potential for the Exporter (Country) among 190 countries, against the general trade analysis, which identifies the biggest importer or exporter.
To discover high-growth global markets and optimize your business strategy:
Click Here
Pricing
- Single User License$ 1,995
- Department License$ 2,400
- Site License$ 3,120
- Global License$ 3,795

Leadership Perspectives from Industry Events
Search
Thought Leadership and Analyst Meet


Our Clients
6WResearch In News
- India Export Attractiveness Tracker 2026
- India Air Conditioner Market Set for Strong Rebound in 2026 After Weather-Led Correction and GST-Driven Recovery: 6Wresearch
- ADAS in India: How Automatic Emergency Braking, Blind Spot Detection & Driver Monitoring are Transforming Road Safety
- Doha a strategic location for EV manufacturing hub: IPA Qatar
- Demand for luxury TVs surging in the GCC, says Samsung
- Empowering Growth: The Thriving Journey of Bangladesh’s Cable Industry
Latest Reports
- Nicaragua RPG Gaming Market (2026-2032)
- New Zealand RPG Gaming Market (2026-2032)
- Netherlands RPG Gaming Market (2026-2032)
- Nauru RPG Gaming Market (2026-2032)
- Namibia RPG Gaming Market (2026-2032)
- Mozambique RPG Gaming Market (2026-2032)
- Montenegro RPG Gaming Market (2026-2032)
- Mongolia RPG Gaming Market (2026-2032)
- Monaco RPG Gaming Market (2026-2032)
- Micronesia RPG Gaming Market (2026-2032)
Industry Events and Analyst Meet

EV India Expo 2026

HIMTEX 2026

India Refining Summit 2026

India EV Show 2026

EV tech India Expo 2026
Whitepaper
- Middle East & Africa Commercial Security Market Click here to view more.
- Middle East & Africa Fire Safety Systems & Equipment Market Click here to view more.
- GCC Drone Market Click here to view more.
- Middle East Lighting Fixture Market Click here to view more.
- GCC Physical & Perimeter Security Market Click here to view more.