Lithuania Copper Wire Market (2026-2032) | Companies, Trends, Revenue, Share, Growth, Analysis, Segmentation, Outlook, Size, Forecast, Value & Industry
Market Forecast By Application (Building and Construction, Telecommunication and Power, Transport, Industrial Equipment, Electronics, Others) And Competitive Landscape
| Product Code: ETC4919862 | Publication Date: Nov 2023 | Updated Date: Apr 2026 | Product Type: Market Research Report | |
| Publisher: 6Wresearch | Author: Shubham Padhi | No. of Pages: 60 | No. of Figures: 30 | No. of Tables: 5 |
Lithuania Copper Wire Market Size (2020-2030)
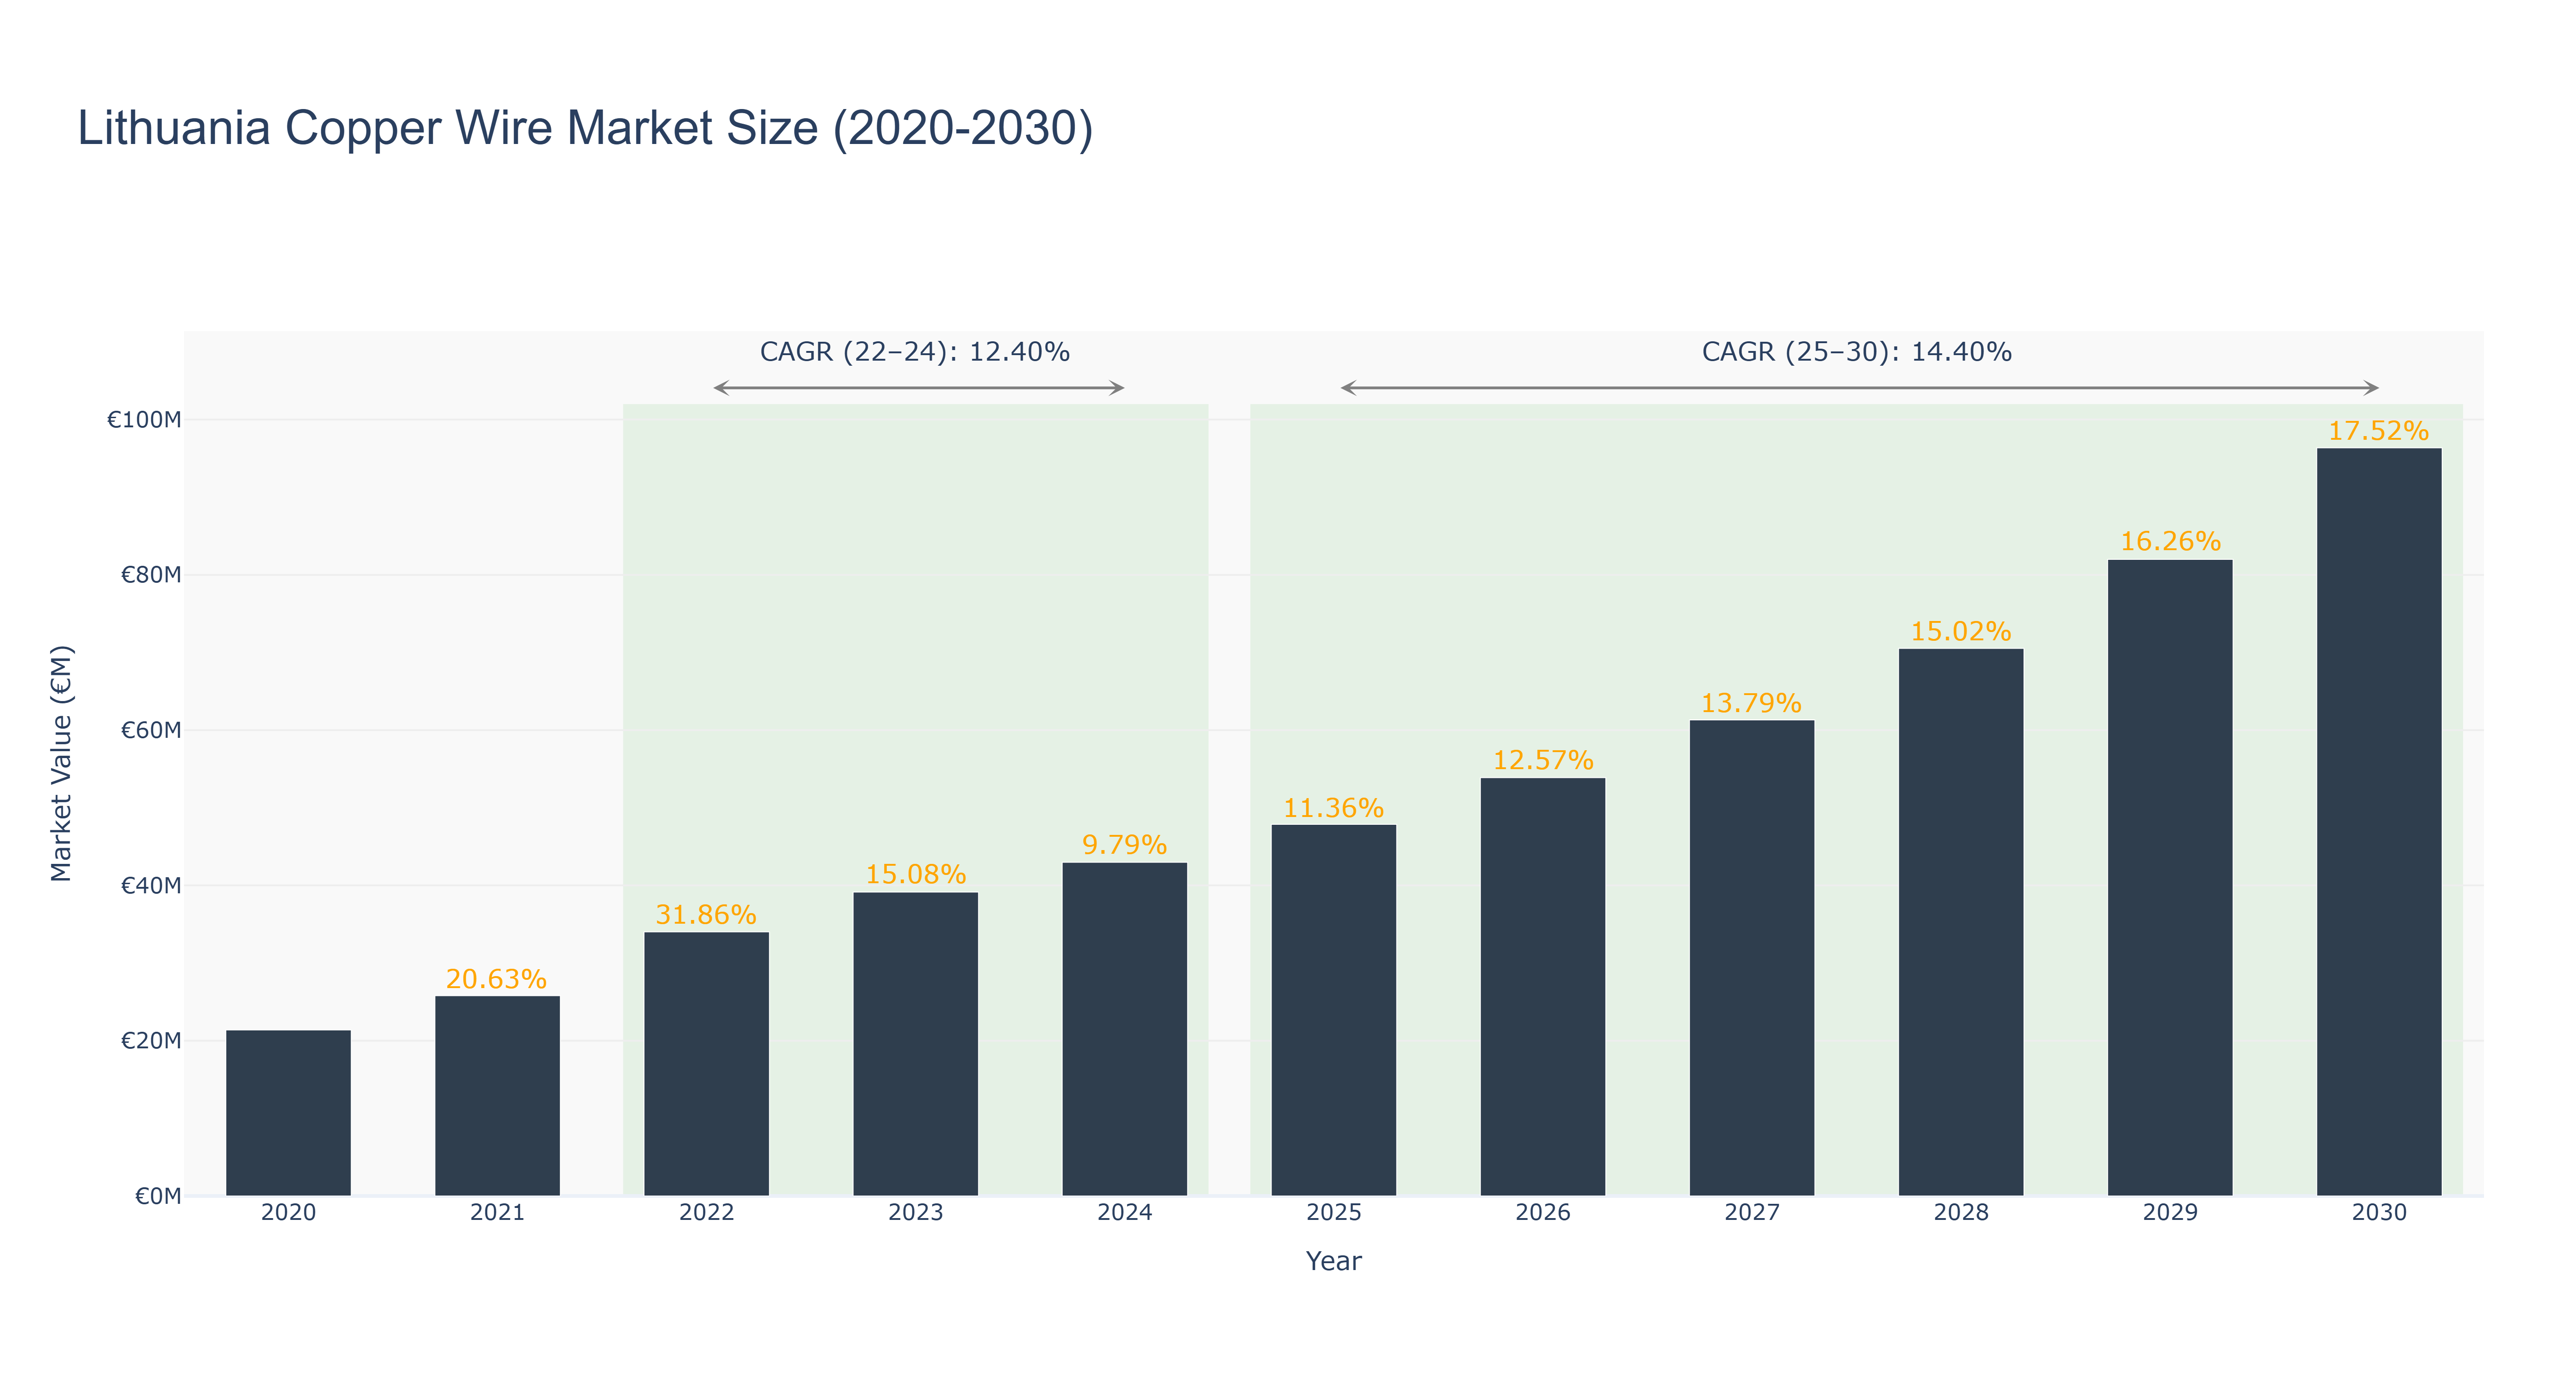
The Lithuania Copper Wire Market has shown a consistent upward trend over the years. The peak market size was €96.37 million in 2030, with a notable growth rate of 17.52%. From 2020 to 2024, the market size increased steadily, reaching €42.98 million in 2024. Forecasted market size from 2025 to 2030 is expected to continue this growth trajectory, with a CAGR of 14.40% post-2025. The market experienced a slight dip in growth from 2024 to 2025, which could be attributed to external factors impacting demand or supply chain disruptions. Looking ahead, the Lithuania Copper Wire Market is poised for further expansion driven by increasing demand for electric vehicles and renewable energy solutions. Recent discussions on infrastructure modernization projects in Lithuania indicate potential growth opportunities for copper wire applications in the near future.
Lithuania Copper Wire Market: Production & Trade Performance (2019-2025)
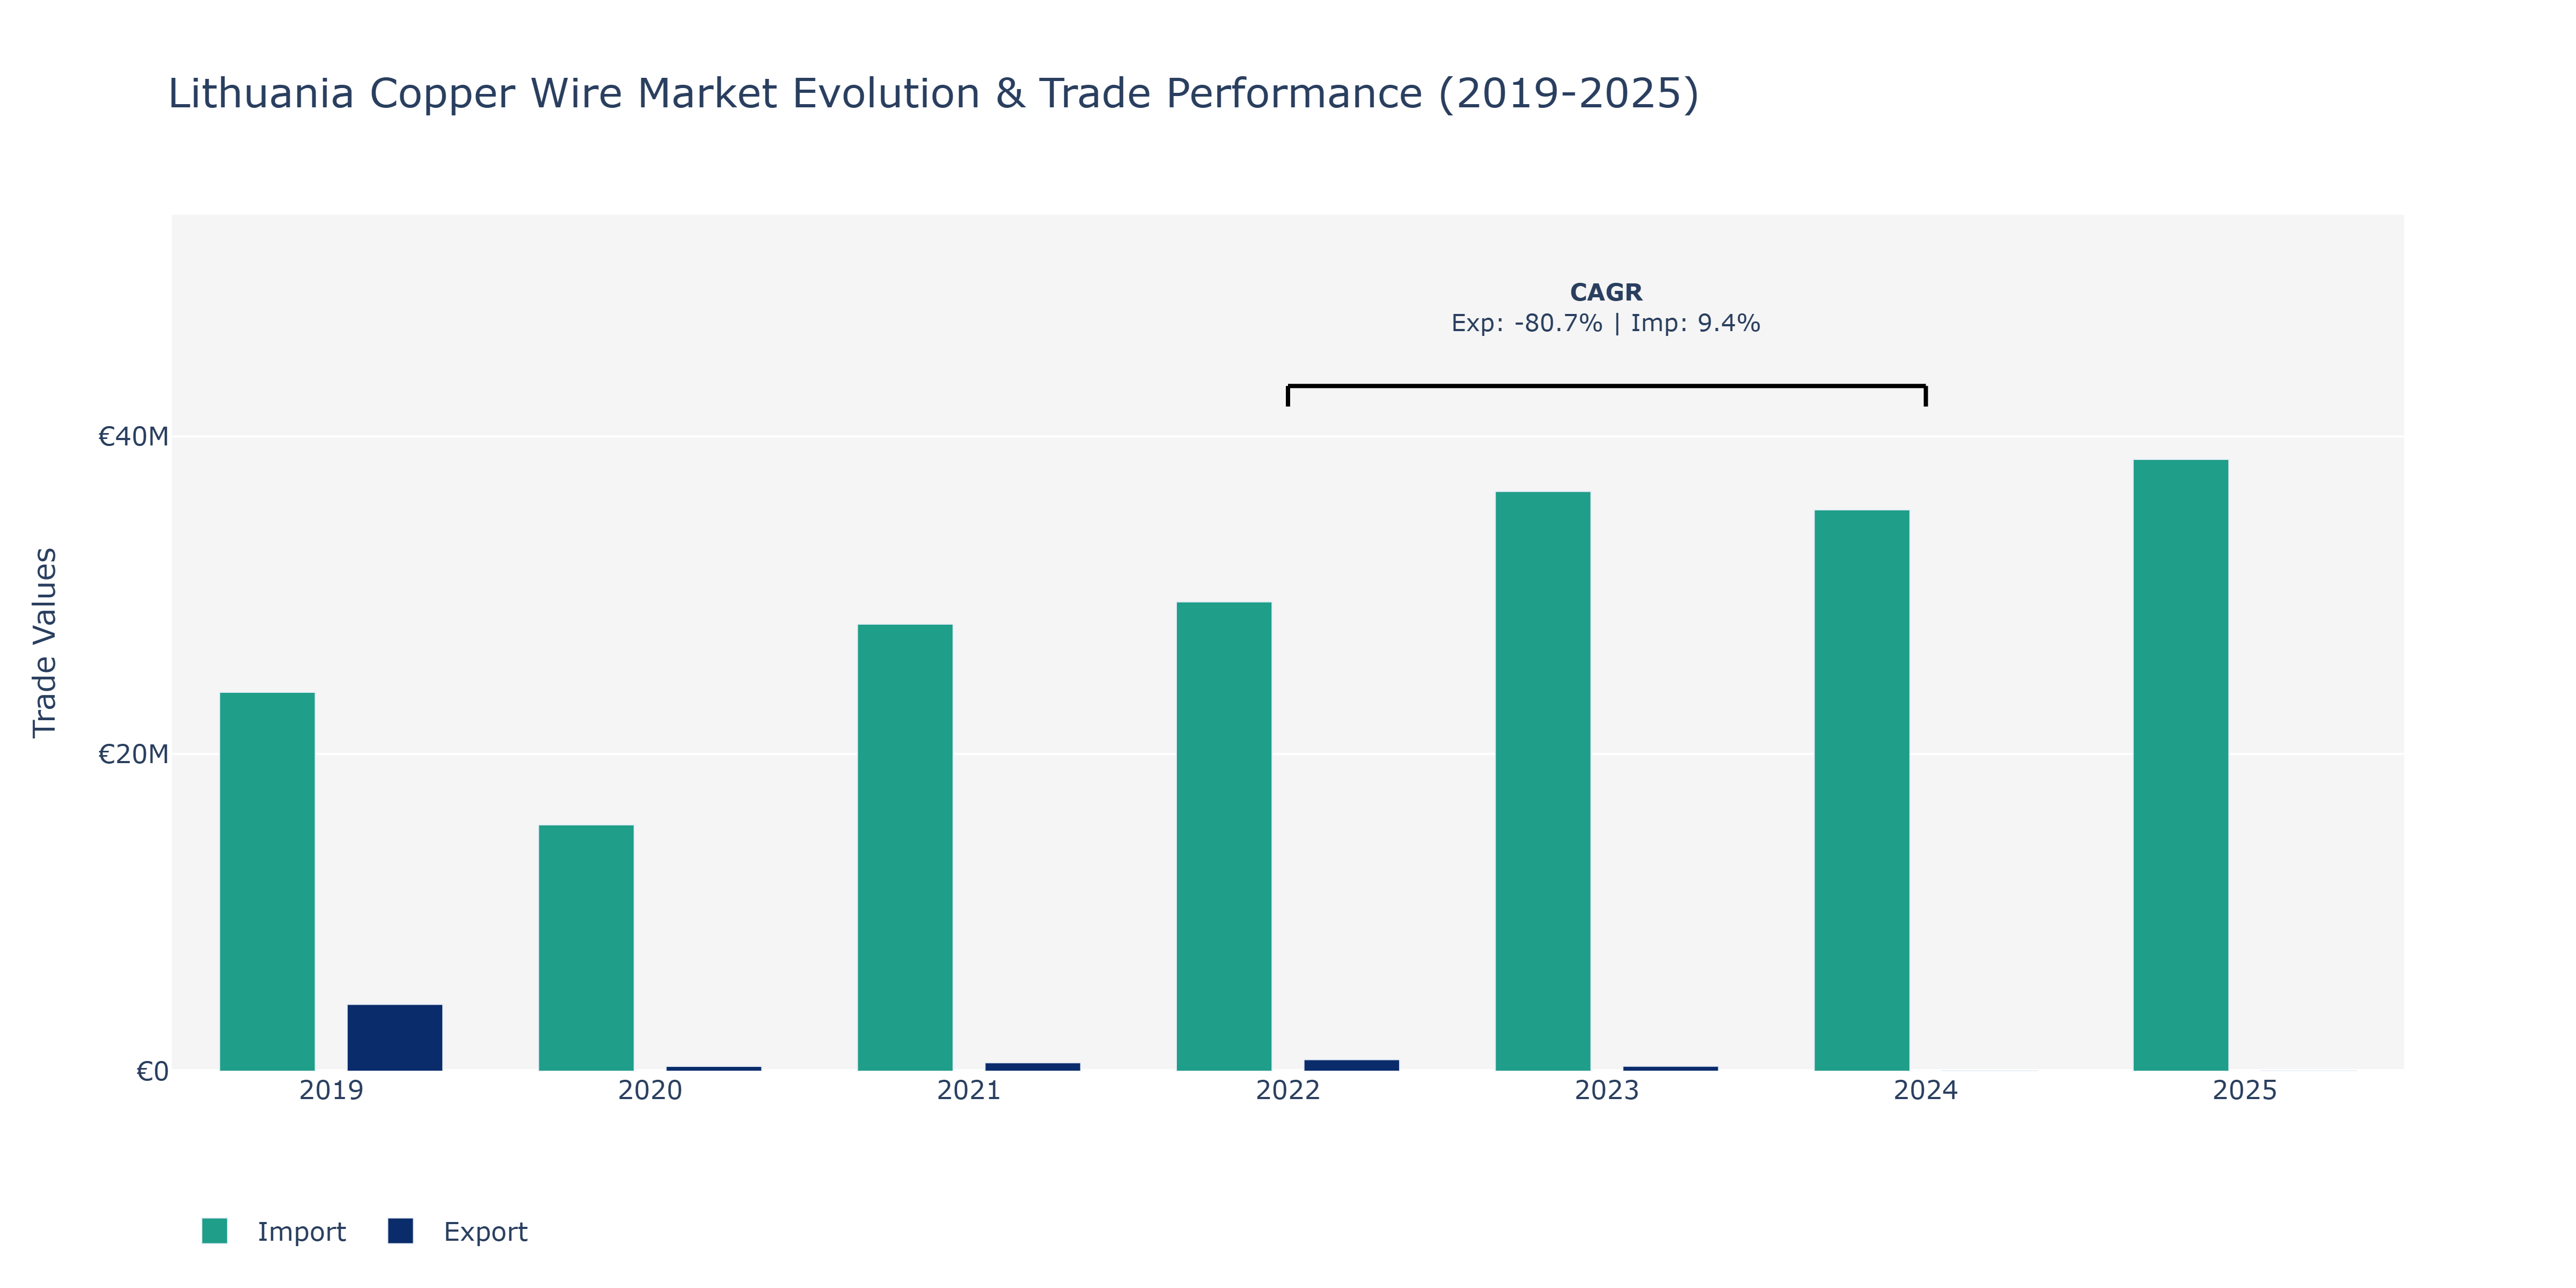
The Lithuania Copper Wire Market experienced diverse dynamics in Exports and Imports from 2019 to 2025. A substantial decline in Exports was observed from 2019 to 2020, dropping to €307.67 thousand, likely impacted by global economic uncertainties. However, a notable recovery ensued in the following years, with a peak in 2022 at €730.19 thousand, possibly driven by increased demand for copper wire products in key export markets. In contrast, Imports displayed a consistent upward trend throughout the period, reaching €38.56 million in 2025. This growth can be attributed to rising domestic demand for copper wire-related machinery and equipment, aligning with Lithuania's industrial expansion and infrastructure projects. The contrasting trends in Exports and Imports underscore the market's dependence on both domestic and international factors, necessitating strategic alignment with evolving global trade dynamics for sustainable market growth.
Key Highlights of the Report:
- Lithuania Copper Wire Market Outlook
- Market Size of Lithuania Copper Wire Market, 2025
- Forecast of Lithuania Copper Wire Market, 2032
- Historical Data and Forecast of Lithuania Copper Wire Revenues & Volume for the Period 2022 - 2032F
- Lithuania Copper Wire Market Trend Evolution
- Lithuania Copper Wire Market Drivers and Challenges
- Lithuania Copper Wire Price Trends
- Lithuania Copper Wire Porter`s Five Forces
- Lithuania Copper Wire Industry Life Cycle
- Historical Data and Forecast of Lithuania Copper Wire Market Revenues & Volume By Application for the Period 2022 - 2032F
- Historical Data and Forecast of Lithuania Copper Wire Market Revenues & Volume By Building and Construction for the Period 2022 - 2032F
- Historical Data and Forecast of Lithuania Copper Wire Market Revenues & Volume By Telecommunication and Power for the Period 2022 - 2032F
- Historical Data and Forecast of Lithuania Copper Wire Market Revenues & Volume By Transport for the Period 2022 - 2032F
- Historical Data and Forecast of Lithuania Copper Wire Market Revenues & Volume By Industrial Equipment for the Period 2022 - 2032F
- Historical Data and Forecast of Lithuania Copper Wire Market Revenues & Volume By Electronics for the Period 2022 - 2032F
- Historical Data and Forecast of Lithuania Copper Wire Market Revenues & Volume By Others for the Period 2022 - 2032F
- Lithuania Copper Wire Import Export Trade Statistics
- Market Opportunity Assessment By Application
- Lithuania Copper Wire Top Companies Market Share
- Lithuania Copper Wire Competitive Benchmarking By Technical and Operational Parameters
- Lithuania Copper Wire Company Profiles
- Lithuania Copper Wire Key Strategic Recommendations
Frequently Asked Questions About the Market Study (FAQs):
6Wresearch actively monitors the Lithuania Copper Wire Market and publishes its comprehensive annual report, highlighting emerging trends, growth drivers, revenue analysis, and forecast outlook. Our insights help businesses to make data-backed strategic decisions with ongoing market dynamics. Our analysts track relevent industries related to the Lithuania Copper Wire Market, allowing our clients with actionable intelligence and reliable forecasts tailored to emerging regional needs.
Yes, we provide customisation as per your requirements. To learn more, feel free to contact us on sales@6wresearch.com
1 Executive Summary |
2 Introduction |
2.1 Key Highlights of the Report |
2.2 Report Description |
2.3 Market Scope & Segmentation |
2.4 Research Methodology |
2.5 Assumptions |
3 Lithuania Copper Wire Market Overview |
3.1 Lithuania Country Macro Economic Indicators |
3.2 Lithuania Copper Wire Market Revenues & Volume, 2022 & 2032F |
3.3 Lithuania Copper Wire Market - Industry Life Cycle |
3.4 Lithuania Copper Wire Market - Porter's Five Forces |
3.5 Lithuania Copper Wire Market Revenues & Volume Share, By Application, 2022 & 2032F |
4 Lithuania Copper Wire Market Dynamics |
4.1 Impact Analysis |
4.2 Market Drivers |
4.2.1 Growing demand for electricity and telecommunications infrastructure in Lithuania |
4.2.2 Increasing adoption of renewable energy sources driving the need for copper wires |
4.2.3 Technological advancements leading to the development of high-performance copper wire products |
4.3 Market Restraints |
4.3.1 Fluctuating prices of raw materials impacting production costs |
4.3.2 Competition from alternative materials such as aluminum affecting market share |
4.3.3 Regulatory challenges related to environmental standards and waste management in the copper wire industry |
5 Lithuania Copper Wire Market Trends |
6 Lithuania Copper Wire Market Segmentations |
6.1 Lithuania Copper Wire Market, By Application |
6.1.1 Overview and Analysis |
6.1.2 Lithuania Copper Wire Market Revenues & Volume, By Building and Construction, 2022 - 2032F |
6.1.3 Lithuania Copper Wire Market Revenues & Volume, By Telecommunication and Power, 2022 - 2032F |
6.1.4 Lithuania Copper Wire Market Revenues & Volume, By Transport, 2022 - 2032F |
6.1.5 Lithuania Copper Wire Market Revenues & Volume, By Industrial Equipment, 2022 - 2032F |
6.1.6 Lithuania Copper Wire Market Revenues & Volume, By Electronics, 2022 - 2032F |
6.1.7 Lithuania Copper Wire Market Revenues & Volume, By Others, 2022 - 2032F |
7 Lithuania Copper Wire Market Import-Export Trade Statistics |
7.1 Lithuania Copper Wire Market Export to Major Countries |
7.2 Lithuania Copper Wire Market Imports from Major Countries |
8 Lithuania Copper Wire Market Key Performance Indicators |
8.1 Copper price index |
8.2 Percentage of renewable energy sources in Lithuania's energy mix |
8.3 Number of patents filed for copper wire technologies |
8.4 Percentage of infrastructure projects using copper wires |
8.5 Copper recycling rate in Lithuania |
9 Lithuania Copper Wire Market - Opportunity Assessment |
9.1 Lithuania Copper Wire Market Opportunity Assessment, By Application, 2022 & 2032F |
10 Lithuania Copper Wire Market - Competitive Landscape |
10.1 Lithuania Copper Wire Market Revenue Share, By Companies, 2025 |
10.2 Lithuania Copper Wire Market Competitive Benchmarking, By Operating and Technical Parameters |
11 Company Profiles |
12 Recommendations | 13 Disclaimer |
Export potential assessment - trade Analytics for 2030
Export potential enables firms to identify high-growth global markets with greater confidence by combining advanced trade intelligence with a structured quantitative methodology. The framework analyzes emerging demand trends and country-level import patterns while integrating macroeconomic and trade datasets such as GDP and population forecasts, bilateral import–export flows, tariff structures, elasticity differentials between developed and developing economies, geographic distance, and import demand projections. Using weighted trade values from 2020–2024 as the base period to project country-to-country export potential for 2030, these inputs are operationalized through calculated drivers such as gravity model parameters, tariff impact factors, and projected GDP per-capita growth. Through an analysis of hidden potentials, demand hotspots, and market conditions that are most favorable to success, this method enables firms to focus on target countries, maximize returns, and global expansion with data, backed by accuracy.
By factoring in the projected importer demand gap that is currently unmet and could be potential opportunity, it identifies the potential for the Exporter (Country) among 190 countries, against the general trade analysis, which identifies the biggest importer or exporter.
To discover high-growth global markets and optimize your business strategy:
Click Here
Pricing
- Single User License$ 1,995
- Department License$ 2,400
- Site License$ 3,120
- Global License$ 3,795

Search
Thought Leadership and Analyst Meet


Our Clients
Latest Reports
- Canada Cloud CFD Market (2026-2032) | Size & Revenue, Industry, Growth, Competitive Landscape, Forecast, Segmentation, Value, Outlook, Trends, Share, Analysis, Companies
- Taiwan Food Delivery Platform Market (2026-2032) | Companies, Outlook, Analysis, Trends, Value, Revenue, Segmentation, Share, Forecast, Competitive Landscape, Growth, Size & Forecast
- United Kingdom (UK) Long-term Care Insurance Market (2026-2032) | Growth, Share, Consumer Insights, Drivers, Opportunities, Competition, Pricing Analysis, Segments, Restraints, Companies, Competitive, Value, Outlook, Size, Demand, Analysis, Challenges, Strategic Insights, Investment Trends, Revenue, Trends, Supply, Forecast
- United Kingdom (UK) Long Term Care Market (2026-2032) | Companies, Outlook, Analysis, Trends, Value, Revenue, Segmentation, Share, Forecast, Competitive Landscape, Growth, Size & Forecast
- Iraq Insulation and Waterproofing Market (2026-2032) | Outlook, Drivers, Growth, Size, Share, Industry, Revenue, Trends, Demand, Competitive, Strategic Insights, Opportunities, Segments, Companies, Challenges, Strategy, Consumer Insights, Analysis, Investment Trends, Value, Segmentation, Forecast, Restraints
- India Switchgear Market Outlook (2026-2032) | Size, Share, Trends, Growth, Revenue, Forecast, Analysis, Value, Outlook
- Pakistan Contraceptive Implants Market (2025-2031) | Demand, Growth, Size, Share, Industry, Pricing Analysis, Competitive, Strategic Insights, Strategy, Consumer Insights, Analysis, Investment Trends, Opportunities, Revenue, Segments, Value, Segmentation, Supply, Forecast, Restraints, Outlook, Competition, Drivers, Trends, Companies, Challenges
- Sri Lanka Packaging Market (2026-2032) | Outlook, Competition, Drivers, Trends, Demand, Pricing Analysis, Competitive, Strategic Insights, Companies, Challenges, Strategy, Consumer Insights, Analysis, Investment Trends, Opportunities, Growth, Size, Share, Industry, Revenue, Segments, Value, Segmentation, Supply, Forecast, Restraints
- India Kids Watches Market (2026-2032) | Strategy, Consumer Insights, Analysis, Investment Trends, Opportunities, Growth, Size, Share, Industry, Revenue, Segments, Value, Segmentation, Supply, Forecast, Restraints, Outlook, Competition, Drivers, Trends, Demand, Pricing Analysis, Competitive, Strategic Insights, Companies, Challenges
- Saudi Arabia Core Assurance Service Market (2025-2031) | Strategy, Consumer Insights, Analysis, Investment Trends, Opportunities, Growth, Size, Share, Industry, Revenue, Segments, Value, Segmentation, Supply, Forecast, Restraints, Outlook, Competition, Drivers, Trends, Demand, Pricing Analysis, Competitive, Strategic Insights, Companies, Challenges
Industry Events and Analyst Meet

India EV Show 2026

EV tech India Expo 2026

Auto Tech Asia 2026

Battery Tech India 2026

Smart Production Solutions Guangzhou 2026
Whitepaper
- Middle East & Africa Commercial Security Market Click here to view more.
- Middle East & Africa Fire Safety Systems & Equipment Market Click here to view more.
- GCC Drone Market Click here to view more.
- Middle East Lighting Fixture Market Click here to view more.
- GCC Physical & Perimeter Security Market Click here to view more.
6WResearch In News
- Doha a strategic location for EV manufacturing hub: IPA Qatar
- Demand for luxury TVs surging in the GCC, says Samsung
- Empowering Growth: The Thriving Journey of Bangladesh’s Cable Industry
- Demand for luxury TVs surging in the GCC, says Samsung
- Video call with a traditional healer? Once unthinkable, it’s now common in South Africa
- Intelligent Buildings To Smooth GCC’s Path To Net Zero