Lithuania Corn Starch Market (2026-2032) | Value, Size, Companies, Segmentation, Outlook, Industry, Trends, Analysis, Revenue, Growth, Forecast & Share
Market Forecast By Type (Native Starch, Modified Starch, Sweeteners), By Application (Food and Beverages, Animal Feed, Pharmaceuticals and Chemicals, Textiles, Paper and Corrugates, Others) And Competitive Landscape
| Product Code: ETC4731534 | Publication Date: Nov 2023 | Updated Date: Apr 2026 | Product Type: Market Research Report | |
| Publisher: 6Wresearch | Author: Shubham Padhi | No. of Pages: 60 | No. of Figures: 30 | No. of Tables: 5 |
Lithuania Corn Starch Market Size (2020-2030)
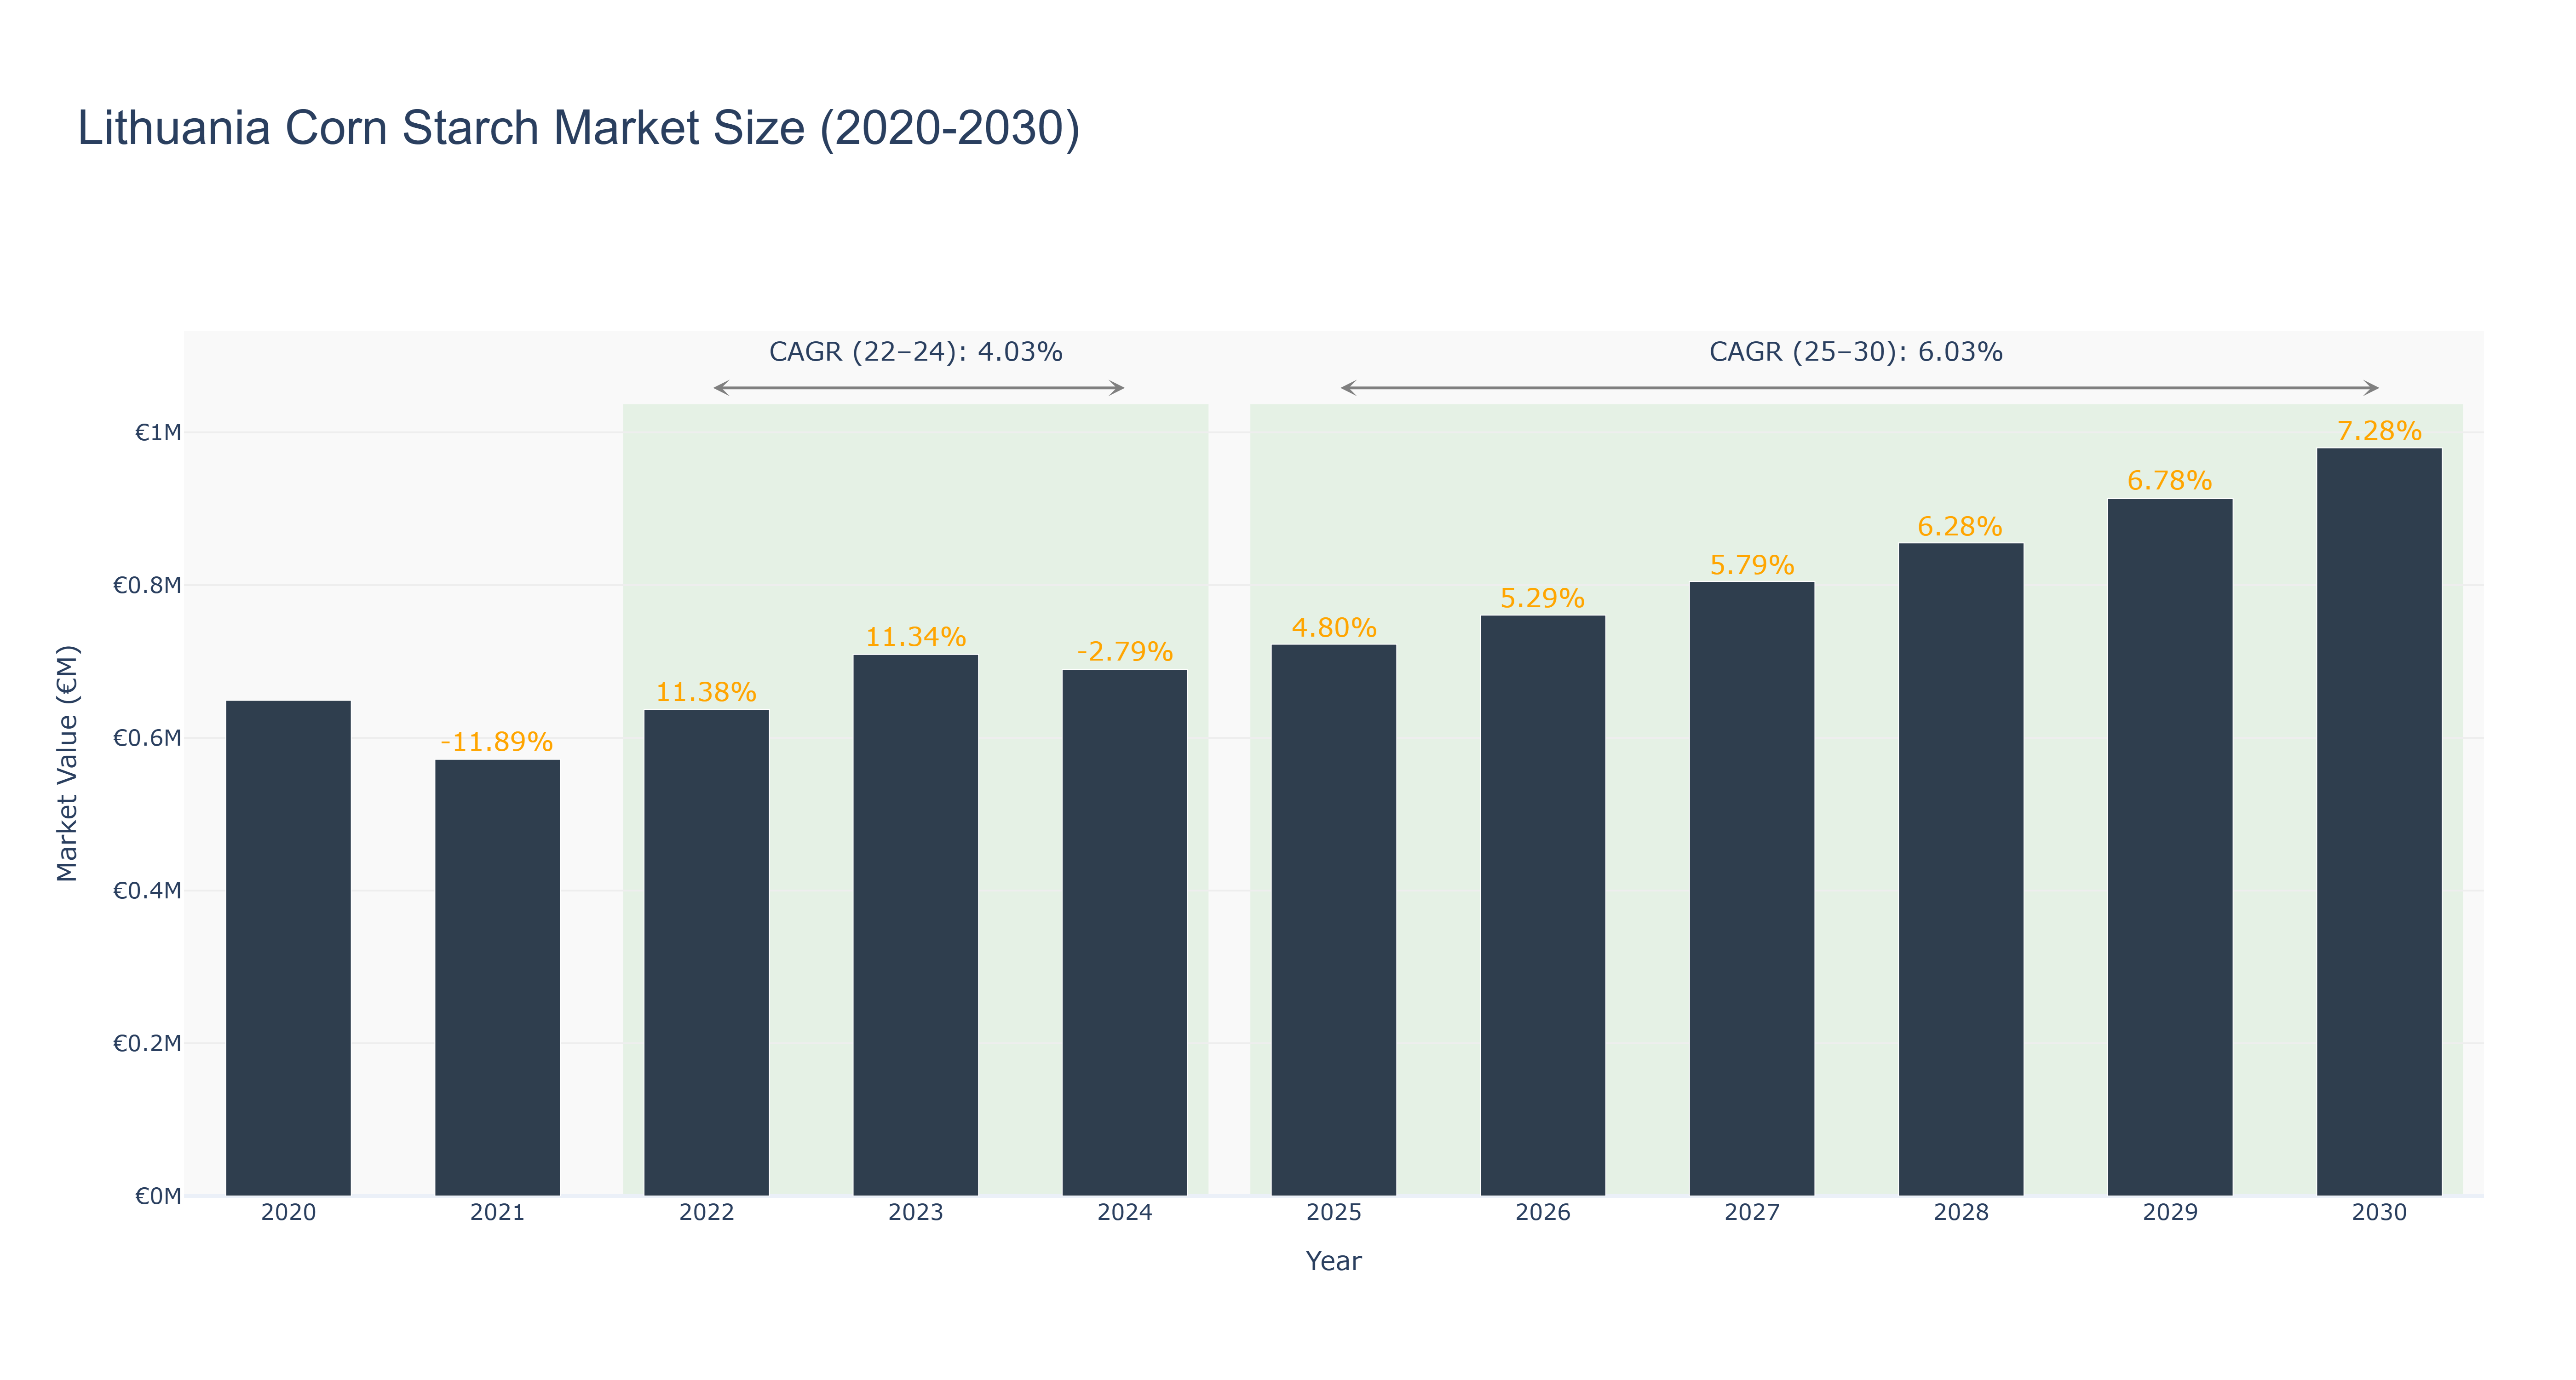
The Lithuania Corn Starch Market experienced a peak market size of €0.98 million in 2030, with steady growth over the years. From 2020 to 2024, the market size fluctuated, starting at €0.65 million in 2020, dropping to €0.57 million in 2021, before recovering to €0.69 million in 2024. The forecasted market size from 2025 to 2030 shows a consistent upward trend, reaching €0.98 million in 2030. The CAGR for the periods 2022-24 and 2025-30 are 4.03% and 6.03% respectively. The market's growth can be attributed to increasing demand for corn starch in various industries, including food and pharmaceuticals. Looking ahead, Lithuania is set to introduce new sustainability initiatives in the corn starch industry, focusing on eco-friendly production methods and packaging solutions to meet growing consumer preferences for environmentally conscious products.
Lithuania Corn Starch Market: Production & Trade Performance (2019-2025)
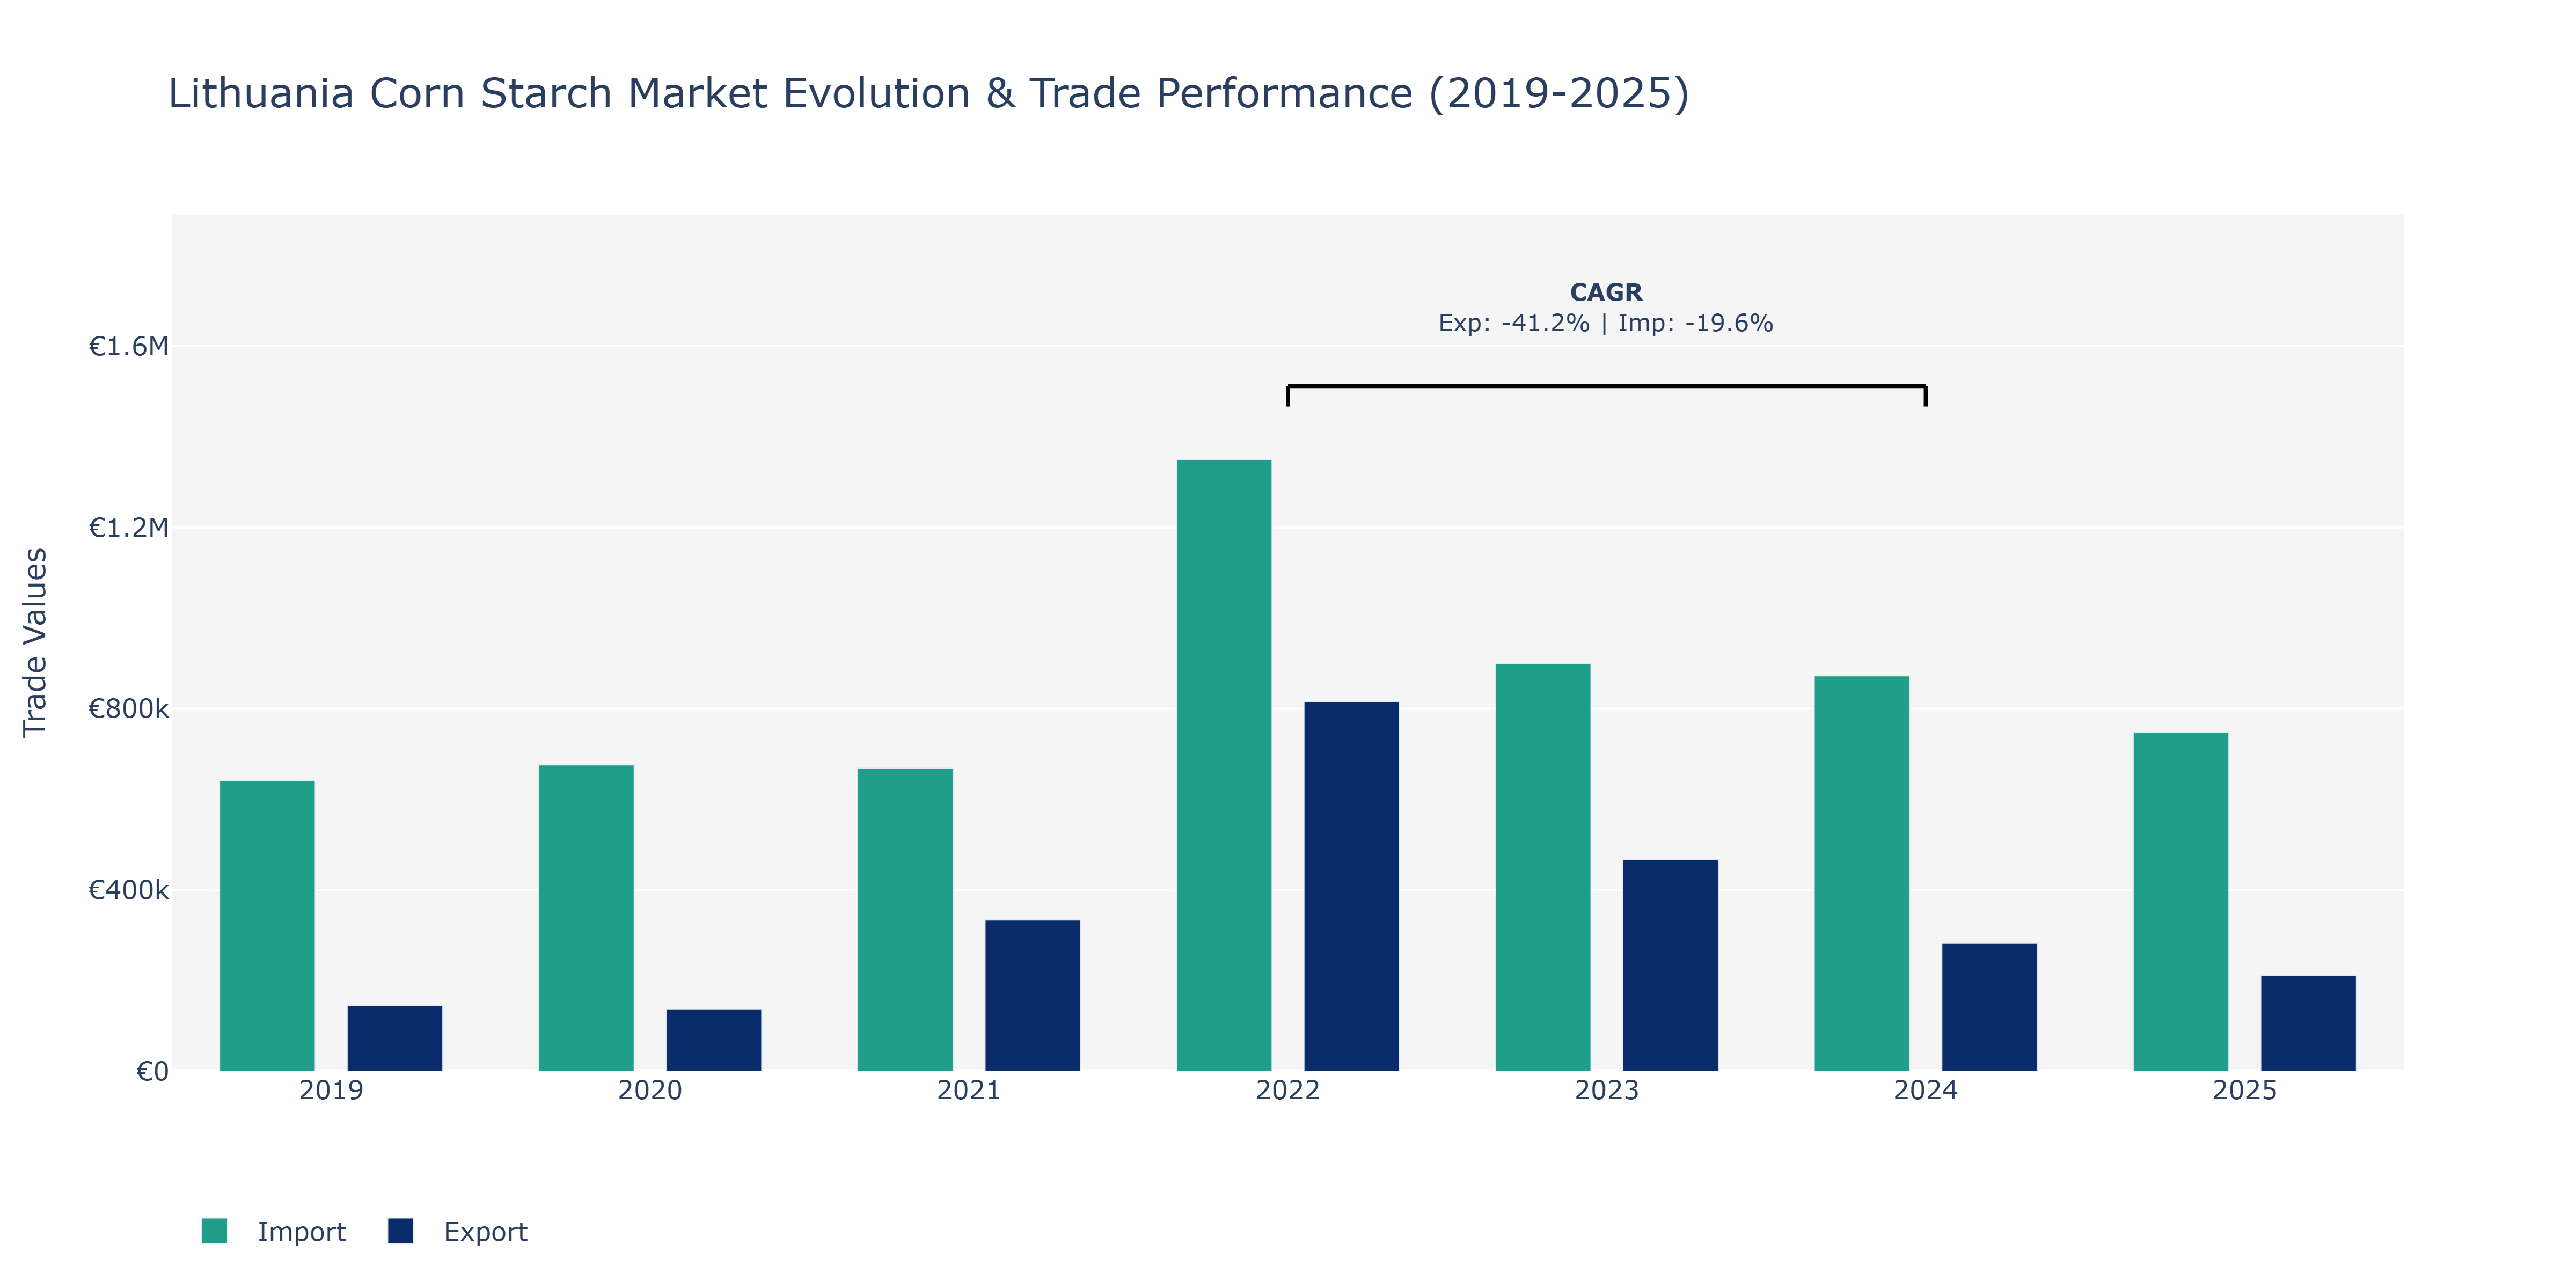
The Lithuania Corn Starch Market witnessed fluctuations in both Exports and Imports over the years. In 2019, Imports peaked at €640.9 thousand, surpassing Exports of €145.66 thousand. However, in 2020, Imports continued to rise to €675.91 thousand while Exports declined to €136.53 thousand. The year 2021 saw a notable surge in Exports to €333.76 thousand, almost matching Imports at €669.09 thousand. By 2022, Exports experienced a substantial increase to €815.53 thousand, outpacing Imports at €1.35 million, marking a significant shift in trade balance. The following years displayed a downward trend for both metrics, with 2024 showing Exports at €282.09 thousand and Imports at €872.7 thousand. This trend could be attributed to various factors, including changing global demand patterns, competitive pricing strategies, and evolving trade policies impacting the corn starch market in Lithuania.
Key Highlights of the Report:
- Lithuania Corn Starch Market Outlook
- Market Size of Lithuania Corn Starch Market, 2025
- Forecast of Lithuania Corn Starch Market, 2032
- Historical Data and Forecast of Lithuania Corn Starch Revenues & Volume for the Period 2022 - 2032F
- Lithuania Corn Starch Market Trend Evolution
- Lithuania Corn Starch Market Drivers and Challenges
- Lithuania Corn Starch Price Trends
- Lithuania Corn Starch Porter`s Five Forces
- Lithuania Corn Starch Industry Life Cycle
- Historical Data and Forecast of Lithuania Corn Starch Market Revenues & Volume By Type for the Period 2022 - 2032F
- Historical Data and Forecast of Lithuania Corn Starch Market Revenues & Volume By Native Starch for the Period 2022 - 2032F
- Historical Data and Forecast of Lithuania Corn Starch Market Revenues & Volume By Modified Starch for the Period 2022 - 2032F
- Historical Data and Forecast of Lithuania Corn Starch Market Revenues & Volume By Sweeteners for the Period 2022 - 2032F
- Historical Data and Forecast of Lithuania Corn Starch Market Revenues & Volume By Application for the Period 2022 - 2032F
- Historical Data and Forecast of Lithuania Corn Starch Market Revenues & Volume By Food and Beverages for the Period 2022 - 2032F
- Historical Data and Forecast of Lithuania Corn Starch Market Revenues & Volume By Animal Feed for the Period 2022 - 2032F
- Historical Data and Forecast of Lithuania Corn Starch Market Revenues & Volume By Pharmaceuticals and Chemicals for the Period 2022 - 2032F
- Historical Data and Forecast of Lithuania Corn Starch Market Revenues & Volume By Textiles for the Period 2022 - 2032F
- Historical Data and Forecast of Lithuania Corn Starch Market Revenues & Volume By Paper and Corrugates for the Period 2022 - 2032F
- Historical Data and Forecast of Lithuania Corn Starch Market Revenues & Volume By Others for the Period 2022 - 2032F
- Lithuania Corn Starch Import Export Trade Statistics
- Market Opportunity Assessment By Type
- Market Opportunity Assessment By Application
- Lithuania Corn Starch Top Companies Market Share
- Lithuania Corn Starch Competitive Benchmarking By Technical and Operational Parameters
- Lithuania Corn Starch Company Profiles
- Lithuania Corn Starch Key Strategic Recommendations
Frequently Asked Questions About the Market Study (FAQs):
6Wresearch actively monitors the Lithuania Corn Starch Market and publishes its comprehensive annual report, highlighting emerging trends, growth drivers, revenue analysis, and forecast outlook. Our insights help businesses to make data-backed strategic decisions with ongoing market dynamics. Our analysts track relevent industries related to the Lithuania Corn Starch Market, allowing our clients with actionable intelligence and reliable forecasts tailored to emerging regional needs.
Yes, we provide customisation as per your requirements. To learn more, feel free to contact us on sales@6wresearch.com
1 Executive Summary |
2 Introduction |
2.1 Key Highlights of the Report |
2.2 Report Description |
2.3 Market Scope & Segmentation |
2.4 Research Methodology |
2.5 Assumptions |
3 Lithuania Corn Starch Market Overview |
3.1 Lithuania Country Macro Economic Indicators |
3.2 Lithuania Corn Starch Market Revenues & Volume, 2022 & 2032F |
3.3 Lithuania Corn Starch Market - Industry Life Cycle |
3.4 Lithuania Corn Starch Market - Porter's Five Forces |
3.5 Lithuania Corn Starch Market Revenues & Volume Share, By Type, 2022 & 2032F |
3.6 Lithuania Corn Starch Market Revenues & Volume Share, By Application, 2022 & 2032F |
4 Lithuania Corn Starch Market Dynamics |
4.1 Impact Analysis |
4.2 Market Drivers |
4.2.1 Increasing demand for corn starch in the food and beverage industry due to its various applications such as a thickening agent, stabilizer, and texture enhancer. |
4.2.2 Growing awareness about the benefits of corn starch as a gluten-free alternative in food products, catering to the rising trend of gluten-free diets. |
4.2.3 Expansion of the industrial sector in Lithuania, leading to higher consumption of corn starch for industrial applications such as adhesives, paper production, and textiles. |
4.3 Market Restraints |
4.3.1 Fluctuations in raw material prices, such as corn, which can impact the overall production cost of corn starch. |
4.3.2 Competition from substitute products like potato starch or tapioca starch, which offer similar functionalities and may pose a challenge to market growth. |
4.3.3 Regulatory constraints and compliance requirements related to food safety standards and labeling regulations that may affect the market penetration of corn starch. |
5 Lithuania Corn Starch Market Trends |
6 Lithuania Corn Starch Market Segmentations |
6.1 Lithuania Corn Starch Market, By Type |
6.1.1 Overview and Analysis |
6.1.2 Lithuania Corn Starch Market Revenues & Volume, By Native Starch, 2022 - 2032F |
6.1.3 Lithuania Corn Starch Market Revenues & Volume, By Modified Starch, 2022 - 2032F |
6.1.4 Lithuania Corn Starch Market Revenues & Volume, By Sweeteners, 2022 - 2032F |
6.2 Lithuania Corn Starch Market, By Application |
6.2.1 Overview and Analysis |
6.2.2 Lithuania Corn Starch Market Revenues & Volume, By Food and Beverages, 2022 - 2032F |
6.2.3 Lithuania Corn Starch Market Revenues & Volume, By Animal Feed, 2022 - 2032F |
6.2.4 Lithuania Corn Starch Market Revenues & Volume, By Pharmaceuticals and Chemicals, 2022 - 2032F |
6.2.5 Lithuania Corn Starch Market Revenues & Volume, By Textiles, 2022 - 2032F |
6.2.6 Lithuania Corn Starch Market Revenues & Volume, By Paper and Corrugates, 2022 - 2032F |
6.2.7 Lithuania Corn Starch Market Revenues & Volume, By Others, 2022 - 2032F |
7 Lithuania Corn Starch Market Import-Export Trade Statistics |
7.1 Lithuania Corn Starch Market Export to Major Countries |
7.2 Lithuania Corn Starch Market Imports from Major Countries |
8 Lithuania Corn Starch Market Key Performance Indicators |
8.1 Average selling price of corn starch in Lithuania. |
8.2 Percentage of food manufacturers using corn starch in their products. |
8.3 Investment in research and development for new corn starch applications. |
8.4 Number of new product launches containing corn starch. |
9 Lithuania Corn Starch Market - Opportunity Assessment |
9.1 Lithuania Corn Starch Market Opportunity Assessment, By Type, 2022 & 2032F |
9.2 Lithuania Corn Starch Market Opportunity Assessment, By Application, 2022 & 2032F |
10 Lithuania Corn Starch Market - Competitive Landscape |
10.1 Lithuania Corn Starch Market Revenue Share, By Companies, 2025 |
10.2 Lithuania Corn Starch Market Competitive Benchmarking, By Operating and Technical Parameters |
11 Company Profiles |
12 Recommendations | 13 Disclaimer |
Global Go To Market Strategy - 2030
Export potential enables firms to identify high-growth global markets with greater confidence by combining advanced trade intelligence with a structured quantitative methodology. The framework analyzes emerging demand trends and country-level import patterns while integrating macroeconomic and trade datasets such as GDP and population forecasts, bilateral import–export flows, tariff structures, elasticity differentials between developed and developing economies, geographic distance, and import demand projections. Using weighted trade values from 2020–2024 as the base period to project country-to-country export potential for 2030, these inputs are operationalized through calculated drivers such as gravity model parameters, tariff impact factors, and projected GDP per-capita growth. Through an analysis of hidden potentials, demand hotspots, and market conditions that are most favorable to success, this method enables firms to focus on target countries, maximize returns, and global expansion with data, backed by accuracy.
By factoring in the projected importer demand gap that is currently unmet and could be potential opportunity, it identifies the potential for the Exporter (Country) among 190 countries, against the general trade analysis, which identifies the biggest importer or exporter.
To discover high-growth global markets and optimize your business strategy:
Click Here
Pricing
- Single User License$ 1,995
- Department License$ 2,400
- Site License$ 3,120
- Global License$ 3,795

Leadership Perspectives from Industry Events
Search
Thought Leadership and Analyst Meet


Our Clients
6WResearch In News
- Doha a strategic location for EV manufacturing hub: IPA Qatar
- Demand for luxury TVs surging in the GCC, says Samsung
- Empowering Growth: The Thriving Journey of Bangladesh’s Cable Industry
- Demand for luxury TVs surging in the GCC, says Samsung
- Video call with a traditional healer? Once unthinkable, it’s now common in South Africa
- Intelligent Buildings To Smooth GCC’s Path To Net Zero
Latest Reports
- Taiwan Airport Wireless Infrastructure Market (2026-2032)
- Vietnam Airport Wireless Infrastructure Market (2026-2032)
- Thailand Airport Wireless Infrastructure Market (2026-2032)
- South Korea Airport Wireless Infrastructure Market (2026-2032)
- Romania Airport Wireless Infrastructure Market (2026-2032)
- Qatar Airport Wireless Infrastructure Market (2026-2032)
- Philippines Airport Wireless Infrastructure Market (2026-2032)
- Japan Airport Wireless Infrastructure Market (2026-2032)
- Taiwan Airport Winter Services Market (2026-2032)
- Vietnam Airport Winter Services Market (2026-2032)
Industry Events and Analyst Meet

HIMTEX 2026

India Refining Summit 2026

India EV Show 2026

EV tech India Expo 2026

Auto Tech Asia 2026
Whitepaper
- Middle East & Africa Commercial Security Market Click here to view more.
- Middle East & Africa Fire Safety Systems & Equipment Market Click here to view more.
- GCC Drone Market Click here to view more.
- Middle East Lighting Fixture Market Click here to view more.
- GCC Physical & Perimeter Security Market Click here to view more.