Lithuania Electrical Enclosure Market (2026-2032) | Trends, Strategic Insights, Segmentation, Industry, Value, Share, Growth, Drivers, Restraints, Investment Trends, Segments, Opportunities, Competitive, Supply, Strategy, Pricing Analysis, Challenges, Consumer Insights, Size, Demand, Competition, Analysis, Companies, Revenue, Outlook, Forecast
Market Forecast By Enclosure Type (Wall-Mounted Enclosure, Floor-Standing Enclosure, Junction Box, Hazardous Location Enclosure), By Features (Space-Saving, Large Capacity, Compact, Explosion-Proof), By Application (Industrial Equipment Protection, Power Distribution, Residential Electrical Systems, Oil & Gas), By End User (Manufacturing Plants, Utility Companies, Homeowners, Energy Sector), By Material (Stainless Steel, Aluminum, Polycarbonate, Fiberglass) And Competitive Landscape
| Product Code: ETC11853498 | Publication Date: Apr 2025 | Updated Date: Apr 2026 | Product Type: Market Research Report | |
| Publisher: 6Wresearch | No. of Pages: 65 | No. of Figures: 34 | No. of Tables: 19 | |
Lithuania Electrical Enclosure Market Size (2020-2030)
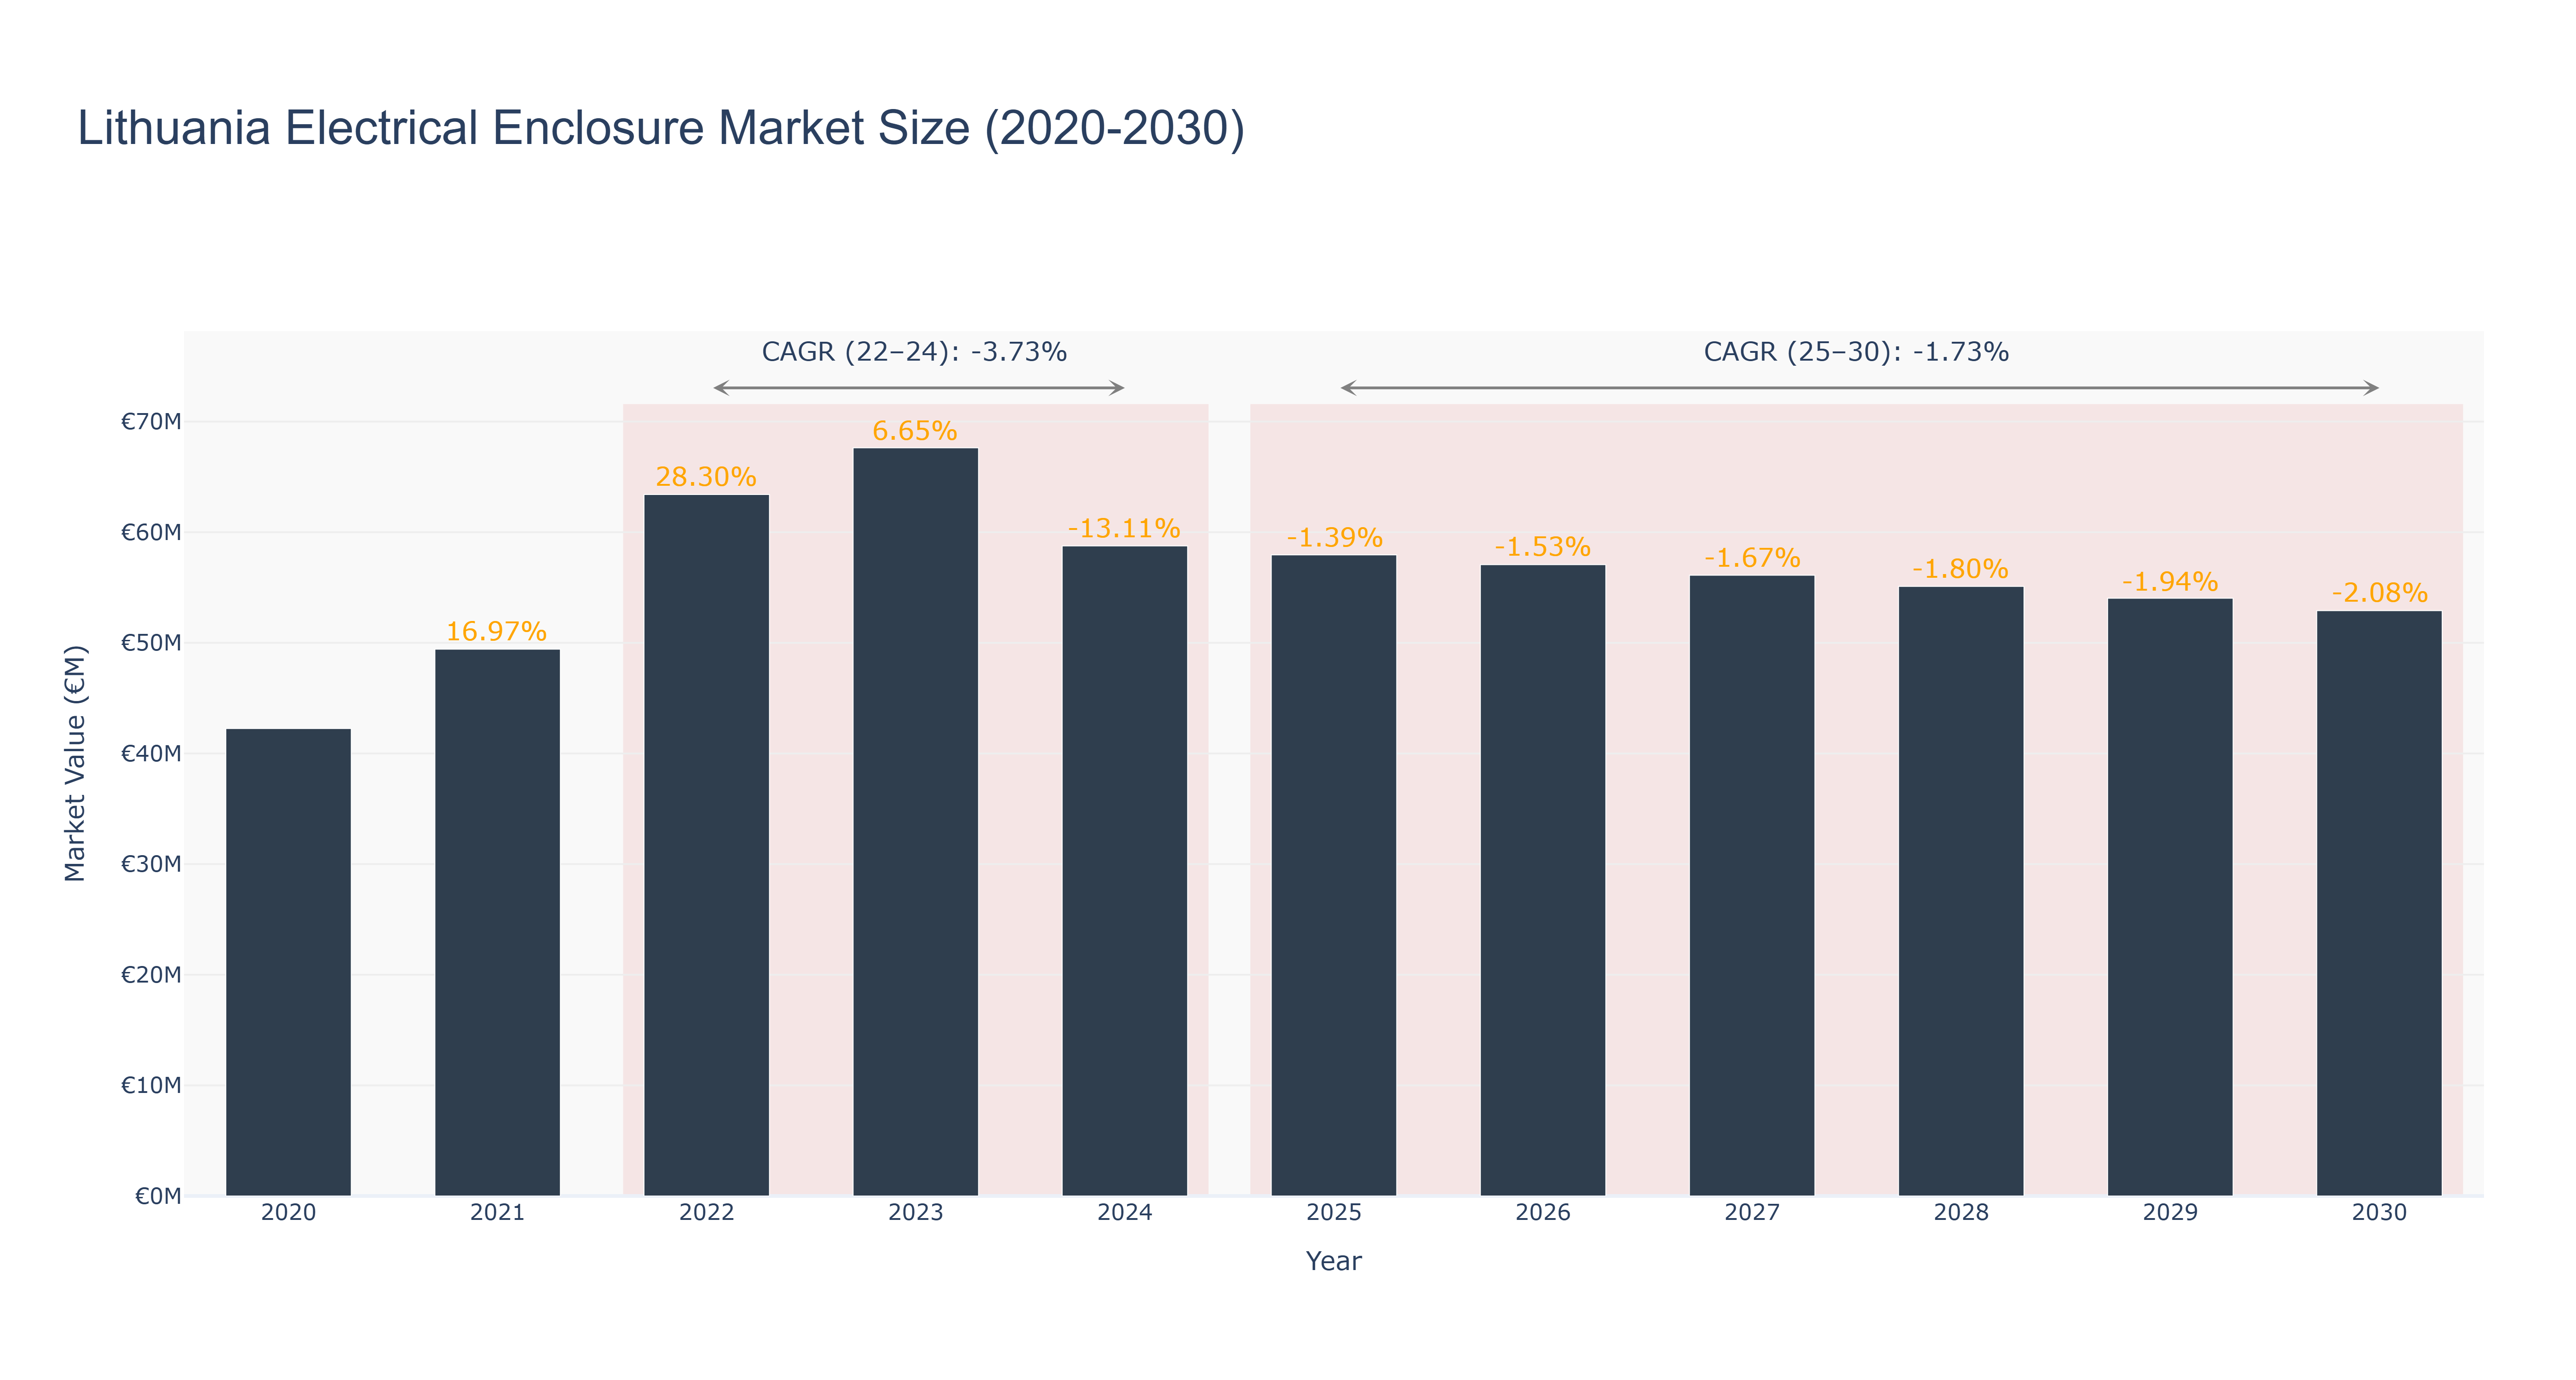
The Lithuania Electrical Enclosure Market experienced significant growth from 2020 to 2022, peaking at €63.41 million in 2022, before declining to €58.76 million in 2024, reflecting an actual CAGR of -3.73% during this period. The market grew robustly in 2021 and 2022, driven by increased investments in infrastructure and industrial automation. However, the downturn in 2023, with a modest market size of €67.63 million and a growth rate of 6.65%, signals a shift towards stabilization, followed by a more pronounced decline projected from 2025 to 2030. The forecasted CAGR of -1.73% indicates continued contraction, primarily due to market saturation and the shifting focus towards alternative technologies. While macroeconomic factors could impact future investment, the sector may benefit from the growing emphasis on sustainability and energy efficiency in upcoming projects, potentially stimulating demand for innovative electrical enclosure solutions.
Lithuania Electrical Enclosure Market: Production & Trade Performance (2019-2025)
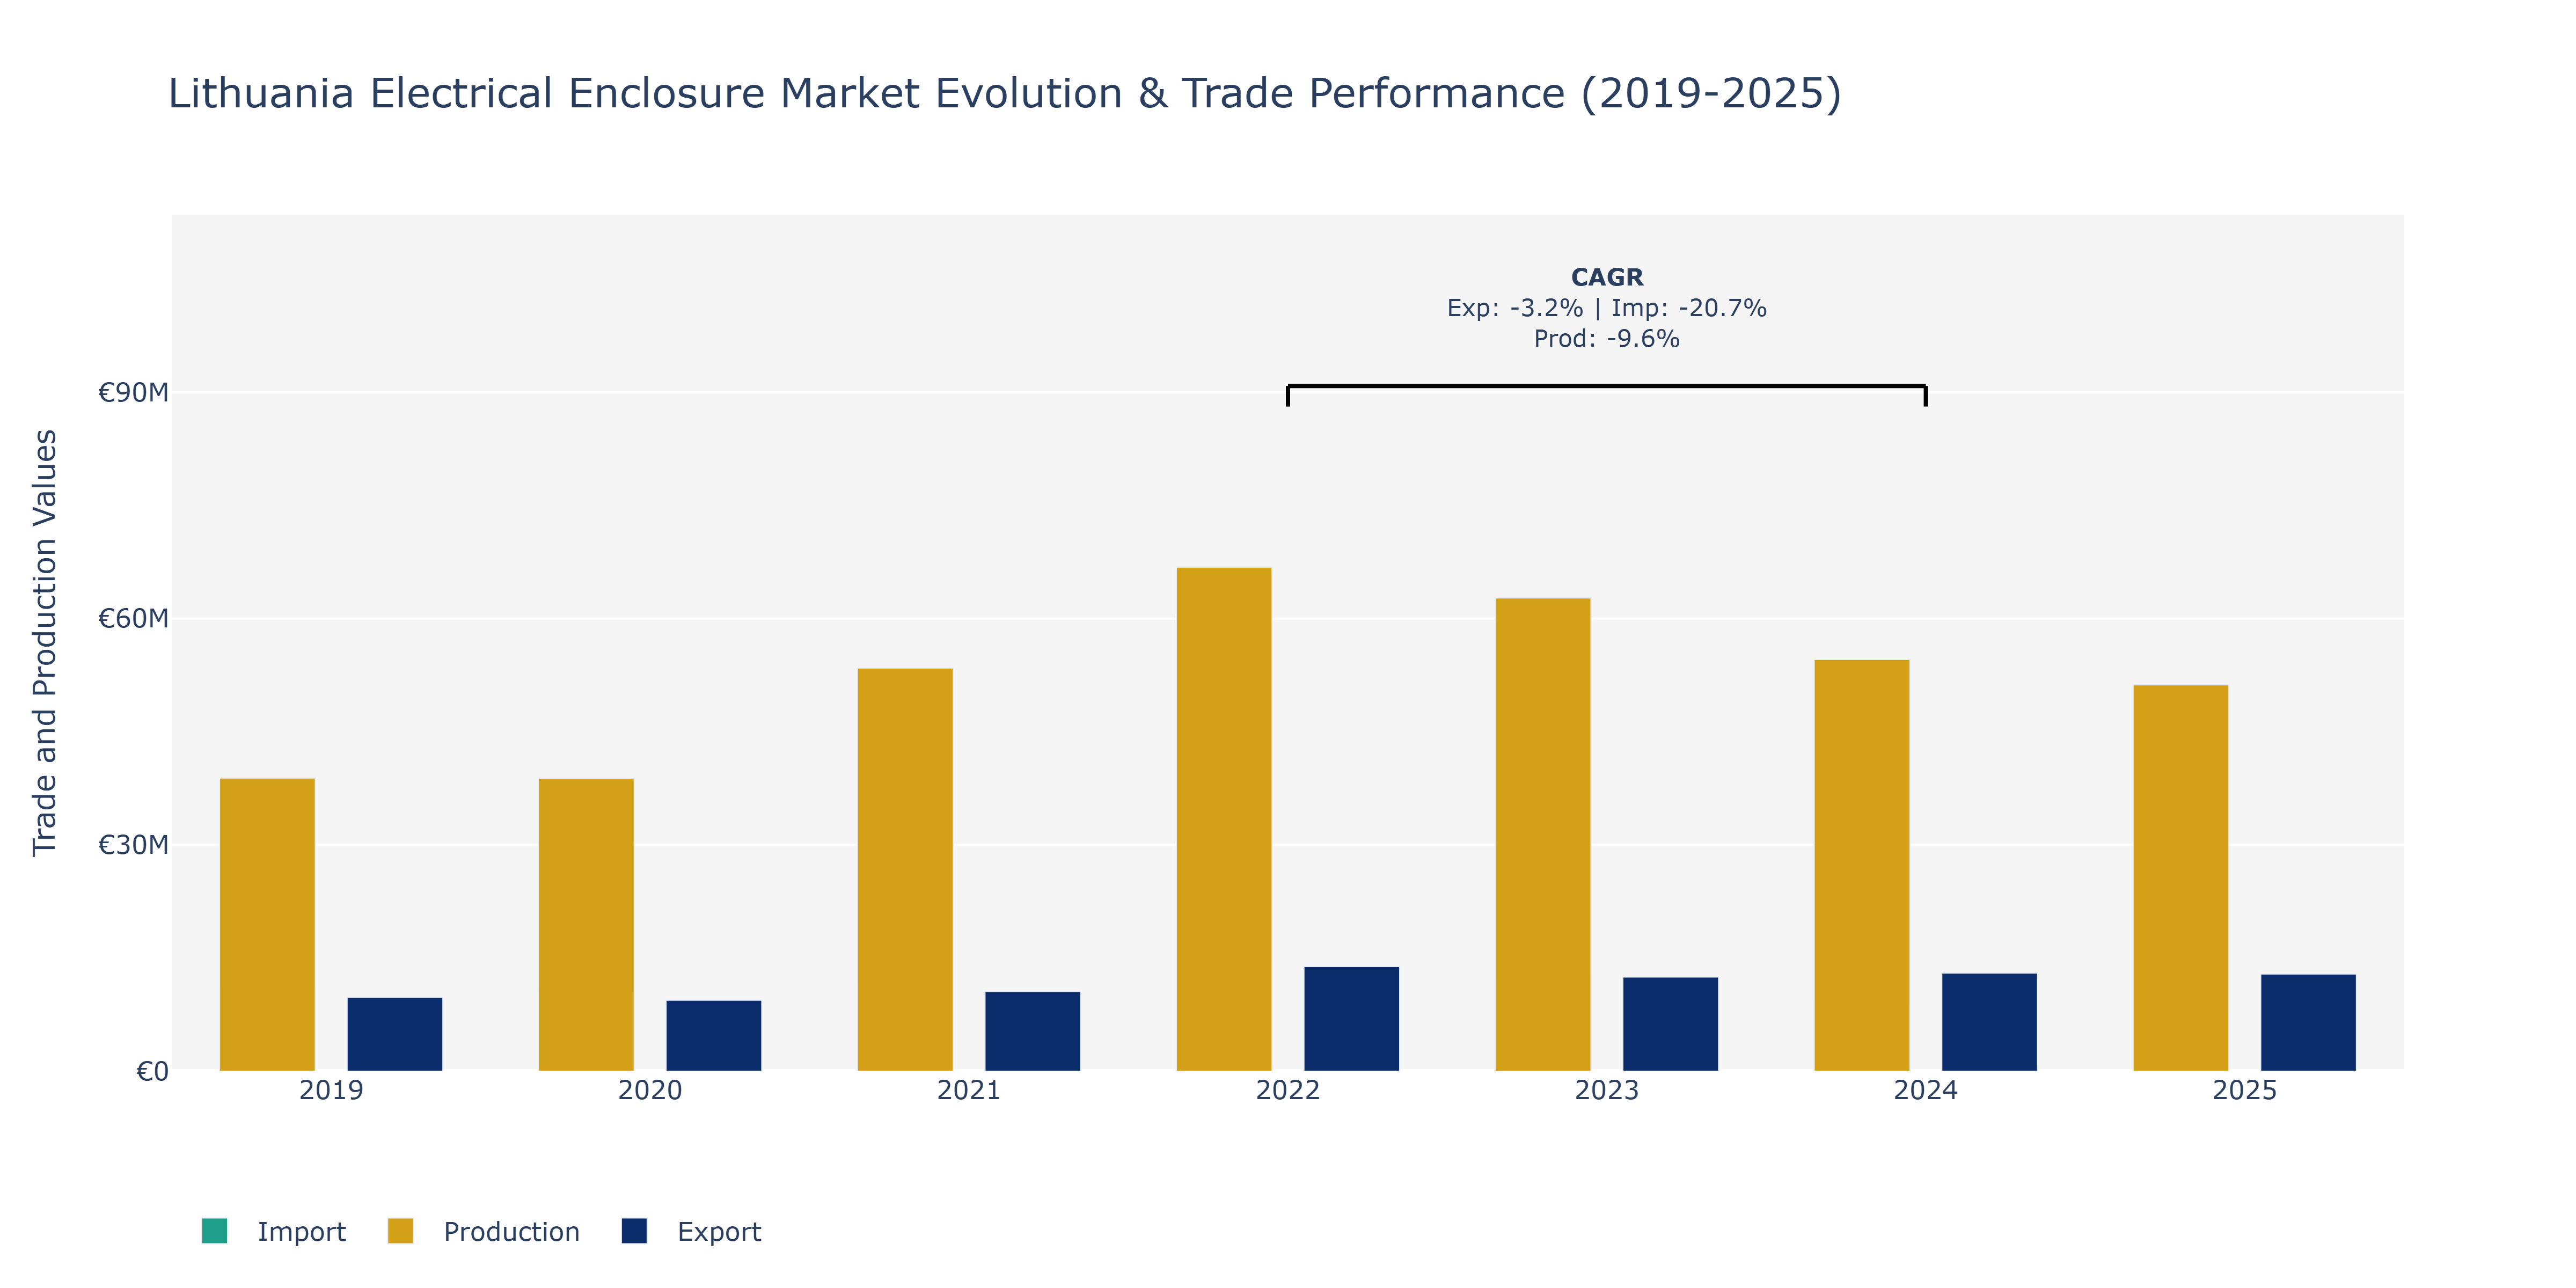
In the Lithuania Electrical Enclosure Market, a notable fluctuation in key metrics is observed over the years. In 2019, both exports and imports stood at €9.79 million and €11.1 million, respectively, with production at €38.86 billion. Subsequently, a slight decrease occurred in 2020, with exports declining to €9.42 million, imports to €10.58 million, while production remained stable at €38.32 billion. The market saw a significant upsurge in 2021, marked by exports of €10.54 million, imports of €11.53 million, and a substantial production increase to €53.45 billion, likely driven by heightened demand and improved manufacturing capabilities. However, by 2024, a shift emerged with exports at €13.0 million, imports at €8.99 million, and production at €54.58 billion, possibly indicating evolving trade patterns and production efficiencies. The decrease in imports from 2022 to 2024 at a CAGR of -20.66% could be attributed to enhanced domestic manufacturing capabilities or changes in global supply chains, impacting the overall market dynamics. Further research into evolving trade agreements and technological advancements in the sector is recommended to better understand these trends.
Key Highlights of the Report:
- Lithuania Electrical Enclosure Market Outlook
- Market Size of Lithuania Electrical Enclosure Market, 2025
- Forecast of Lithuania Electrical Enclosure Market, 2032
- Historical Data and Forecast of Lithuania Electrical Enclosure Revenues & Volume for the Period 2022 - 2032F
- Lithuania Electrical Enclosure Market Trend Evolution
- Lithuania Electrical Enclosure Market Drivers and Challenges
- Lithuania Electrical Enclosure Price Trends
- Lithuania Electrical Enclosure Porter's Five Forces
- Lithuania Electrical Enclosure Industry Life Cycle
- Historical Data and Forecast of Lithuania Electrical Enclosure Market Revenues & Volume By Enclosure Type for the Period 2022 - 2032F
- Historical Data and Forecast of Lithuania Electrical Enclosure Market Revenues & Volume By Wall-Mounted Enclosure for the Period 2022 - 2032F
- Historical Data and Forecast of Lithuania Electrical Enclosure Market Revenues & Volume By Floor-Standing Enclosure for the Period 2022 - 2032F
- Historical Data and Forecast of Lithuania Electrical Enclosure Market Revenues & Volume By Junction Box for the Period 2022 - 2032F
- Historical Data and Forecast of Lithuania Electrical Enclosure Market Revenues & Volume By Hazardous Location Enclosure for the Period 2022 - 2032F
- Historical Data and Forecast of Lithuania Electrical Enclosure Market Revenues & Volume By Features for the Period 2022 - 2032F
- Historical Data and Forecast of Lithuania Electrical Enclosure Market Revenues & Volume By Space-Saving for the Period 2022 - 2032F
- Historical Data and Forecast of Lithuania Electrical Enclosure Market Revenues & Volume By Large Capacity for the Period 2022 - 2032F
- Historical Data and Forecast of Lithuania Electrical Enclosure Market Revenues & Volume By Compact for the Period 2022 - 2032F
- Historical Data and Forecast of Lithuania Electrical Enclosure Market Revenues & Volume By Explosion-Proof for the Period 2022 - 2032F
- Historical Data and Forecast of Lithuania Electrical Enclosure Market Revenues & Volume By Application for the Period 2022 - 2032F
- Historical Data and Forecast of Lithuania Electrical Enclosure Market Revenues & Volume By Industrial Equipment Protection for the Period 2022 - 2032F
- Historical Data and Forecast of Lithuania Electrical Enclosure Market Revenues & Volume By Power Distribution for the Period 2022 - 2032F
- Historical Data and Forecast of Lithuania Electrical Enclosure Market Revenues & Volume By Residential Electrical Systems for the Period 2022 - 2032F
- Historical Data and Forecast of Lithuania Electrical Enclosure Market Revenues & Volume By Oil & Gas for the Period 2022 - 2032F
- Historical Data and Forecast of Lithuania Electrical Enclosure Market Revenues & Volume By End User for the Period 2022 - 2032F
- Historical Data and Forecast of Lithuania Electrical Enclosure Market Revenues & Volume By Manufacturing Plants for the Period 2022 - 2032F
- Historical Data and Forecast of Lithuania Electrical Enclosure Market Revenues & Volume By Utility Companies for the Period 2022 - 2032F
- Historical Data and Forecast of Lithuania Electrical Enclosure Market Revenues & Volume By Homeowners for the Period 2022 - 2032F
- Historical Data and Forecast of Lithuania Electrical Enclosure Market Revenues & Volume By Energy Sector for the Period 2022 - 2032F
- Historical Data and Forecast of Lithuania Electrical Enclosure Market Revenues & Volume By Material for the Period 2022 - 2032F
- Historical Data and Forecast of Lithuania Electrical Enclosure Market Revenues & Volume By Stainless Steel for the Period 2022 - 2032F
- Historical Data and Forecast of Lithuania Electrical Enclosure Market Revenues & Volume By Aluminum for the Period 2022 - 2032F
- Historical Data and Forecast of Lithuania Electrical Enclosure Market Revenues & Volume By Polycarbonate for the Period 2022 - 2032F
- Historical Data and Forecast of Lithuania Electrical Enclosure Market Revenues & Volume By Fiberglass for the Period 2022 - 2032F
- Lithuania Electrical Enclosure Import Export Trade Statistics
- Market Opportunity Assessment By Enclosure Type
- Market Opportunity Assessment By Features
- Market Opportunity Assessment By Application
- Market Opportunity Assessment By End User
- Market Opportunity Assessment By Material
- Lithuania Electrical Enclosure Top Companies Market Share
- Lithuania Electrical Enclosure Competitive Benchmarking By Technical and Operational Parameters
- Lithuania Electrical Enclosure Company Profiles
- Lithuania Electrical Enclosure Key Strategic Recommendations
Frequently Asked Questions About the Market Study (FAQs):
6Wresearch actively monitors the Lithuania Electrical Enclosure Market and publishes its comprehensive annual report, highlighting emerging trends, growth drivers, revenue analysis, and forecast outlook. Our insights help businesses to make data-backed strategic decisions with ongoing market dynamics. Our analysts track relevent industries related to the Lithuania Electrical Enclosure Market, allowing our clients with actionable intelligence and reliable forecasts tailored to emerging regional needs.
Yes, we provide customisation as per your requirements. To learn more, feel free to contact us on sales@6wresearch.com
1 Executive Summary |
2 Introduction |
2.1 Key Highlights of the Report |
2.2 Report Description |
2.3 Market Scope & Segmentation |
2.4 Research Methodology |
2.5 Assumptions |
3 Lithuania Electrical Enclosure Market Overview |
3.1 Lithuania Country Macro Economic Indicators |
3.2 Lithuania Electrical Enclosure Market Revenues & Volume, 2022 & 2032F |
3.3 Lithuania Electrical Enclosure Market - Industry Life Cycle |
3.4 Lithuania Electrical Enclosure Market - Porter's Five Forces |
3.5 Lithuania Electrical Enclosure Market Revenues & Volume Share, By Enclosure Type, 2022 & 2032F |
3.6 Lithuania Electrical Enclosure Market Revenues & Volume Share, By Features, 2022 & 2032F |
3.7 Lithuania Electrical Enclosure Market Revenues & Volume Share, By Application, 2022 & 2032F |
3.8 Lithuania Electrical Enclosure Market Revenues & Volume Share, By End User, 2022 & 2032F |
3.9 Lithuania Electrical Enclosure Market Revenues & Volume Share, By Material, 2022 & 2032F |
4 Lithuania Electrical Enclosure Market Dynamics |
4.1 Impact Analysis |
4.2 Market Drivers |
4.2.1 Increasing demand for electrical enclosures due to growing industrialization in Lithuania |
4.2.2 Implementation of stringent regulations and standards for electrical safety |
4.2.3 Rising investments in infrastructure development projects in the country |
4.3 Market Restraints |
4.3.1 High initial investment cost associated with electrical enclosures |
4.3.2 Limited availability of skilled labor for installation and maintenance |
4.3.3 Fluctuating raw material prices impacting overall manufacturing costs |
5 Lithuania Electrical Enclosure Market Trends |
6 Lithuania Electrical Enclosure Market, By Types |
6.1 Lithuania Electrical Enclosure Market, By Enclosure Type |
6.1.1 Overview and Analysis |
6.1.2 Lithuania Electrical Enclosure Market Revenues & Volume, By Enclosure Type, 2022 - 2032F |
6.1.3 Lithuania Electrical Enclosure Market Revenues & Volume, By Wall-Mounted Enclosure, 2022 - 2032F |
6.1.4 Lithuania Electrical Enclosure Market Revenues & Volume, By Floor-Standing Enclosure, 2022 - 2032F |
6.1.5 Lithuania Electrical Enclosure Market Revenues & Volume, By Junction Box, 2022 - 2032F |
6.1.6 Lithuania Electrical Enclosure Market Revenues & Volume, By Hazardous Location Enclosure, 2022 - 2032F |
6.2 Lithuania Electrical Enclosure Market, By Features |
6.2.1 Overview and Analysis |
6.2.2 Lithuania Electrical Enclosure Market Revenues & Volume, By Space-Saving, 2022 - 2032F |
6.2.3 Lithuania Electrical Enclosure Market Revenues & Volume, By Large Capacity, 2022 - 2032F |
6.2.4 Lithuania Electrical Enclosure Market Revenues & Volume, By Compact, 2022 - 2032F |
6.2.5 Lithuania Electrical Enclosure Market Revenues & Volume, By Explosion-Proof, 2022 - 2032F |
6.3 Lithuania Electrical Enclosure Market, By Application |
6.3.1 Overview and Analysis |
6.3.2 Lithuania Electrical Enclosure Market Revenues & Volume, By Industrial Equipment Protection, 2022 - 2032F |
6.3.3 Lithuania Electrical Enclosure Market Revenues & Volume, By Power Distribution, 2022 - 2032F |
6.3.4 Lithuania Electrical Enclosure Market Revenues & Volume, By Residential Electrical Systems, 2022 - 2032F |
6.3.5 Lithuania Electrical Enclosure Market Revenues & Volume, By Oil & Gas, 2022 - 2032F |
6.4 Lithuania Electrical Enclosure Market, By End User |
6.4.1 Overview and Analysis |
6.4.2 Lithuania Electrical Enclosure Market Revenues & Volume, By Manufacturing Plants, 2022 - 2032F |
6.4.3 Lithuania Electrical Enclosure Market Revenues & Volume, By Utility Companies, 2022 - 2032F |
6.4.4 Lithuania Electrical Enclosure Market Revenues & Volume, By Homeowners, 2022 - 2032F |
6.4.5 Lithuania Electrical Enclosure Market Revenues & Volume, By Energy Sector, 2022 - 2032F |
6.5 Lithuania Electrical Enclosure Market, By Material |
6.5.1 Overview and Analysis |
6.5.2 Lithuania Electrical Enclosure Market Revenues & Volume, By Stainless Steel, 2022 - 2032F |
6.5.3 Lithuania Electrical Enclosure Market Revenues & Volume, By Aluminum, 2022 - 2032F |
6.5.4 Lithuania Electrical Enclosure Market Revenues & Volume, By Polycarbonate, 2022 - 2032F |
6.5.5 Lithuania Electrical Enclosure Market Revenues & Volume, By Fiberglass, 2022 - 2032F |
7 Lithuania Electrical Enclosure Market Import-Export Trade Statistics |
7.1 Lithuania Electrical Enclosure Market Export to Major Countries |
7.2 Lithuania Electrical Enclosure Market Imports from Major Countries |
8 Lithuania Electrical Enclosure Market Key Performance Indicators |
8.1 Percentage of industrial growth in Lithuania |
8.2 Number of new infrastructure projects announced |
8.3 Adoption rate of advanced technologies in electrical enclosures |
9 Lithuania Electrical Enclosure Market - Opportunity Assessment |
9.1 Lithuania Electrical Enclosure Market Opportunity Assessment, By Enclosure Type, 2022 & 2032F |
9.2 Lithuania Electrical Enclosure Market Opportunity Assessment, By Features, 2022 & 2032F |
9.3 Lithuania Electrical Enclosure Market Opportunity Assessment, By Application, 2022 & 2032F |
9.4 Lithuania Electrical Enclosure Market Opportunity Assessment, By End User, 2022 & 2032F |
9.5 Lithuania Electrical Enclosure Market Opportunity Assessment, By Material, 2022 & 2032F |
10 Lithuania Electrical Enclosure Market - Competitive Landscape |
10.1 Lithuania Electrical Enclosure Market Revenue Share, By Companies, 2025 |
10.2 Lithuania Electrical Enclosure Market Competitive Benchmarking, By Operating and Technical Parameters |
11 Company Profiles |
12 Recommendations |
13 Disclaimer |
Global Go To Market Strategy - 2030
Export potential enables firms to identify high-growth global markets with greater confidence by combining advanced trade intelligence with a structured quantitative methodology. The framework analyzes emerging demand trends and country-level import patterns while integrating macroeconomic and trade datasets such as GDP and population forecasts, bilateral import–export flows, tariff structures, elasticity differentials between developed and developing economies, geographic distance, and import demand projections. Using weighted trade values from 2020–2024 as the base period to project country-to-country export potential for 2030, these inputs are operationalized through calculated drivers such as gravity model parameters, tariff impact factors, and projected GDP per-capita growth. Through an analysis of hidden potentials, demand hotspots, and market conditions that are most favorable to success, this method enables firms to focus on target countries, maximize returns, and global expansion with data, backed by accuracy.
By factoring in the projected importer demand gap that is currently unmet and could be potential opportunity, it identifies the potential for the Exporter (Country) among 190 countries, against the general trade analysis, which identifies the biggest importer or exporter.
To discover high-growth global markets and optimize your business strategy:
Click Here
Pricing
- Single User License$ 1,995
- Department License$ 2,400
- Site License$ 3,120
- Global License$ 3,795

Leadership Perspectives from Industry Events
Search
Thought Leadership and Analyst Meet


Our Clients
6WResearch In News
- Doha a strategic location for EV manufacturing hub: IPA Qatar
- Demand for luxury TVs surging in the GCC, says Samsung
- Empowering Growth: The Thriving Journey of Bangladesh’s Cable Industry
- Demand for luxury TVs surging in the GCC, says Samsung
- Video call with a traditional healer? Once unthinkable, it’s now common in South Africa
- Intelligent Buildings To Smooth GCC’s Path To Net Zero
Latest Reports
- Taiwan Airport Wireless Infrastructure Market (2026-2032)
- Vietnam Airport Wireless Infrastructure Market (2026-2032)
- Thailand Airport Wireless Infrastructure Market (2026-2032)
- South Korea Airport Wireless Infrastructure Market (2026-2032)
- Romania Airport Wireless Infrastructure Market (2026-2032)
- Qatar Airport Wireless Infrastructure Market (2026-2032)
- Philippines Airport Wireless Infrastructure Market (2026-2032)
- Japan Airport Wireless Infrastructure Market (2026-2032)
- Taiwan Airport Winter Services Market (2026-2032)
- Vietnam Airport Winter Services Market (2026-2032)
Industry Events and Analyst Meet

HIMTEX 2026

India Refining Summit 2026

India EV Show 2026

EV tech India Expo 2026

Auto Tech Asia 2026
Whitepaper
- Middle East & Africa Commercial Security Market Click here to view more.
- Middle East & Africa Fire Safety Systems & Equipment Market Click here to view more.
- GCC Drone Market Click here to view more.
- Middle East Lighting Fixture Market Click here to view more.
- GCC Physical & Perimeter Security Market Click here to view more.