Lithuania Electrodeionization Market (2025-2031) | Share, Trends, Outlook, Companies, Revenue, Analysis, Size, Growth, Segmentation, Forecast, Value & Industry
Market Forecast By Design (Plate , Frame Construction, Spiral Wound Construction), By End Use Industry (Power Generation, Pharmaceuticals, Electronics & Semiconductor) And Competitive Landscape
| Product Code: ETC5698292 | Publication Date: Nov 2023 | Updated Date: Apr 2026 | Product Type: Market Research Report | |
| Publisher: 6Wresearch | Author: Ravi Bhandari | No. of Pages: 60 | No. of Figures: 30 | No. of Tables: 5 |
Lithuania Electrodeionization Market Size (2020-2030)
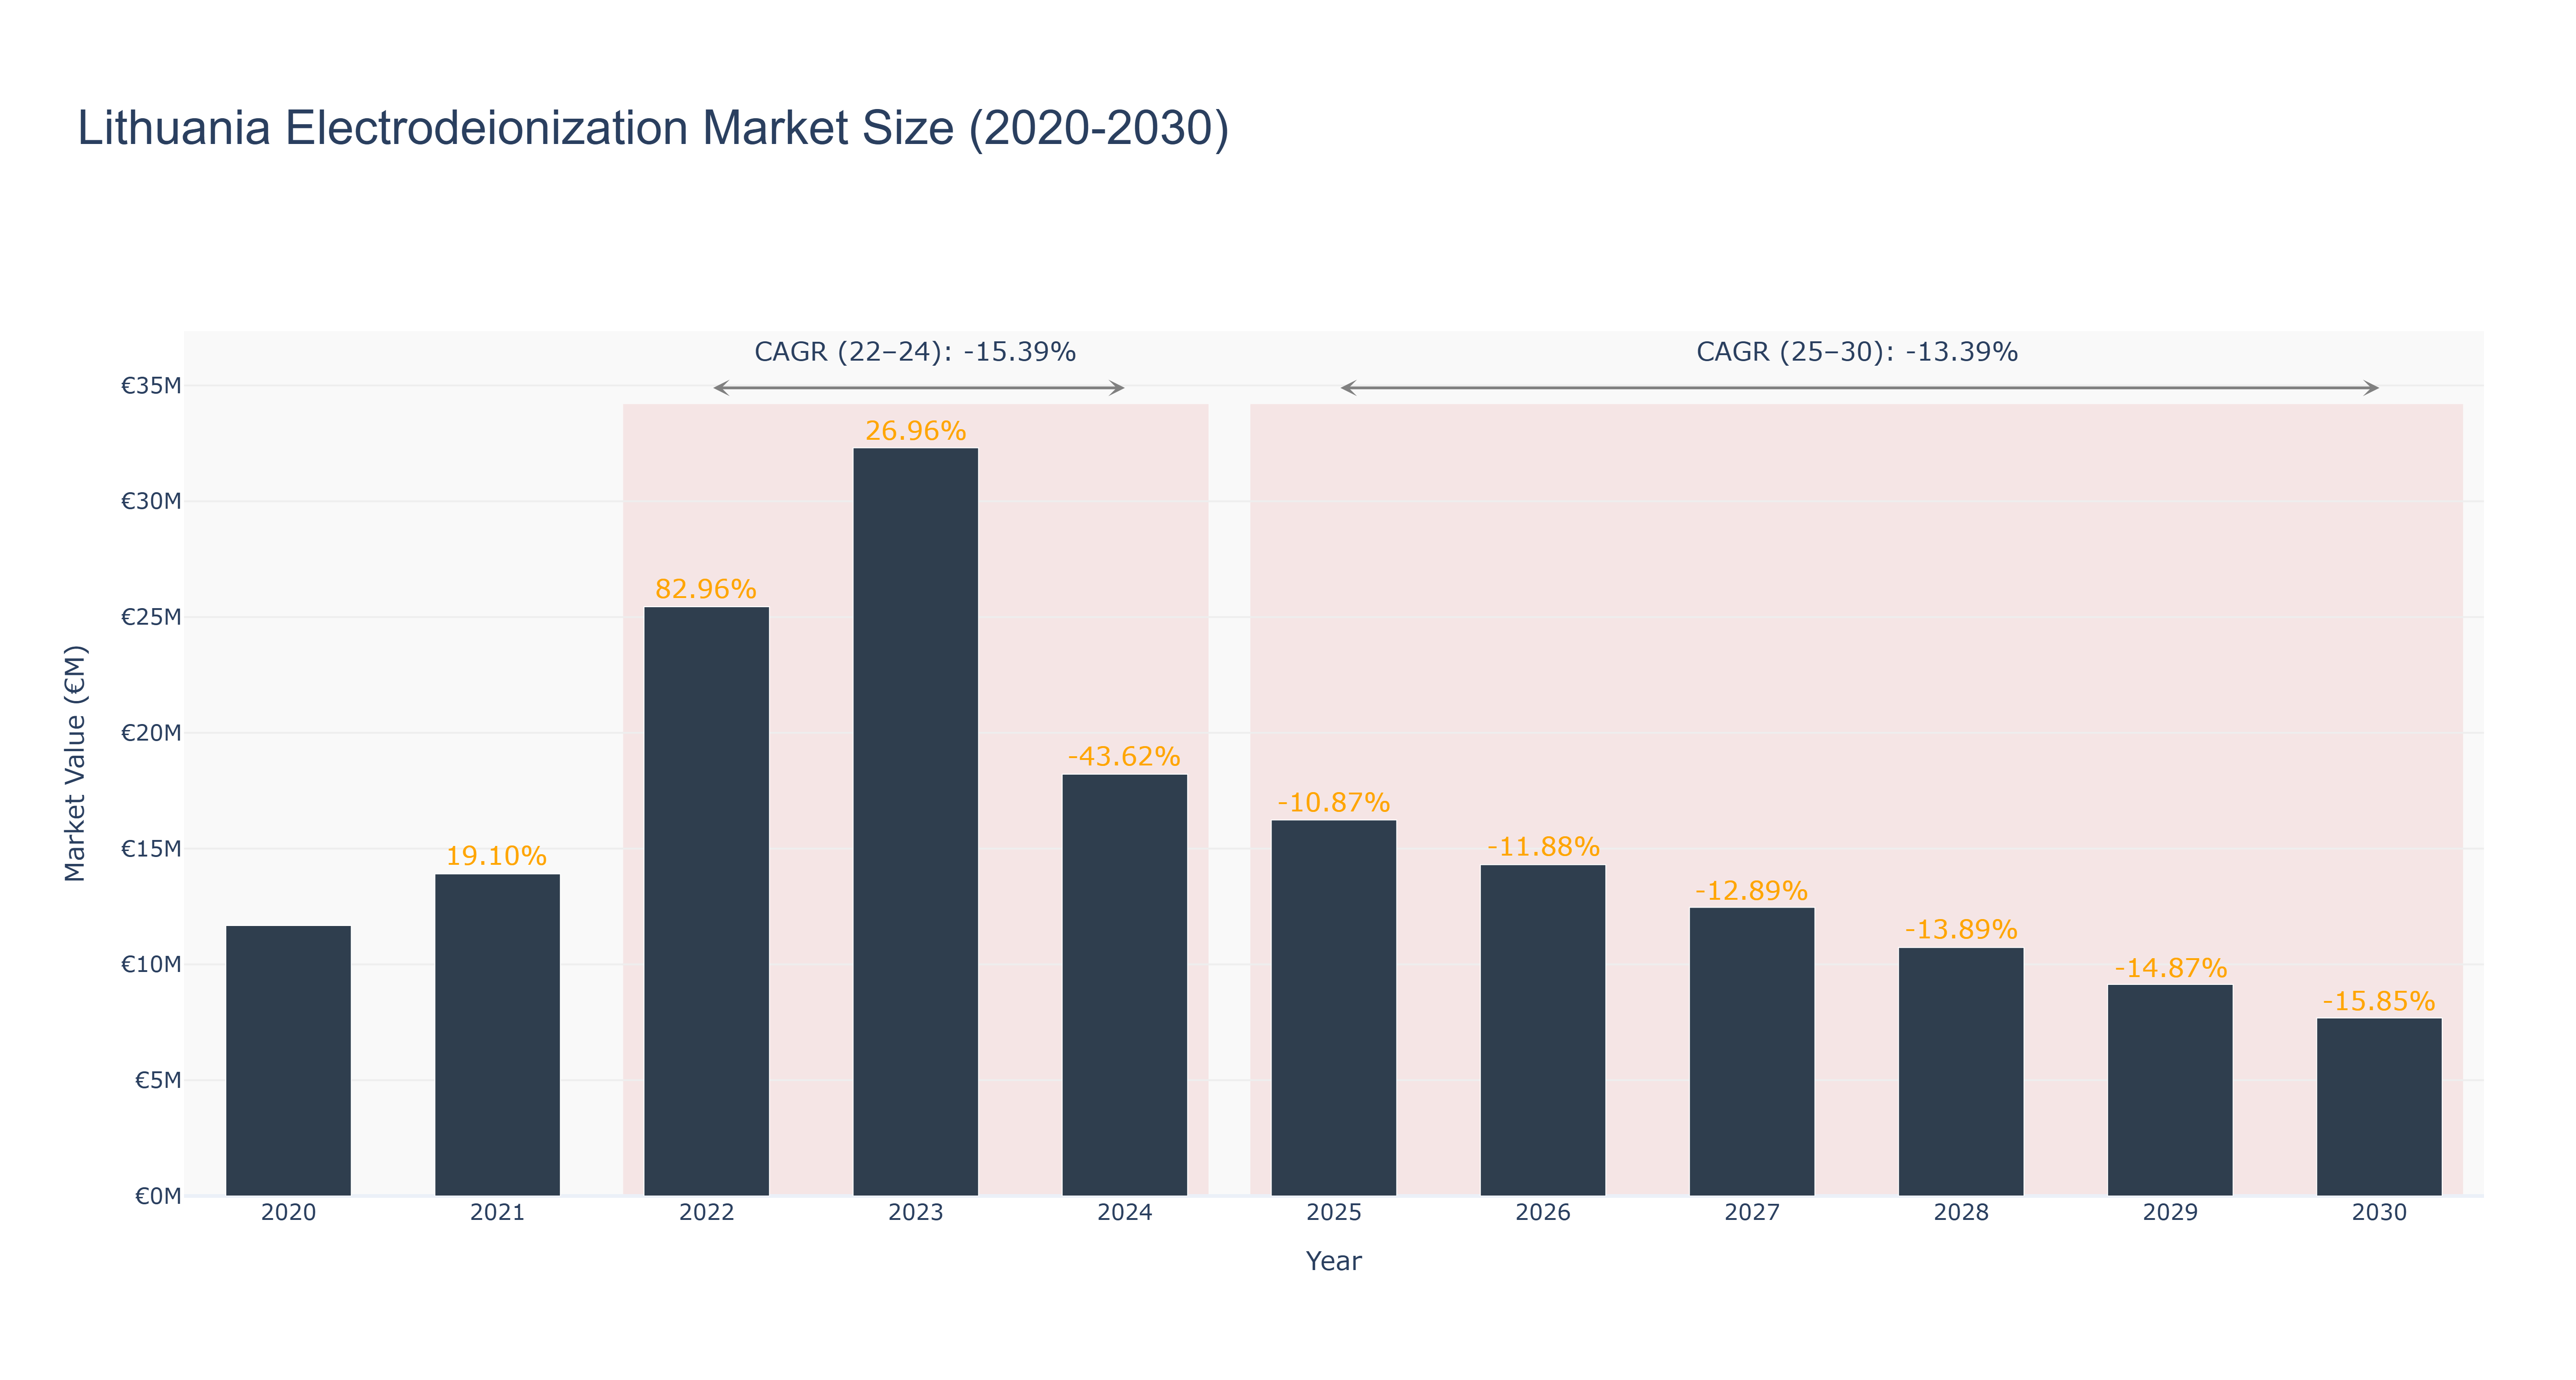
Lithuania Electrodeionization Market has seen fluctuations in market size over the years. The peak market size was €32.31 million in 2023, followed by a decline to €18.22 million in 2024. Forecasted market sizes show a continued downward trend, with an expected size of €7.69 million in 2030. The CAGR for the period 2022-24 was -15.39%, while for 2025-30, it is projected at -13.39%. The market faced challenges due to economic uncertainties and changing consumer preferences, impacting demand for electrodeionization products. Looking ahead, Lithuania is focusing on renewable energy projects to boost economic growth, with plans to invest in sustainable water treatment technologies, which could potentially drive demand for electrodeionization solutions in the future.
Lithuania Electrodeionization Market: Production & Trade Performance (2019-2025)
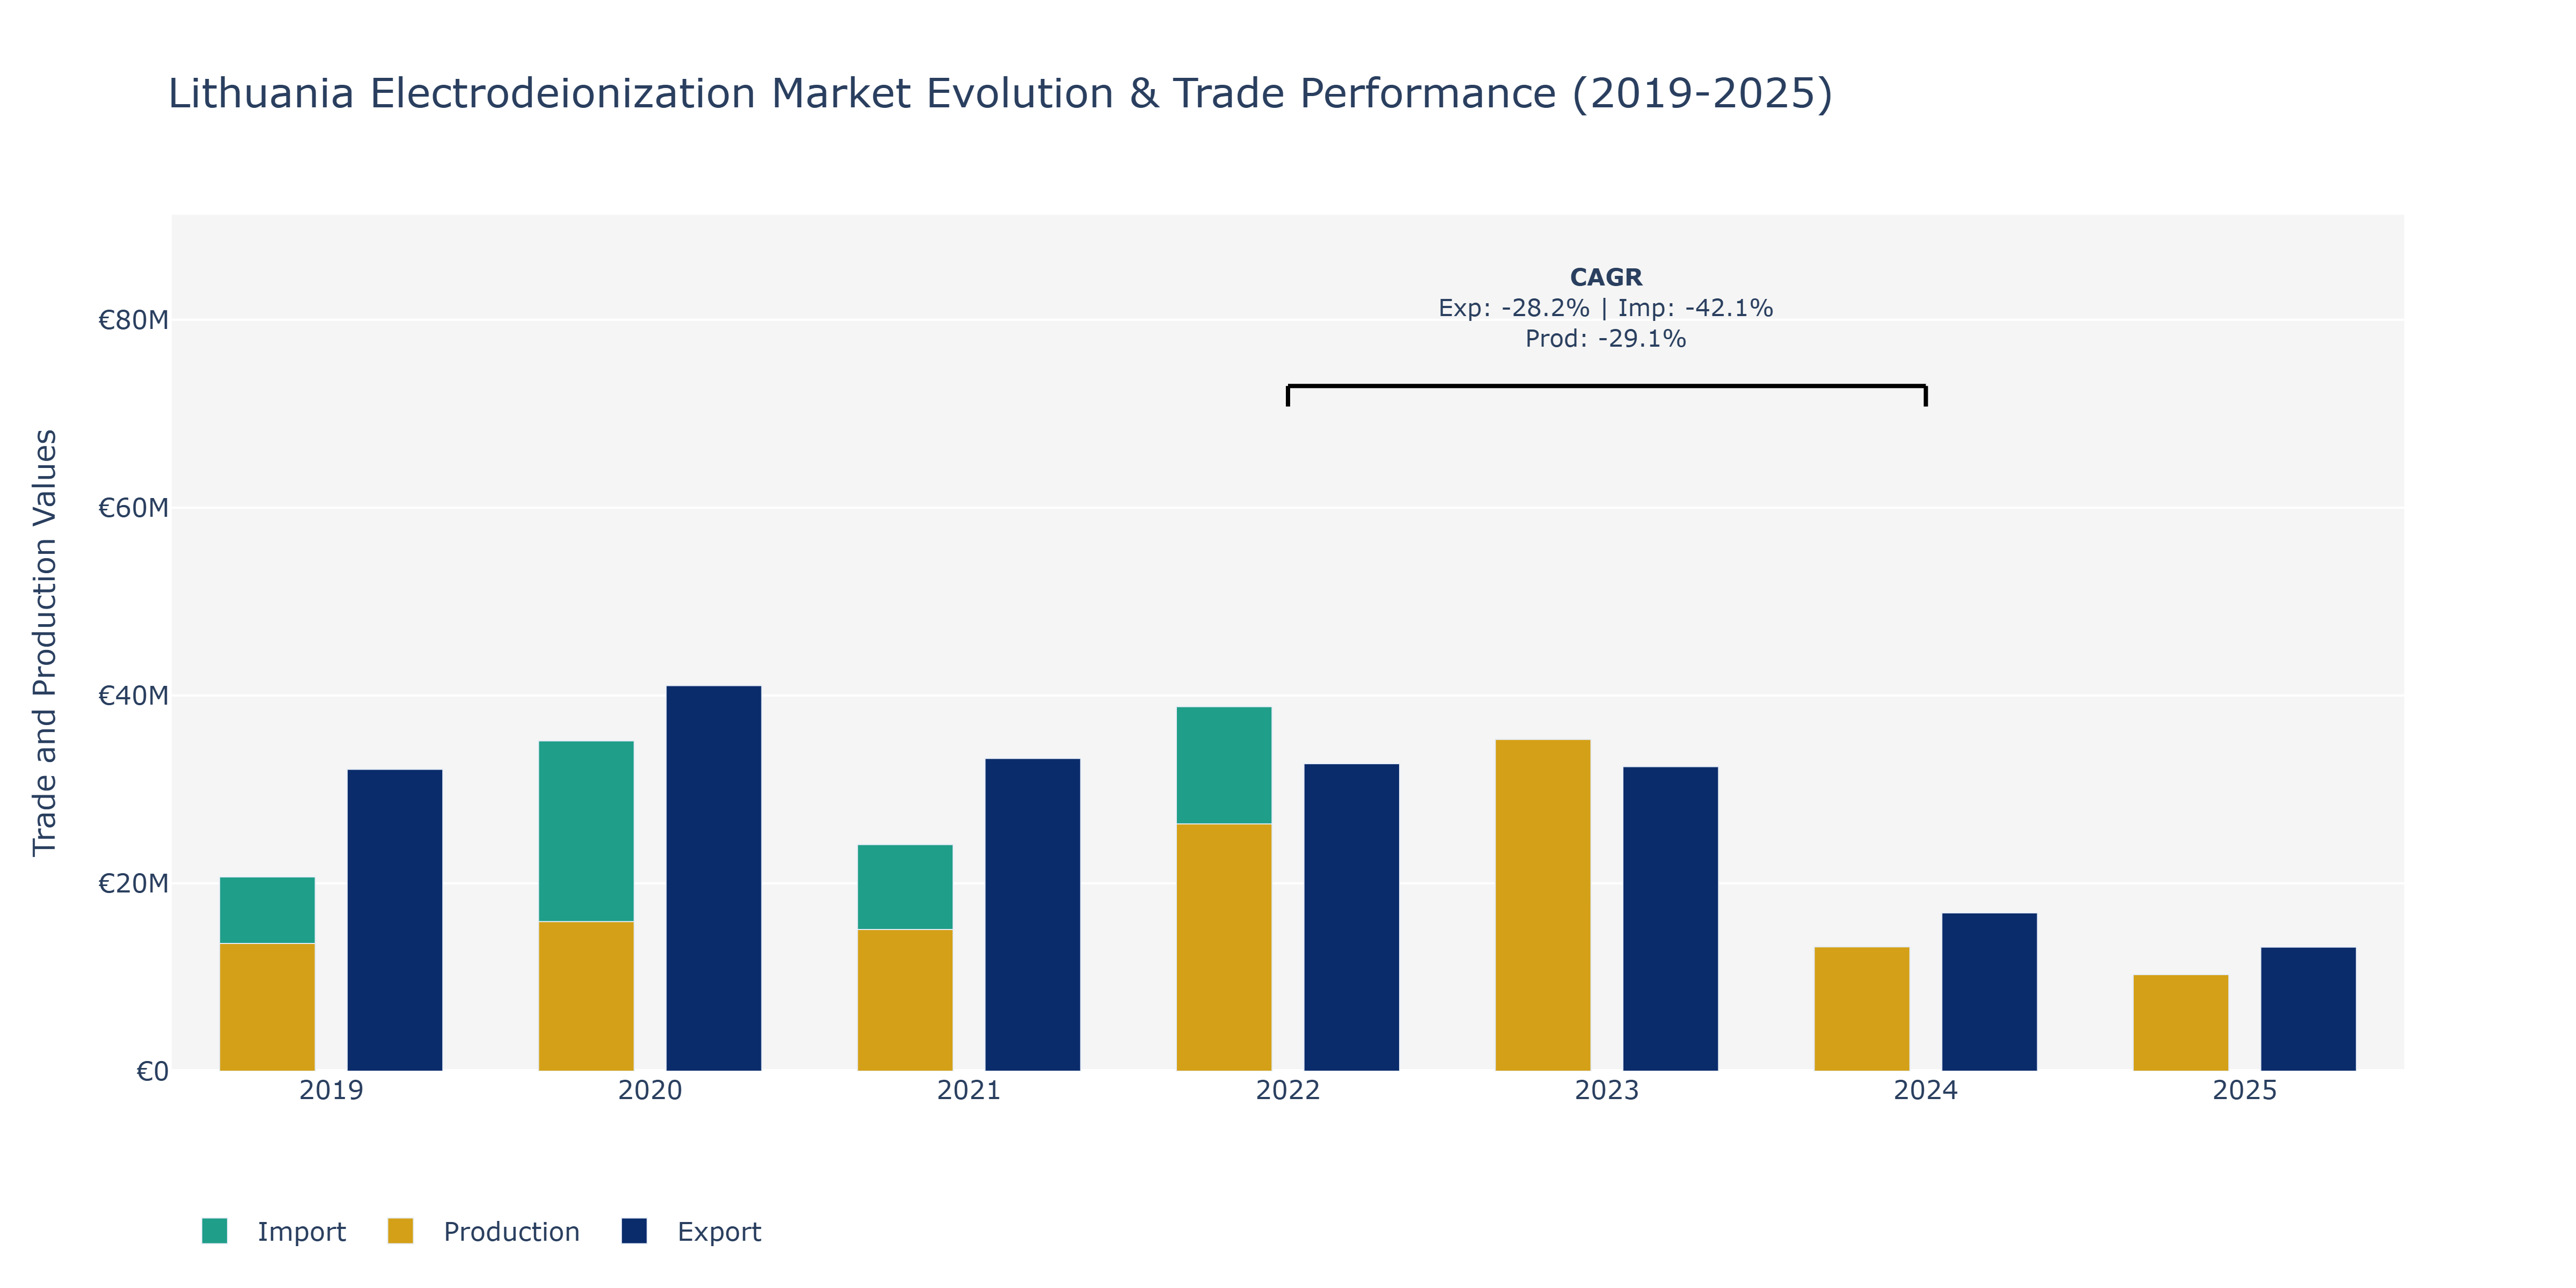
The Lithuania Electrodeionization Market witnessed fluctuations in Exports, Imports, and Production from 2019 to 2025. In 2019, Exports stood at €32.14 million, steadily rising to a peak of €41.06 million in 2020 before declining in subsequent years, reaching €13.22 million in 2025. Imports followed a similar pattern, starting at €20.69 million in 2019, peaking at €38.81 million in 2022, and decreasing to €9.77 million in 2025. Production value surged from €13.59 million in 2019 to a peak of €35.33 million in 2023, but then fell to €10.28 million in 2025. The decline in Exports, Imports, and Production can be attributed to various factors, including shifts in global demand, regulatory changes impacting trade flows, and advancements in competing purification technologies. The decline in Production specifically could be influenced by technological advancements leading to reduced demand for electrodeionization processes. These trends emphasize the market's sensitivity to external factors, necessitating strategic adaptation to maintain competitiveness in the electro-deionization industry.
Key Highlights of the Report:
- Lithuania Electrodeionization Market Outlook
- Market Size of Lithuania Electrodeionization Market, 2024
- Forecast of Lithuania Electrodeionization Market, 2031
- Historical Data and Forecast of Lithuania Electrodeionization Revenues & Volume for the Period 2021-2031
- Lithuania Electrodeionization Market Trend Evolution
- Lithuania Electrodeionization Market Drivers and Challenges
- Lithuania Electrodeionization Price Trends
- Lithuania Electrodeionization Porter`s Five Forces
- Lithuania Electrodeionization Industry Life Cycle
- Historical Data and Forecast of Lithuania Electrodeionization Market Revenues & Volume By Design for the Period 2021-2031
- Historical Data and Forecast of Lithuania Electrodeionization Market Revenues & Volume By Plate for the Period 2021-2031
- Historical Data and Forecast of Lithuania Electrodeionization Market Revenues & Volume By Frame Construction for the Period 2021-2031
- Historical Data and Forecast of Lithuania Electrodeionization Market Revenues & Volume By Spiral Wound Construction for the Period 2021-2031
- Historical Data and Forecast of Lithuania Electrodeionization Market Revenues & Volume By End Use Industry for the Period 2021-2031
- Historical Data and Forecast of Lithuania Electrodeionization Market Revenues & Volume By Power Generation for the Period 2021-2031
- Historical Data and Forecast of Lithuania Electrodeionization Market Revenues & Volume By Pharmaceuticals for the Period 2021-2031
- Historical Data and Forecast of Lithuania Electrodeionization Market Revenues & Volume By Electronics & Semiconductor for the Period 2021-2031
- Lithuania Electrodeionization Import Export Trade Statistics
- Market Opportunity Assessment By Design
- Market Opportunity Assessment By End Use Industry
- Lithuania Electrodeionization Top Companies Market Share
- Lithuania Electrodeionization Competitive Benchmarking By Technical and Operational Parameters
- Lithuania Electrodeionization Company Profiles
- Lithuania Electrodeionization Key Strategic Recommendations
Frequently Asked Questions About the Market Study (FAQs):
6Wresearch actively monitors the Lithuania Electrodeionization Market and publishes its comprehensive annual report, highlighting emerging trends, growth drivers, revenue analysis, and forecast outlook. Our insights help businesses to make data-backed strategic decisions with ongoing market dynamics. Our analysts track relevent industries related to the Lithuania Electrodeionization Market, allowing our clients with actionable intelligence and reliable forecasts tailored to emerging regional needs.
Yes, we provide customisation as per your requirements. To learn more, feel free to contact us on sales@6wresearch.com
1 Executive Summary |
2 Introduction |
2.1 Key Highlights of the Report |
2.2 Report Description |
2.3 Market Scope & Segmentation |
2.4 Research Methodology |
2.5 Assumptions |
3 Lithuania Electrodeionization Market Overview |
3.1 Lithuania Country Macro Economic Indicators |
3.2 Lithuania Electrodeionization Market Revenues & Volume, 2021 & 2031F |
3.3 Lithuania Electrodeionization Market - Industry Life Cycle |
3.4 Lithuania Electrodeionization Market - Porter's Five Forces |
3.5 Lithuania Electrodeionization Market Revenues & Volume Share, By Design, 2021 & 2031F |
3.6 Lithuania Electrodeionization Market Revenues & Volume Share, By End Use Industry, 2021 & 2031F |
4 Lithuania Electrodeionization Market Dynamics |
4.1 Impact Analysis |
4.2 Market Drivers |
4.2.1 Increasing demand for high-purity water in industries such as pharmaceuticals, food beverage, and power generation. |
4.2.2 Stringent regulations pertaining to water quality and wastewater treatment in Lithuania. |
4.2.3 Growing adoption of sustainable water treatment technologies. |
4.3 Market Restraints |
4.3.1 High initial investment costs associated with electrodeionization systems. |
4.3.2 Lack of awareness about the benefits of electrodeionization technology. |
4.3.3 Limited availability of skilled professionals for operating and maintaining electrodeionization systems. |
5 Lithuania Electrodeionization Market Trends |
6 Lithuania Electrodeionization Market Segmentations |
6.1 Lithuania Electrodeionization Market, By Design |
6.1.1 Overview and Analysis |
6.1.2 Lithuania Electrodeionization Market Revenues & Volume, By Plate , 2021-2031F |
6.1.3 Lithuania Electrodeionization Market Revenues & Volume, By Frame Construction, 2021-2031F |
6.1.4 Lithuania Electrodeionization Market Revenues & Volume, By Spiral Wound Construction, 2021-2031F |
6.2 Lithuania Electrodeionization Market, By End Use Industry |
6.2.1 Overview and Analysis |
6.2.2 Lithuania Electrodeionization Market Revenues & Volume, By Power Generation, 2021-2031F |
6.2.3 Lithuania Electrodeionization Market Revenues & Volume, By Pharmaceuticals, 2021-2031F |
6.2.4 Lithuania Electrodeionization Market Revenues & Volume, By Electronics & Semiconductor, 2021-2031F |
7 Lithuania Electrodeionization Market Import-Export Trade Statistics |
7.1 Lithuania Electrodeionization Market Export to Major Countries |
7.2 Lithuania Electrodeionization Market Imports from Major Countries |
8 Lithuania Electrodeionization Market Key Performance Indicators |
8.1 Percentage increase in the number of electrodeionization installations in Lithuania. |
8.2 Average reduction in water treatment costs achieved by companies using electrodeionization systems. |
8.3 Growth rate of electrodeionization technology adoption in key industries in Lithuania. |
9 Lithuania Electrodeionization Market - Opportunity Assessment |
9.1 Lithuania Electrodeionization Market Opportunity Assessment, By Design, 2021 & 2031F |
9.2 Lithuania Electrodeionization Market Opportunity Assessment, By End Use Industry, 2021 & 2031F |
10 Lithuania Electrodeionization Market - Competitive Landscape |
10.1 Lithuania Electrodeionization Market Revenue Share, By Companies, 2024 |
10.2 Lithuania Electrodeionization Market Competitive Benchmarking, By Operating and Technical Parameters |
11 Company Profiles |
12 Recommendations | 13 Disclaimer |
Export potential assessment - trade Analytics for 2030
Export potential enables firms to identify high-growth global markets with greater confidence by combining advanced trade intelligence with a structured quantitative methodology. The framework analyzes emerging demand trends and country-level import patterns while integrating macroeconomic and trade datasets such as GDP and population forecasts, bilateral import–export flows, tariff structures, elasticity differentials between developed and developing economies, geographic distance, and import demand projections. Using weighted trade values from 2020–2024 as the base period to project country-to-country export potential for 2030, these inputs are operationalized through calculated drivers such as gravity model parameters, tariff impact factors, and projected GDP per-capita growth. Through an analysis of hidden potentials, demand hotspots, and market conditions that are most favorable to success, this method enables firms to focus on target countries, maximize returns, and global expansion with data, backed by accuracy.
By factoring in the projected importer demand gap that is currently unmet and could be potential opportunity, it identifies the potential for the Exporter (Country) among 190 countries, against the general trade analysis, which identifies the biggest importer or exporter.
To discover high-growth global markets and optimize your business strategy:
Click Here
Pricing
- Single User License$ 1,995
- Department License$ 2,400
- Site License$ 3,120
- Global License$ 3,795

Search
Thought Leadership and Analyst Meet


Our Clients
Latest Reports
- Philippines Polyhydroxybutyrate-co-Hydroxyvalerate Market (2026-2032) | Trends, Insights, Challenges, Restraints, Competition, Size, Value, Forecast, Pricing, Share, Outlook, Revenue, Investment Opportunities, Strategy, Drivers, Demand, Growth, segmentation, Analysis, Companies
- Peru Polyhydroxybutyrate-co-Hydroxyvalerate Market (2026-2032) | Growth, Demand, Challenges, Share, Trends, Analysis, Pricing, Investment Opportunities, Drivers, Value, Forecast, Competition, Size, Companies, Insights, Outlook, Restraints, segmentation, Revenue, Strategy
- Pakistan Polyhydroxybutyrate-co-Hydroxyvalerate Market (2026-2032) | Restraints, segmentation, Pricing, Forecast, Share, Strategy, Competition, Trends, Insights, Drivers, Challenges, Growth, Revenue, Outlook, Value, Investment Opportunities, Companies, Size, Analysis, Demand
- Oman Polyhydroxybutyrate-co-Hydroxyvalerate Market (2026-2032) | Drivers, segmentation, Insights, Competition, Pricing, Outlook, Size, Revenue, Challenges, Forecast, Analysis, Growth, Value, Share, Trends, Investment Opportunities, Strategy, Restraints, Companies, Demand
- Nigeria Polyhydroxybutyrate-co-Hydroxyvalerate Market (2026-2032) | Value, Investment Opportunities, Analysis, Revenue, Restraints, Pricing, Outlook, Competition, Demand, Growth, Forecast, Companies, Trends, Challenges, segmentation, Drivers, Insights, Share, Size, Strategy
- Nepal Polyhydroxybutyrate-co-Hydroxyvalerate Market (2026-2032) | Insights, Analysis, Drivers, Share, Revenue, Demand, segmentation, Investment Opportunities, Competition, Forecast, Growth, Pricing, Companies, Strategy, Trends, Restraints, Challenges, Outlook, Size, Value
- Myanmar Polyhydroxybutyrate-co-Hydroxyvalerate Market (2026-2032) | Outlook, Revenue, Strategy, Restraints, Drivers, segmentation, Share, Forecast, Competition, Insights, Growth, Pricing, Size, Demand, Value, Companies, Trends, Challenges, Investment Opportunities, Analysis
- Morocco Polyhydroxybutyrate-co-Hydroxyvalerate Market (2026-2032) | Outlook, Investment Opportunities, Restraints, Strategy, Forecast, Challenges, Drivers, Growth, Companies, segmentation, Trends, Size, Competition, Revenue, Demand, Insights, Share, Analysis, Value, Pricing
- Mexico Polyhydroxybutyrate-co-Hydroxyvalerate Market (2026-2032) | Size, Drivers, Outlook, Share, Strategy, Growth, Pricing, Challenges, Companies, Demand, Value, Investment Opportunities, Restraints, Trends, Forecast, segmentation, Analysis, Insights, Competition, Revenue
- Malaysia Polyhydroxybutyrate-co-Hydroxyvalerate Market (2026-2032) | Share, segmentation, Size, Companies, Analysis, Insights, Forecast, Value, Revenue, Drivers, Restraints, Challenges, Investment Opportunities, Trends, Competition, Strategy, Demand, Growth, Outlook, Pricing
Industry Events and Analyst Meet

HIMTEX 2026

India Refining Summit 2026

India EV Show 2026

EV tech India Expo 2026

Auto Tech Asia 2026
Whitepaper
- Middle East & Africa Commercial Security Market Click here to view more.
- Middle East & Africa Fire Safety Systems & Equipment Market Click here to view more.
- GCC Drone Market Click here to view more.
- Middle East Lighting Fixture Market Click here to view more.
- GCC Physical & Perimeter Security Market Click here to view more.
6WResearch In News
- Doha a strategic location for EV manufacturing hub: IPA Qatar
- Demand for luxury TVs surging in the GCC, says Samsung
- Empowering Growth: The Thriving Journey of Bangladesh’s Cable Industry
- Demand for luxury TVs surging in the GCC, says Samsung
- Video call with a traditional healer? Once unthinkable, it’s now common in South Africa
- Intelligent Buildings To Smooth GCC’s Path To Net Zero