Lithuania Hams Market (2026-2032) | Analysis, Revenue, Forecast, Companies, Industry, Value, Share, Size, Growth, Segmentation, Trends & Outlook
Market Forecast By Type (Air Dried Cured Hams, Smoked Hams), By Applications (Supermarkets and Hypermarkets, Independent Retailers, Convenience Stores, Specialist Retailers, Online Retailers) And Competitive Landscape
| Product Code: ETC5827834 | Publication Date: Nov 2023 | Updated Date: Apr 2026 | Product Type: Market Research Report | |
| Publisher: 6Wresearch | Author: Ravi Bhandari | No. of Pages: 60 | No. of Figures: 30 | No. of Tables: 5 |
Lithuania Hams Market Size (2020-2030)
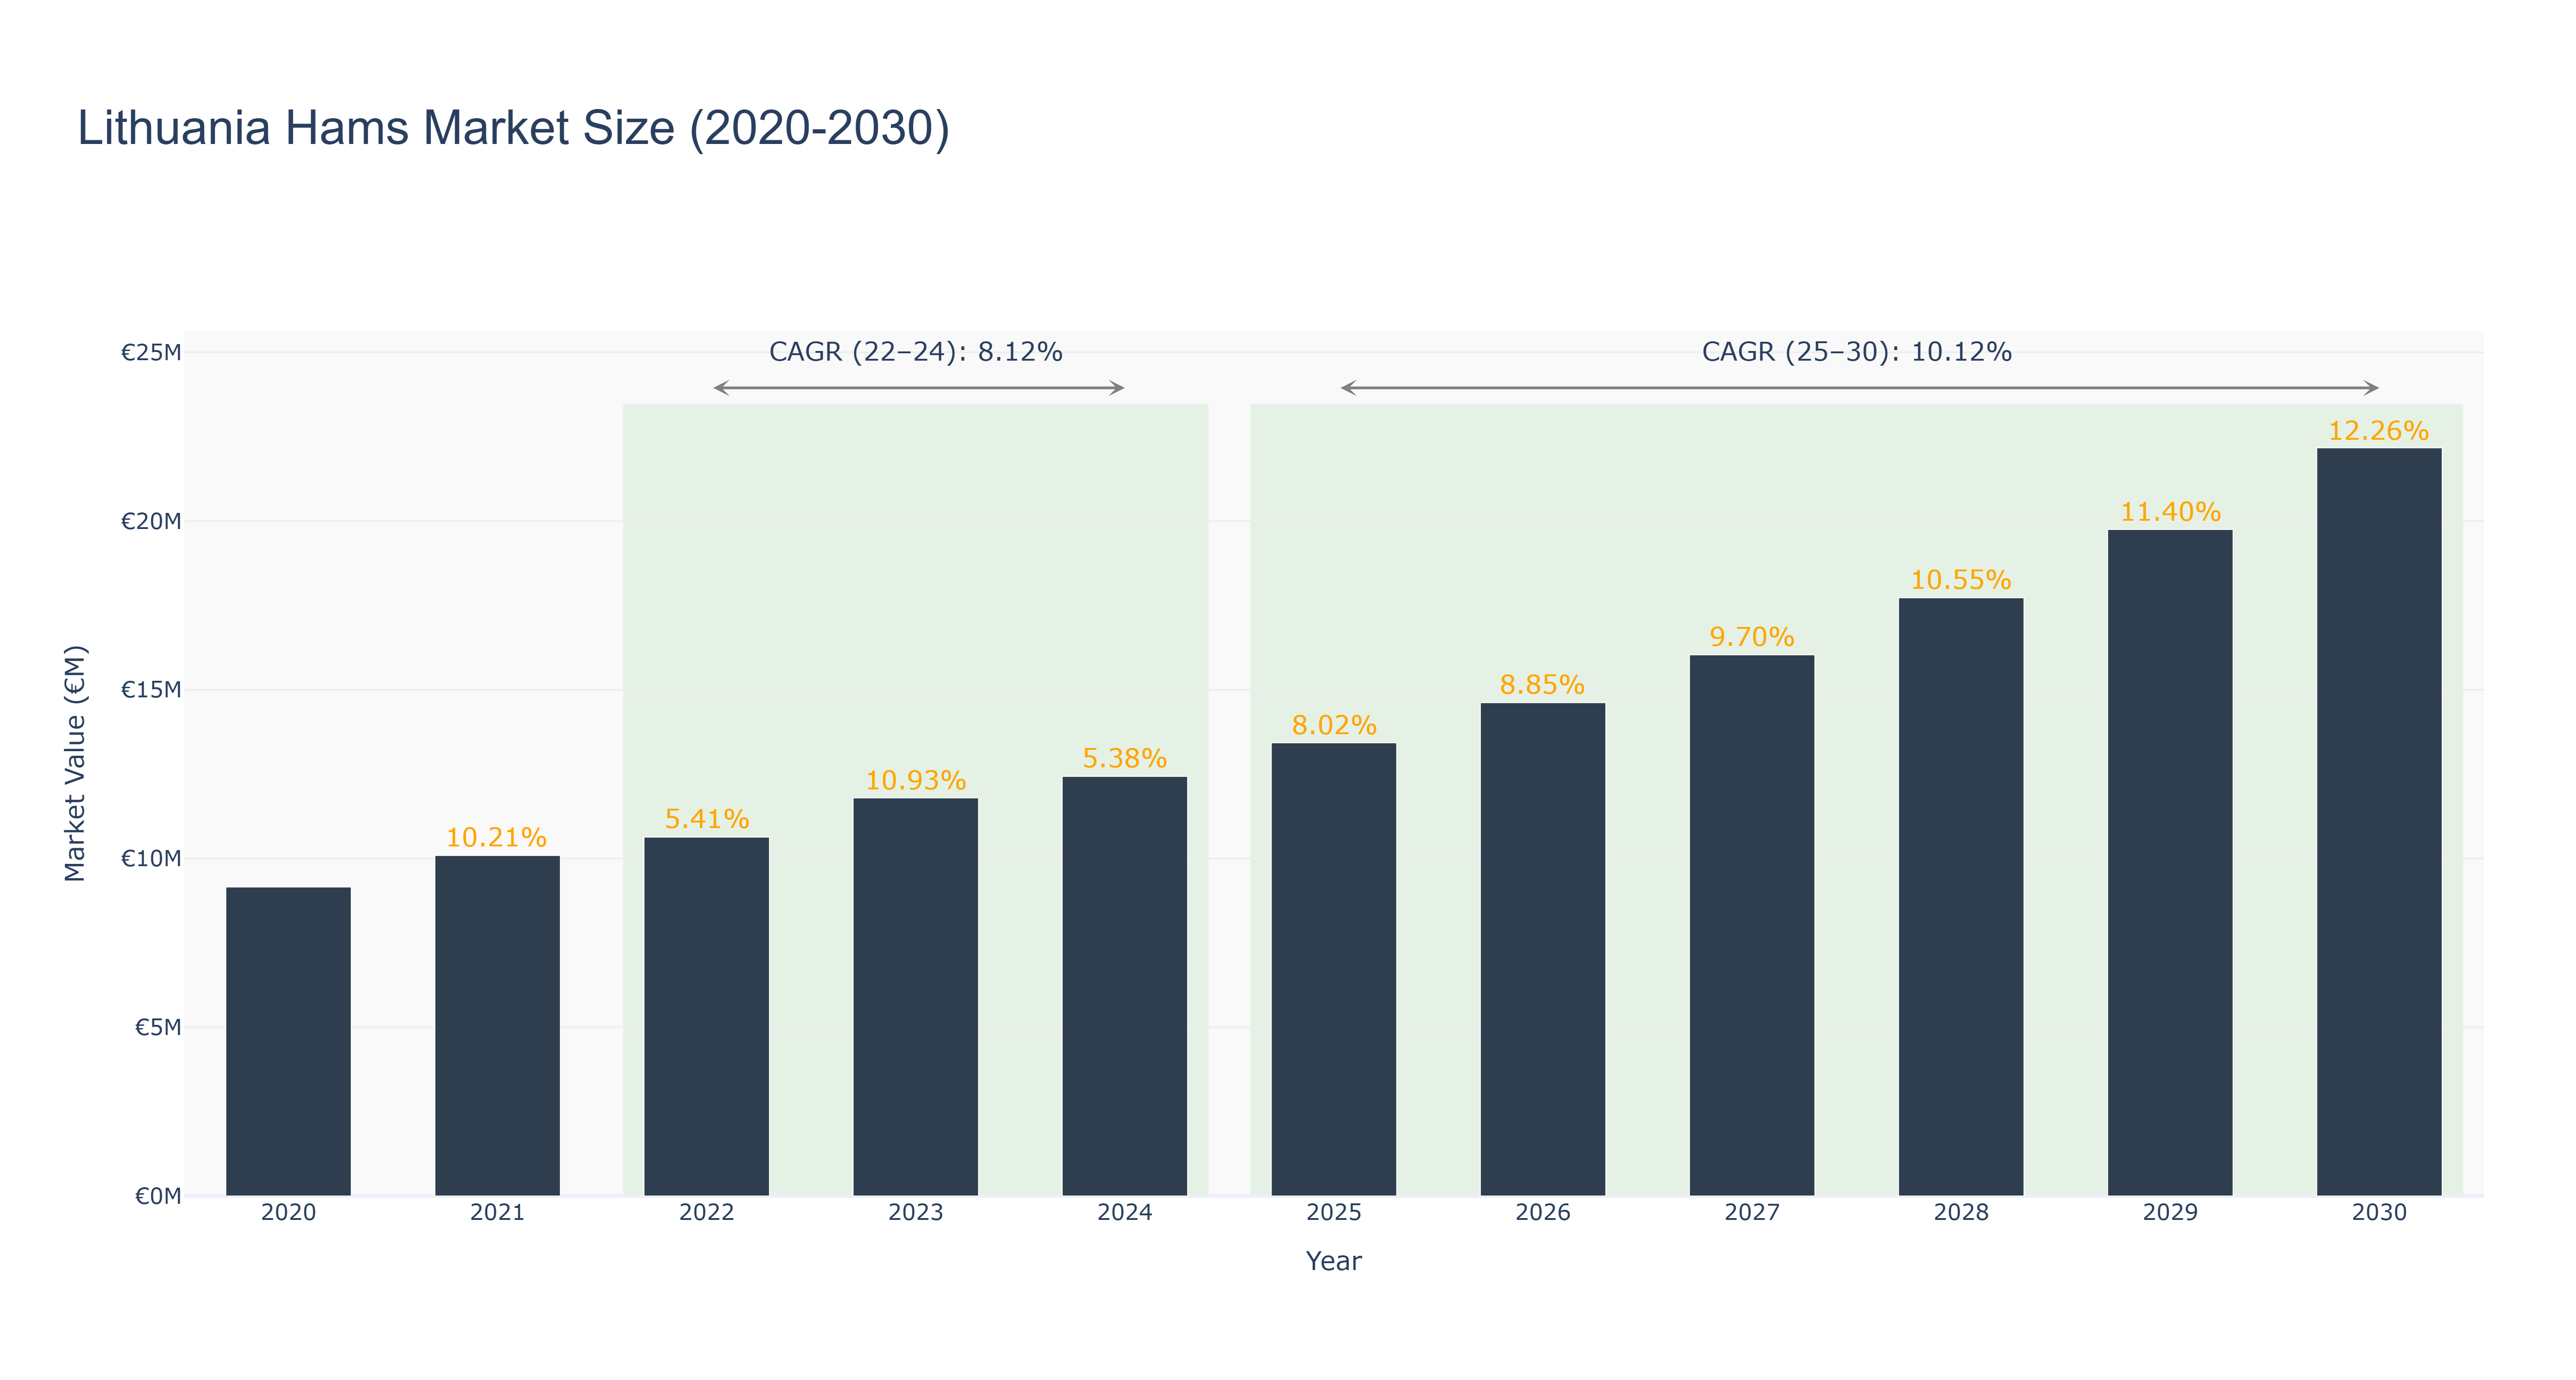
The Lithuania Hams Market has shown a steady growth trajectory over the years. The peak market size of €22.17 million is forecasted for 2030, with consistent growth rates. From 2020 to 2024, the market size increased from €9.16 million to €12.43 million, driven by increasing consumer demand and product innovation. Notable CAGR values include 8.12% for the period 2022-24 and 10.12% for 2025-30, indicating sustained growth potential. The market's growth can be attributed to factors such as changing consumer preferences towards premium food products and the rise in disposable income levels. Looking ahead, Lithuania's Hams Market is poised for further expansion with upcoming investments in modernizing production facilities and expanding distribution networks to cater to a wider audience. These developments are expected to enhance product quality and market reach, solidifying the market's position in the region.
Lithuania Hams Market: Production & Trade Performance (2019-2025)
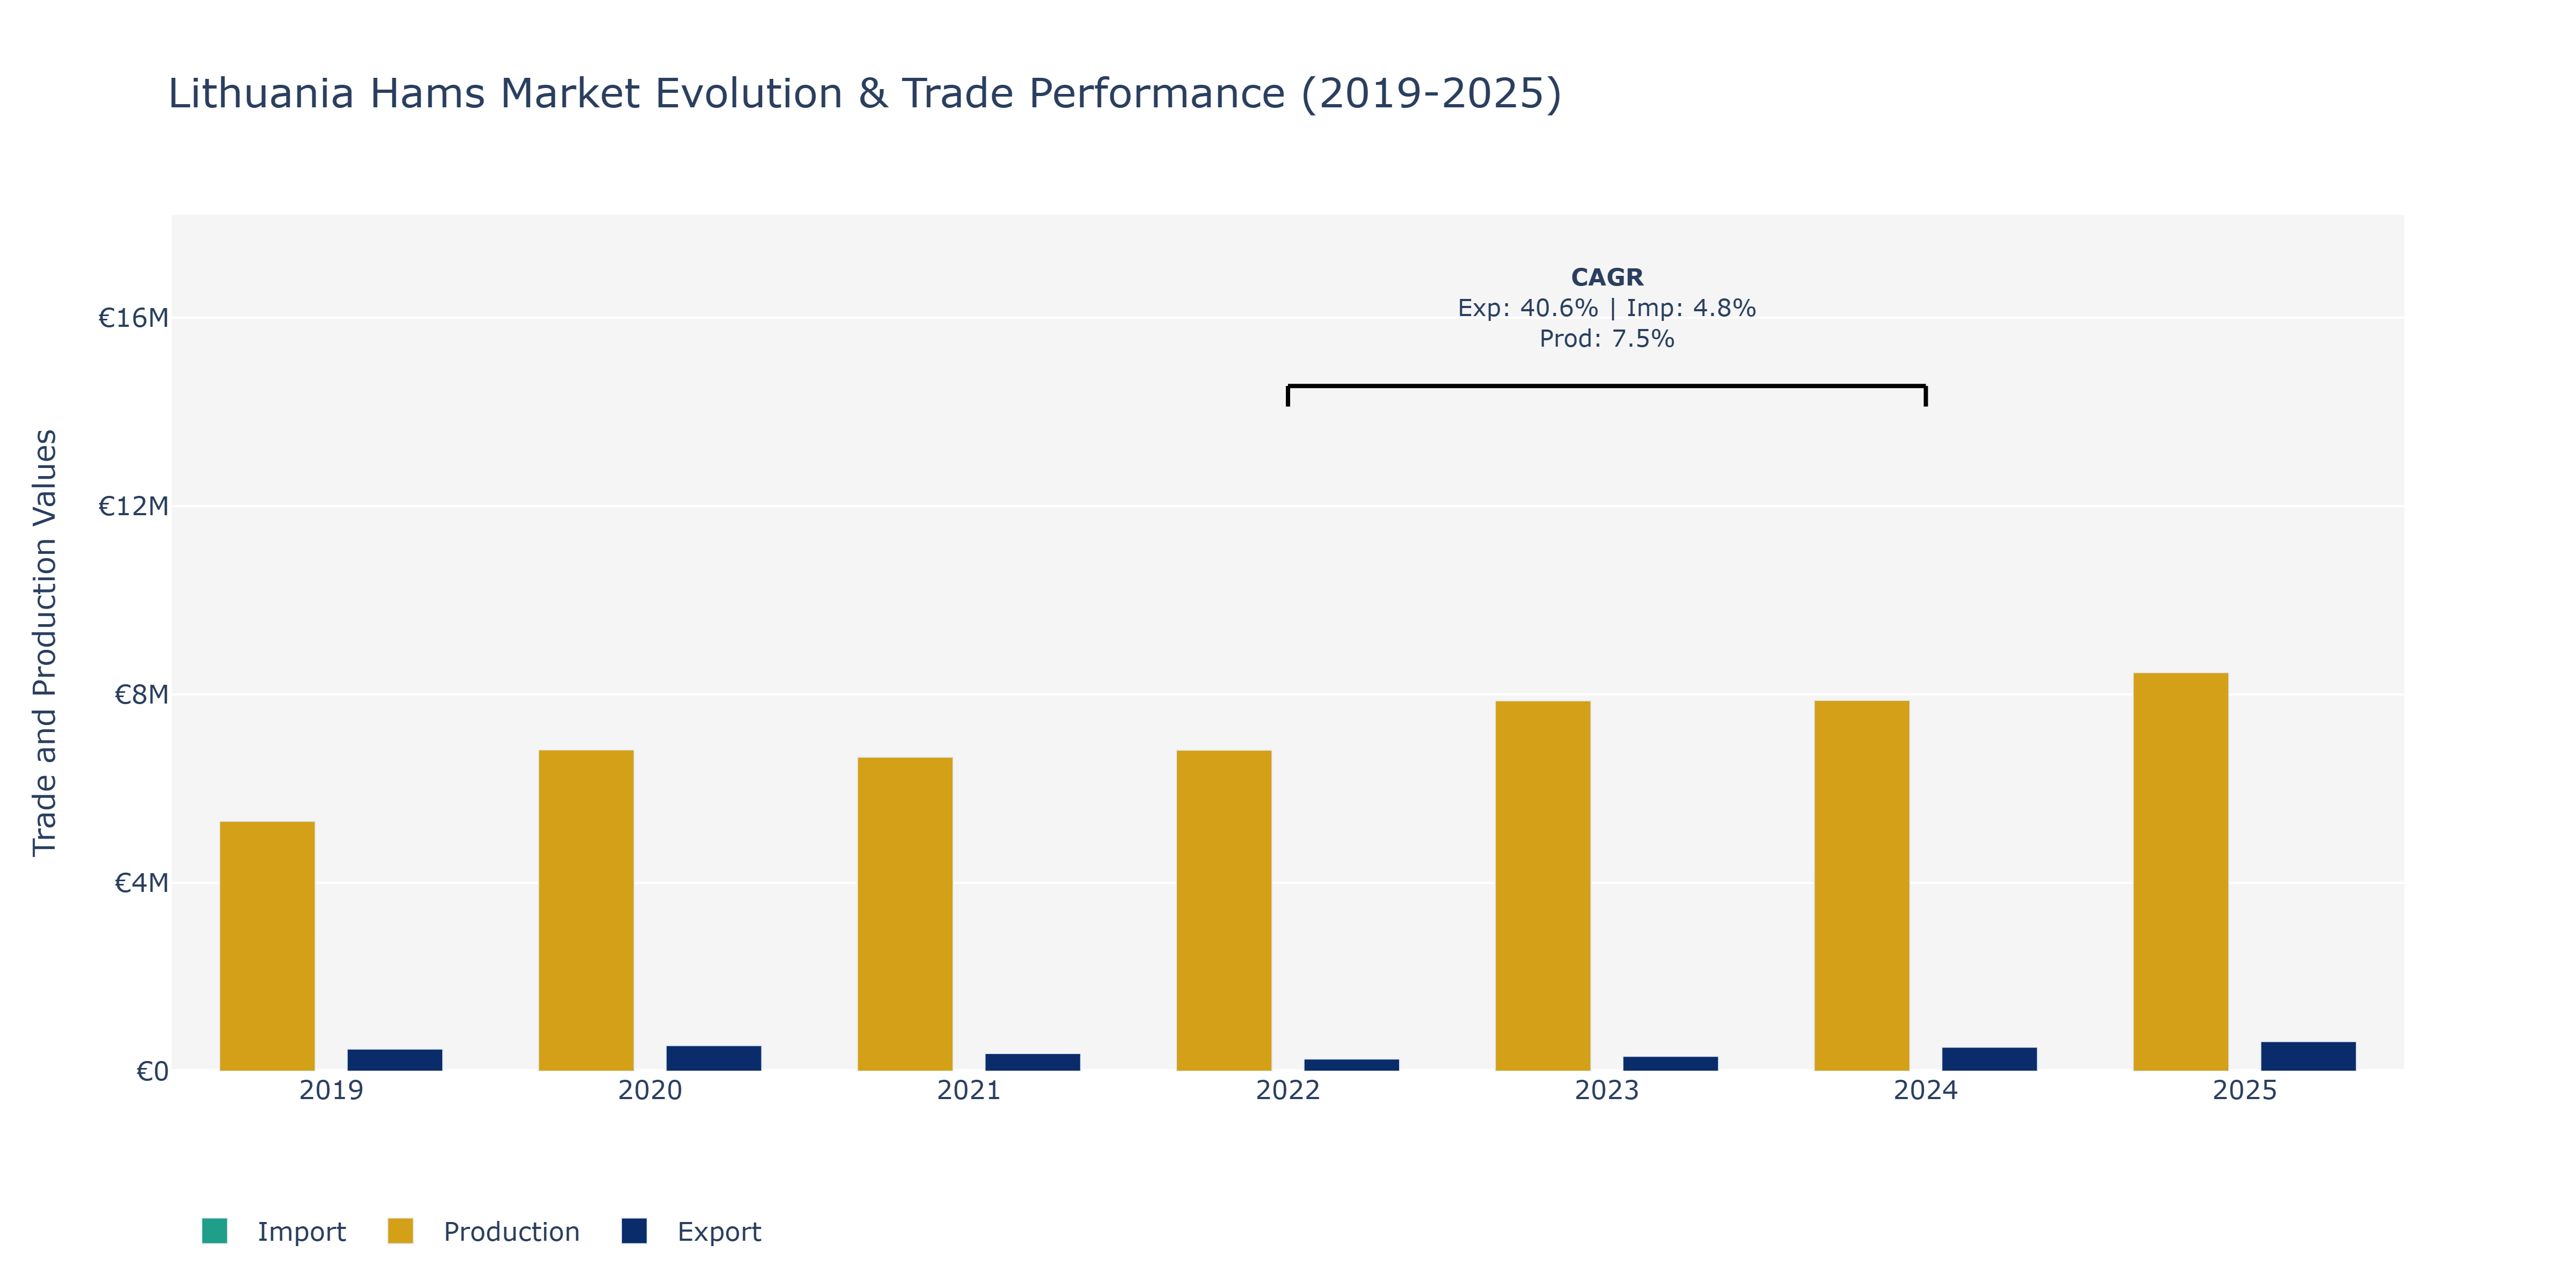
Between 2019 and 2025, Lithuania's Hams market saw fluctuations in Exports, Imports, and Production. Starting in 2019, Exports were at €469.62 thousand, experiencing a notable increase to €629.20 thousand by 2025, showcasing a steady upward trend over the years. Imports, on the other hand, began at €2.77 million in 2019, with a slight dip in 2022 before rising to €4.53 million in 2025. In contrast, Production value started at €5.31 million in 2019, reaching a peak of €8.46 million by 2025, showing consistent growth. The surge in Exports can be attributed to increasing demand for Lithuanian hams in international markets due to their quality and unique flavors. Rising Imports may be linked to technology upgrades and expanded distribution networks, allowing for more imports to meet domestic demand. The growing Production reflects investments in modernizing production facilities and processes, enhancing efficiency and output in the sector.
Key Highlights of the Report:
- Lithuania Hams Market Outlook
- Market Size of Lithuania Hams Market, 2025
- Forecast of Lithuania Hams Market, 2032
- Historical Data and Forecast of Lithuania Hams Revenues & Volume for the Period 2022 - 2032F
- Lithuania Hams Market Trend Evolution
- Lithuania Hams Market Drivers and Challenges
- Lithuania Hams Price Trends
- Lithuania Hams Porter`s Five Forces
- Lithuania Hams Industry Life Cycle
- Historical Data and Forecast of Lithuania Hams Market Revenues & Volume By Type for the Period 2022 - 2032F
- Historical Data and Forecast of Lithuania Hams Market Revenues & Volume By Air Dried Cured Hams for the Period 2022 - 2032F
- Historical Data and Forecast of Lithuania Hams Market Revenues & Volume By Smoked Hams for the Period 2022 - 2032F
- Historical Data and Forecast of Lithuania Hams Market Revenues & Volume By Applications for the Period 2022 - 2032F
- Historical Data and Forecast of Lithuania Hams Market Revenues & Volume By Supermarkets and Hypermarkets for the Period 2022 - 2032F
- Historical Data and Forecast of Lithuania Hams Market Revenues & Volume By Independent Retailers for the Period 2022 - 2032F
- Historical Data and Forecast of Lithuania Hams Market Revenues & Volume By Convenience Stores for the Period 2022 - 2032F
- Historical Data and Forecast of Lithuania Hams Market Revenues & Volume By Specialist Retailers for the Period 2022 - 2032F
- Historical Data and Forecast of Lithuania Hams Market Revenues & Volume By Online Retailers for the Period 2022 - 2032F
- Lithuania Hams Import Export Trade Statistics
- Market Opportunity Assessment By Type
- Market Opportunity Assessment By Applications
- Lithuania Hams Top Companies Market Share
- Lithuania Hams Competitive Benchmarking By Technical and Operational Parameters
- Lithuania Hams Company Profiles
- Lithuania Hams Key Strategic Recommendations
Frequently Asked Questions About the Market Study (FAQs):
6Wresearch actively monitors the Lithuania Hams Market and publishes its comprehensive annual report, highlighting emerging trends, growth drivers, revenue analysis, and forecast outlook. Our insights help businesses to make data-backed strategic decisions with ongoing market dynamics. Our analysts track relevent industries related to the Lithuania Hams Market, allowing our clients with actionable intelligence and reliable forecasts tailored to emerging regional needs.
Yes, we provide customisation as per your requirements. To learn more, feel free to contact us on sales@6wresearch.com
1 Executive Summary |
2 Introduction |
2.1 Key Highlights of the Report |
2.2 Report Description |
2.3 Market Scope & Segmentation |
2.4 Research Methodology |
2.5 Assumptions |
3 Lithuania Hams Market Overview |
3.1 Lithuania Country Macro Economic Indicators |
3.2 Lithuania Hams Market Revenues & Volume, 2022 & 2032F |
3.3 Lithuania Hams Market - Industry Life Cycle |
3.4 Lithuania Hams Market - Porter's Five Forces |
3.5 Lithuania Hams Market Revenues & Volume Share, By Type, 2022 & 2032F |
3.6 Lithuania Hams Market Revenues & Volume Share, By Applications, 2022 & 2032F |
4 Lithuania Hams Market Dynamics |
4.1 Impact Analysis |
4.2 Market Drivers |
4.2.1 Increasing consumer awareness about the health benefits of consuming high-quality hams |
4.2.2 Growing demand for premium and specialty hams in Lithuania |
4.2.3 Rising disposable income leading to higher spending on premium food products |
4.3 Market Restraints |
4.3.1 Fluctuating prices of raw materials impacting production costs |
4.3.2 Intense competition from other meat products in the market |
5 Lithuania Hams Market Trends |
6 Lithuania Hams Market Segmentations |
6.1 Lithuania Hams Market, By Type |
6.1.1 Overview and Analysis |
6.1.2 Lithuania Hams Market Revenues & Volume, By Air Dried Cured Hams, 2022 - 2032F |
6.1.3 Lithuania Hams Market Revenues & Volume, By Smoked Hams, 2022 - 2032F |
6.2 Lithuania Hams Market, By Applications |
6.2.1 Overview and Analysis |
6.2.2 Lithuania Hams Market Revenues & Volume, By Supermarkets and Hypermarkets, 2022 - 2032F |
6.2.3 Lithuania Hams Market Revenues & Volume, By Independent Retailers, 2022 - 2032F |
6.2.4 Lithuania Hams Market Revenues & Volume, By Convenience Stores, 2022 - 2032F |
6.2.5 Lithuania Hams Market Revenues & Volume, By Specialist Retailers, 2022 - 2032F |
6.2.6 Lithuania Hams Market Revenues & Volume, By Online Retailers, 2022 - 2032F |
7 Lithuania Hams Market Import-Export Trade Statistics |
7.1 Lithuania Hams Market Export to Major Countries |
7.2 Lithuania Hams Market Imports from Major Countries |
8 Lithuania Hams Market Key Performance Indicators |
8.1 Consumer satisfaction levels with the quality and taste of hams |
8.2 Number of new product introductions or innovations in the ham market |
8.3 Percentage of repeat customers purchasing hams regularly |
9 Lithuania Hams Market - Opportunity Assessment |
9.1 Lithuania Hams Market Opportunity Assessment, By Type, 2022 & 2032F |
9.2 Lithuania Hams Market Opportunity Assessment, By Applications, 2022 & 2032F |
10 Lithuania Hams Market - Competitive Landscape |
10.1 Lithuania Hams Market Revenue Share, By Companies, 2025 |
10.2 Lithuania Hams Market Competitive Benchmarking, By Operating and Technical Parameters |
11 Company Profiles |
12 Recommendations | 13 Disclaimer |
Global Go To Market Strategy - 2030
Export potential enables firms to identify high-growth global markets with greater confidence by combining advanced trade intelligence with a structured quantitative methodology. The framework analyzes emerging demand trends and country-level import patterns while integrating macroeconomic and trade datasets such as GDP and population forecasts, bilateral import–export flows, tariff structures, elasticity differentials between developed and developing economies, geographic distance, and import demand projections. Using weighted trade values from 2020–2024 as the base period to project country-to-country export potential for 2030, these inputs are operationalized through calculated drivers such as gravity model parameters, tariff impact factors, and projected GDP per-capita growth. Through an analysis of hidden potentials, demand hotspots, and market conditions that are most favorable to success, this method enables firms to focus on target countries, maximize returns, and global expansion with data, backed by accuracy.
By factoring in the projected importer demand gap that is currently unmet and could be potential opportunity, it identifies the potential for the Exporter (Country) among 190 countries, against the general trade analysis, which identifies the biggest importer or exporter.
To discover high-growth global markets and optimize your business strategy:
Click Here
Pricing
- Single User License$ 1,995
- Department License$ 2,400
- Site License$ 3,120
- Global License$ 3,795

Leadership Perspectives from Industry Events
Search
Thought Leadership and Analyst Meet


Our Clients
6WResearch In News
- Doha a strategic location for EV manufacturing hub: IPA Qatar
- Demand for luxury TVs surging in the GCC, says Samsung
- Empowering Growth: The Thriving Journey of Bangladesh’s Cable Industry
- Demand for luxury TVs surging in the GCC, says Samsung
- Video call with a traditional healer? Once unthinkable, it’s now common in South Africa
- Intelligent Buildings To Smooth GCC’s Path To Net Zero
Latest Reports
- New Zealand Aseptic Manufacturing Market (2026-2032)
- Netherlands Aseptic Manufacturing Market (2026-2032)
- Nauru Aseptic Manufacturing Market (2026-2032)
- Namibia Aseptic Manufacturing Market (2026-2032)
- Mozambique Aseptic Manufacturing Market (2026-2032)
- Montenegro Aseptic Manufacturing Market (2026-2032)
- Mongolia Aseptic Manufacturing Market (2026-2032)
- Monaco Aseptic Manufacturing Market (2026-2032)
- Micronesia Aseptic Manufacturing Market (2026-2032)
- Mauritius Aseptic Manufacturing Market (2026-2032)
Industry Events and Analyst Meet

HIMTEX 2026

India Refining Summit 2026

India EV Show 2026

EV tech India Expo 2026

Auto Tech Asia 2026
Whitepaper
- Middle East & Africa Commercial Security Market Click here to view more.
- Middle East & Africa Fire Safety Systems & Equipment Market Click here to view more.
- GCC Drone Market Click here to view more.
- Middle East Lighting Fixture Market Click here to view more.
- GCC Physical & Perimeter Security Market Click here to view more.