Lithuania Hot Chocolate Market (2026-2032) | Competitive, Forecast, Strategic Insights, Growth, Investment Trends, Outlook, Size, Drivers, Challenges, Segments, Strategy, Share, Segmentation, Supply, Demand, Competition, Trends, Revenue, Companies, Opportunities, Consumer Insights, Restraints, Analysis, Industry, Value, Pricing Analysis
Market Forecast By Product Type (Traditional Hot Chocolate, Instant Hot Chocolate Mix, Vegan Hot Chocolate, Functional Hot Chocolate), By Processing Type (Organic Cocoa Processing, Powdered Formulation, Dairy-free Alternatives, Nutrient-enriched Formulation), By End User (Cafs and Restaurants, Retail Consumers, Health-conscious Individuals, Fitness Enthusiasts), By Application (Beverage Industry, Home Consumption, Specialty Beverages, Wellness and Nutrition) And Competitive Landscape
| Product Code: ETC12332538 | Publication Date: Apr 2025 | Updated Date: Apr 2026 | Product Type: Market Research Report | |
| Publisher: 6Wresearch | Author: Sachin Kumar Rai | No. of Pages: 65 | No. of Figures: 34 | No. of Tables: 19 |
Lithuania Hot Chocolate Market Size (2020-2030)
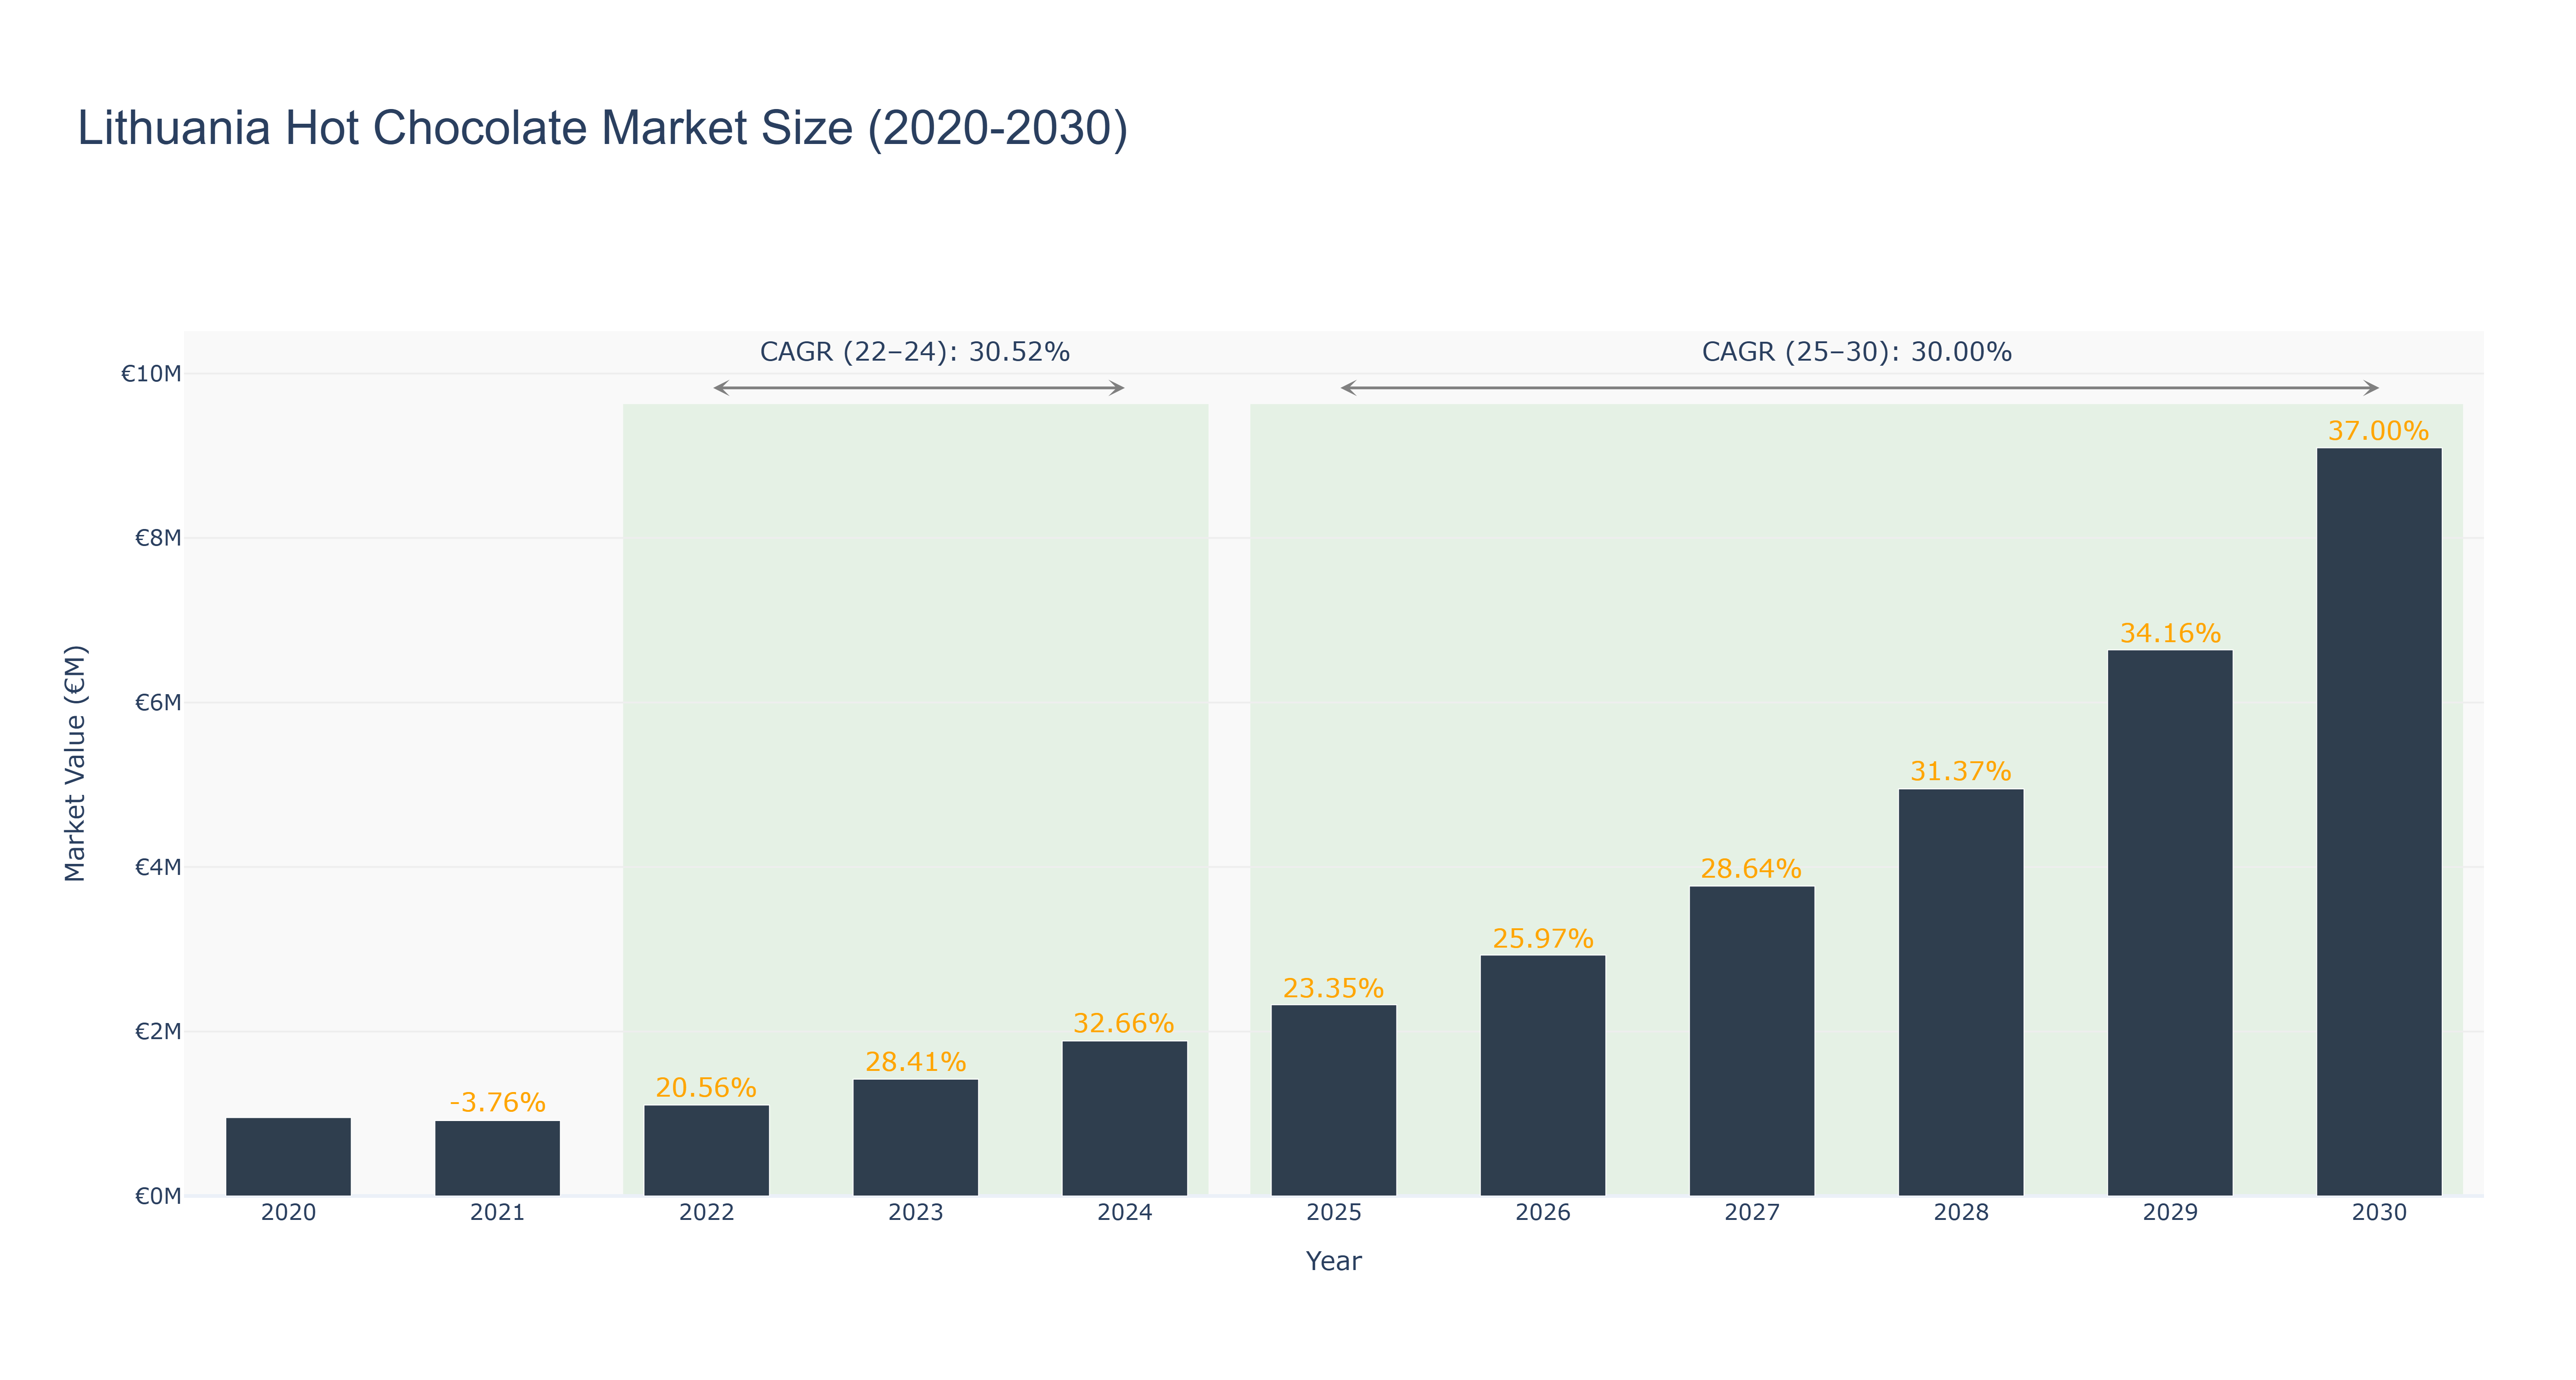
The Lithuania Hot Chocolate Market has shown a remarkable growth trajectory over the years. The peak market size of €9.10 million in 2030 is projected based on consistent annual growth rates. From 2020 to 2024, the market size increased steadily from €0.95 million to €1.88 million, driven by increasing consumer demand and product innovation. Subsequently, a forecasted growth from 2025 to 2030 is expected to reach €9.10 million, reflecting a strong CAGR of 30.0%. The market's robust performance can be attributed to factors such as shifting consumer preferences towards premium hot chocolate products and expanding distribution channels. Looking ahead, upcoming projects in the market include collaborations with local artisans to introduce unique flavor profiles and sustainable packaging initiatives to align with eco-conscious consumer trends.
Lithuania Hot Chocolate Market: Production & Trade Performance (2019-2025)
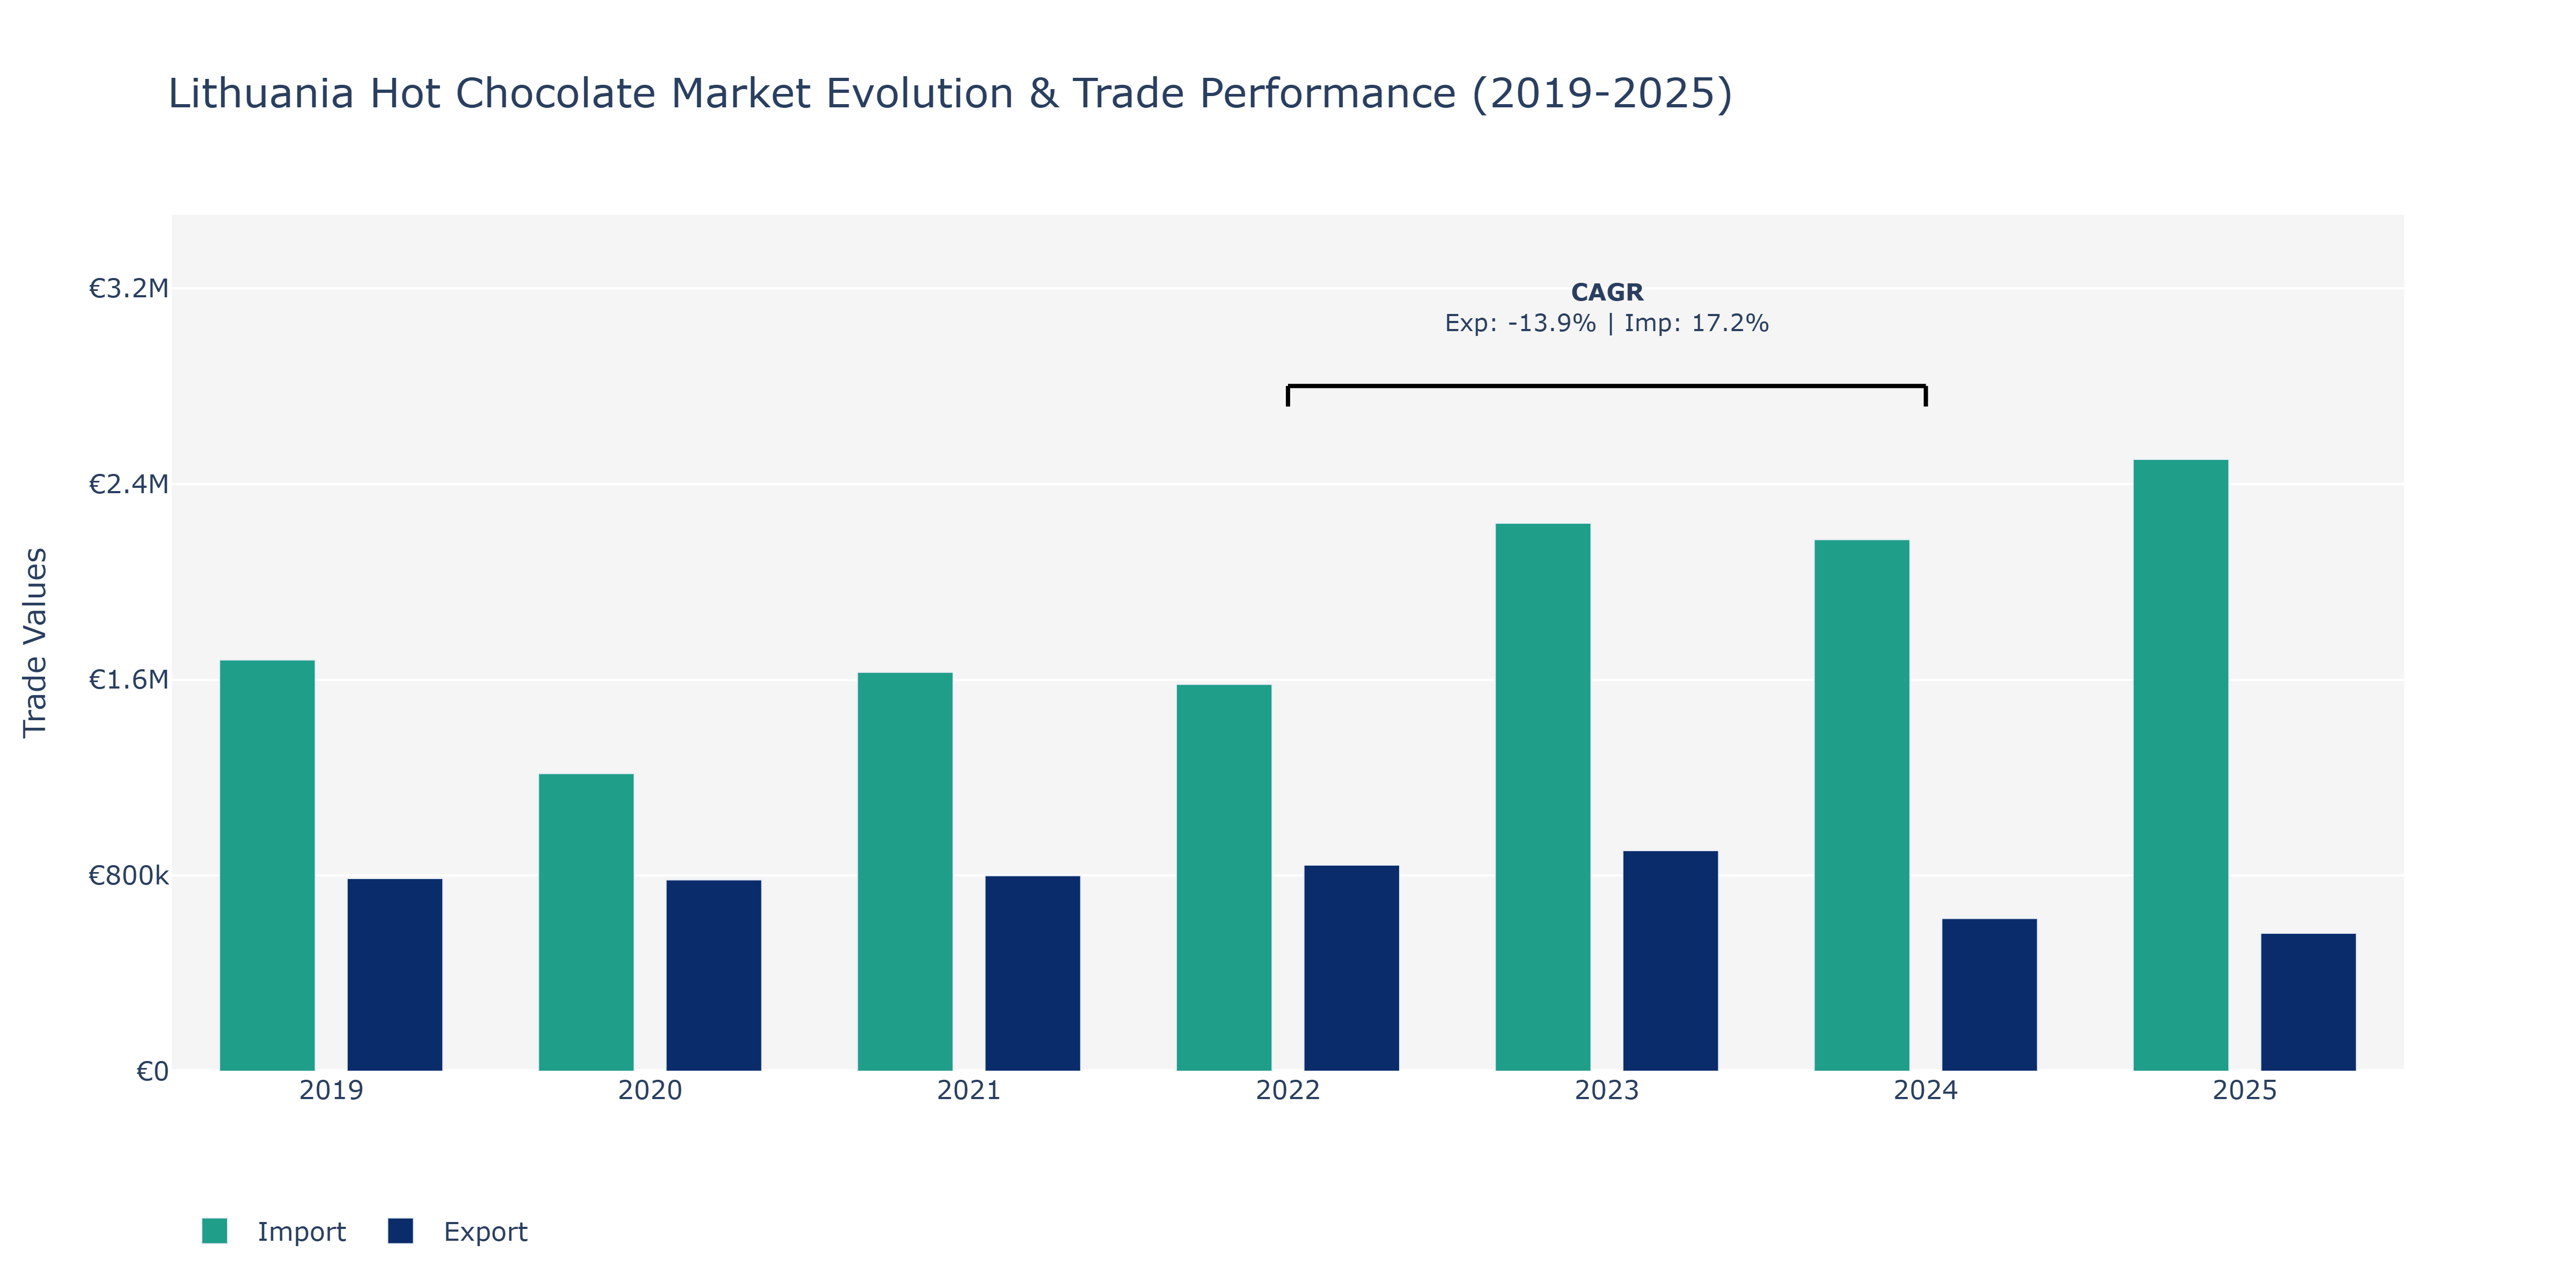
Between 2019 and 2025, Lithuania's Hot Chocolate Market witnessed fluctuations in both exports and imports. Exports started at €787.84 thousand in 2019, declined to €563.67 thousand in 2025, with a notable peak of €901.47 thousand in 2023. Imports, on the other hand, began at €1.68 million in 2019, increased to €2.5 million in 2025, with the highest value of €2.24 million recorded in 2023. The fluctuations in exports could be attributed to changing consumer preferences, market saturation, or international trade dynamics. Conversely, the growth in imports might be driven by demand for diverse products, raw material sourcing, or global market trends favoring imported goods. The significant surge in both exports and imports in 2023 could be related to economic factors, promotional activities, or shifts in supply chain strategies within the hot chocolate market.
Key Highlights of the Report:
- Lithuania Hot Chocolate Market Outlook
- Market Size of Lithuania Hot Chocolate Market, 2025
- Forecast of Lithuania Hot Chocolate Market, 2032
- Historical Data and Forecast of Lithuania Hot Chocolate Revenues & Volume for the Period 2022 - 2032F
- Lithuania Hot Chocolate Market Trend Evolution
- Lithuania Hot Chocolate Market Drivers and Challenges
- Lithuania Hot Chocolate Price Trends
- Lithuania Hot Chocolate Porter's Five Forces
- Lithuania Hot Chocolate Industry Life Cycle
- Historical Data and Forecast of Lithuania Hot Chocolate Market Revenues & Volume By Product Type for the Period 2022 - 2032F
- Historical Data and Forecast of Lithuania Hot Chocolate Market Revenues & Volume By Traditional Hot Chocolate for the Period 2022 - 2032F
- Historical Data and Forecast of Lithuania Hot Chocolate Market Revenues & Volume By Instant Hot Chocolate Mix for the Period 2022 - 2032F
- Historical Data and Forecast of Lithuania Hot Chocolate Market Revenues & Volume By Vegan Hot Chocolate for the Period 2022 - 2032F
- Historical Data and Forecast of Lithuania Hot Chocolate Market Revenues & Volume By Functional Hot Chocolate for the Period 2022 - 2032F
- Historical Data and Forecast of Lithuania Hot Chocolate Market Revenues & Volume By Processing Type for the Period 2022 - 2032F
- Historical Data and Forecast of Lithuania Hot Chocolate Market Revenues & Volume By Organic Cocoa Processing for the Period 2022 - 2032F
- Historical Data and Forecast of Lithuania Hot Chocolate Market Revenues & Volume By Powdered Formulation for the Period 2022 - 2032F
- Historical Data and Forecast of Lithuania Hot Chocolate Market Revenues & Volume By Dairy-free Alternatives for the Period 2022 - 2032F
- Historical Data and Forecast of Lithuania Hot Chocolate Market Revenues & Volume By Nutrient-enriched Formulation for the Period 2022 - 2032F
- Historical Data and Forecast of Lithuania Hot Chocolate Market Revenues & Volume By End User for the Period 2022 - 2032F
- Historical Data and Forecast of Lithuania Hot Chocolate Market Revenues & Volume By Cafs and Restaurants for the Period 2022 - 2032F
- Historical Data and Forecast of Lithuania Hot Chocolate Market Revenues & Volume By Retail Consumers for the Period 2022 - 2032F
- Historical Data and Forecast of Lithuania Hot Chocolate Market Revenues & Volume By Health-conscious Individuals for the Period 2022 - 2032F
- Historical Data and Forecast of Lithuania Hot Chocolate Market Revenues & Volume By Fitness Enthusiasts for the Period 2022 - 2032F
- Historical Data and Forecast of Lithuania Hot Chocolate Market Revenues & Volume By Application for the Period 2022 - 2032F
- Historical Data and Forecast of Lithuania Hot Chocolate Market Revenues & Volume By Beverage Industry for the Period 2022 - 2032F
- Historical Data and Forecast of Lithuania Hot Chocolate Market Revenues & Volume By Home Consumption for the Period 2022 - 2032F
- Historical Data and Forecast of Lithuania Hot Chocolate Market Revenues & Volume By Specialty Beverages for the Period 2022 - 2032F
- Historical Data and Forecast of Lithuania Hot Chocolate Market Revenues & Volume By Wellness and Nutrition for the Period 2022 - 2032F
- Lithuania Hot Chocolate Import Export Trade Statistics
- Market Opportunity Assessment By Product Type
- Market Opportunity Assessment By Processing Type
- Market Opportunity Assessment By End User
- Market Opportunity Assessment By Application
- Lithuania Hot Chocolate Top Companies Market Share
- Lithuania Hot Chocolate Competitive Benchmarking By Technical and Operational Parameters
- Lithuania Hot Chocolate Company Profiles
- Lithuania Hot Chocolate Key Strategic Recommendations
Frequently Asked Questions About the Market Study (FAQs):
6Wresearch actively monitors the Lithuania Hot Chocolate Market and publishes its comprehensive annual report, highlighting emerging trends, growth drivers, revenue analysis, and forecast outlook. Our insights help businesses to make data-backed strategic decisions with ongoing market dynamics. Our analysts track relevent industries related to the Lithuania Hot Chocolate Market, allowing our clients with actionable intelligence and reliable forecasts tailored to emerging regional needs.
Yes, we provide customisation as per your requirements. To learn more, feel free to contact us on sales@6wresearch.com
1 Executive Summary |
2 Introduction |
2.1 Key Highlights of the Report |
2.2 Report Description |
2.3 Market Scope & Segmentation |
2.4 Research Methodology |
2.5 Assumptions |
3 Lithuania Hot Chocolate Market Overview |
3.1 Lithuania Country Macro Economic Indicators |
3.2 Lithuania Hot Chocolate Market Revenues & Volume, 2022 & 2032F |
3.3 Lithuania Hot Chocolate Market - Industry Life Cycle |
3.4 Lithuania Hot Chocolate Market - Porter's Five Forces |
3.5 Lithuania Hot Chocolate Market Revenues & Volume Share, By Product Type, 2022 & 2032F |
3.6 Lithuania Hot Chocolate Market Revenues & Volume Share, By Processing Type, 2022 & 2032F |
3.7 Lithuania Hot Chocolate Market Revenues & Volume Share, By End User, 2022 & 2032F |
3.8 Lithuania Hot Chocolate Market Revenues & Volume Share, By Application, 2022 & 2032F |
4 Lithuania Hot Chocolate Market Dynamics |
4.1 Impact Analysis |
4.2 Market Drivers |
4.3 Market Restraints |
5 Lithuania Hot Chocolate Market Trends |
6 Lithuania Hot Chocolate Market, By Types |
6.1 Lithuania Hot Chocolate Market, By Product Type |
6.1.1 Overview and Analysis |
6.1.2 Lithuania Hot Chocolate Market Revenues & Volume, By Product Type, 2022 - 2032F |
6.1.3 Lithuania Hot Chocolate Market Revenues & Volume, By Traditional Hot Chocolate, 2022 - 2032F |
6.1.4 Lithuania Hot Chocolate Market Revenues & Volume, By Instant Hot Chocolate Mix, 2022 - 2032F |
6.1.5 Lithuania Hot Chocolate Market Revenues & Volume, By Vegan Hot Chocolate, 2022 - 2032F |
6.1.6 Lithuania Hot Chocolate Market Revenues & Volume, By Functional Hot Chocolate, 2022 - 2032F |
6.2 Lithuania Hot Chocolate Market, By Processing Type |
6.2.1 Overview and Analysis |
6.2.2 Lithuania Hot Chocolate Market Revenues & Volume, By Organic Cocoa Processing, 2022 - 2032F |
6.2.3 Lithuania Hot Chocolate Market Revenues & Volume, By Powdered Formulation, 2022 - 2032F |
6.2.4 Lithuania Hot Chocolate Market Revenues & Volume, By Dairy-free Alternatives, 2022 - 2032F |
6.2.5 Lithuania Hot Chocolate Market Revenues & Volume, By Nutrient-enriched Formulation, 2022 - 2032F |
6.3 Lithuania Hot Chocolate Market, By End User |
6.3.1 Overview and Analysis |
6.3.2 Lithuania Hot Chocolate Market Revenues & Volume, By Caf s and Restaurants, 2022 - 2032F |
6.3.3 Lithuania Hot Chocolate Market Revenues & Volume, By Retail Consumers, 2022 - 2032F |
6.3.4 Lithuania Hot Chocolate Market Revenues & Volume, By Health-conscious Individuals, 2022 - 2032F |
6.3.5 Lithuania Hot Chocolate Market Revenues & Volume, By Fitness Enthusiasts, 2022 - 2032F |
6.4 Lithuania Hot Chocolate Market, By Application |
6.4.1 Overview and Analysis |
6.4.2 Lithuania Hot Chocolate Market Revenues & Volume, By Beverage Industry, 2022 - 2032F |
6.4.3 Lithuania Hot Chocolate Market Revenues & Volume, By Home Consumption, 2022 - 2032F |
6.4.4 Lithuania Hot Chocolate Market Revenues & Volume, By Specialty Beverages, 2022 - 2032F |
6.4.5 Lithuania Hot Chocolate Market Revenues & Volume, By Wellness and Nutrition, 2022 - 2032F |
7 Lithuania Hot Chocolate Market Import-Export Trade Statistics |
7.1 Lithuania Hot Chocolate Market Export to Major Countries |
7.2 Lithuania Hot Chocolate Market Imports from Major Countries |
8 Lithuania Hot Chocolate Market Key Performance Indicators |
9 Lithuania Hot Chocolate Market - Opportunity Assessment |
9.1 Lithuania Hot Chocolate Market Opportunity Assessment, By Product Type, 2022 & 2032F |
9.2 Lithuania Hot Chocolate Market Opportunity Assessment, By Processing Type, 2022 & 2032F |
9.3 Lithuania Hot Chocolate Market Opportunity Assessment, By End User, 2022 & 2032F |
9.4 Lithuania Hot Chocolate Market Opportunity Assessment, By Application, 2022 & 2032F |
10 Lithuania Hot Chocolate Market - Competitive Landscape |
10.1 Lithuania Hot Chocolate Market Revenue Share, By Companies, 2025 |
10.2 Lithuania Hot Chocolate Market Competitive Benchmarking, By Operating and Technical Parameters |
11 Company Profiles |
12 Recommendations |
13 Disclaimer |
Global Go To Market Strategy - 2030
Export potential enables firms to identify high-growth global markets with greater confidence by combining advanced trade intelligence with a structured quantitative methodology. The framework analyzes emerging demand trends and country-level import patterns while integrating macroeconomic and trade datasets such as GDP and population forecasts, bilateral import–export flows, tariff structures, elasticity differentials between developed and developing economies, geographic distance, and import demand projections. Using weighted trade values from 2020–2024 as the base period to project country-to-country export potential for 2030, these inputs are operationalized through calculated drivers such as gravity model parameters, tariff impact factors, and projected GDP per-capita growth. Through an analysis of hidden potentials, demand hotspots, and market conditions that are most favorable to success, this method enables firms to focus on target countries, maximize returns, and global expansion with data, backed by accuracy.
By factoring in the projected importer demand gap that is currently unmet and could be potential opportunity, it identifies the potential for the Exporter (Country) among 190 countries, against the general trade analysis, which identifies the biggest importer or exporter.
To discover high-growth global markets and optimize your business strategy:
Click Here
Pricing
- Single User License$ 1,995
- Department License$ 2,400
- Site License$ 3,120
- Global License$ 3,795

Leadership Perspectives from Industry Events
Search
Thought Leadership and Analyst Meet


Our Clients
6WResearch In News
- Doha a strategic location for EV manufacturing hub: IPA Qatar
- Demand for luxury TVs surging in the GCC, says Samsung
- Empowering Growth: The Thriving Journey of Bangladesh’s Cable Industry
- Demand for luxury TVs surging in the GCC, says Samsung
- Video call with a traditional healer? Once unthinkable, it’s now common in South Africa
- Intelligent Buildings To Smooth GCC’s Path To Net Zero
Latest Reports
- Taiwan Airport Wireless Infrastructure Market (2026-2032)
- Vietnam Airport Wireless Infrastructure Market (2026-2032)
- Thailand Airport Wireless Infrastructure Market (2026-2032)
- South Korea Airport Wireless Infrastructure Market (2026-2032)
- Romania Airport Wireless Infrastructure Market (2026-2032)
- Qatar Airport Wireless Infrastructure Market (2026-2032)
- Philippines Airport Wireless Infrastructure Market (2026-2032)
- Japan Airport Wireless Infrastructure Market (2026-2032)
- Taiwan Airport Winter Services Market (2026-2032)
- Vietnam Airport Winter Services Market (2026-2032)
Industry Events and Analyst Meet

HIMTEX 2026

India Refining Summit 2026

India EV Show 2026

EV tech India Expo 2026

Auto Tech Asia 2026
Whitepaper
- Middle East & Africa Commercial Security Market Click here to view more.
- Middle East & Africa Fire Safety Systems & Equipment Market Click here to view more.
- GCC Drone Market Click here to view more.
- Middle East Lighting Fixture Market Click here to view more.
- GCC Physical & Perimeter Security Market Click here to view more.