Lithuania IGBT Market (2025-2031) | Growth, Analysis, Segments, Strategy, Revenue, Supply, Demand, Segmentation, Companies, Value, Restraints, Share, Forecast, Pricing Analysis, Investment Trends, Opportunities, Outlook, Drivers, Trends, Competitive, Consumer Insights, Competition, Strategic Insights, Challenges, Size, Industry
Market Forecast By IGBT Type (Discrete IGBT, IGBT Module, Soft Punch-Through IGBTs, Field-Stop IGBTs, Reverse Conducting IGBTs), By Application (Automotive Power Systems, Consumer Electronics, Wind & Solar Energy Systems, Railway Traction, Aerospace & Defense), By Voltage Class (Low Voltage, Medium Voltage, High Voltage, Ultra-High Voltage, Very High Voltage), By Sales Channel (Direct Sales, Distributors, Online Retail, Bulk Procurement, Retail Stores), By End User (Automotive, Power Grids, Industrial Automation, Data Centers, Telecom & IT) And Competitive Landscape
| Product Code: ETC12460794 | Publication Date: Apr 2025 | Updated Date: Apr 2026 | Product Type: Market Research Report | |
| Publisher: 6Wresearch | No. of Pages: 65 | No. of Figures: 34 | No. of Tables: 19 | |
Lithuania Igbt Market Size (2020-2030)
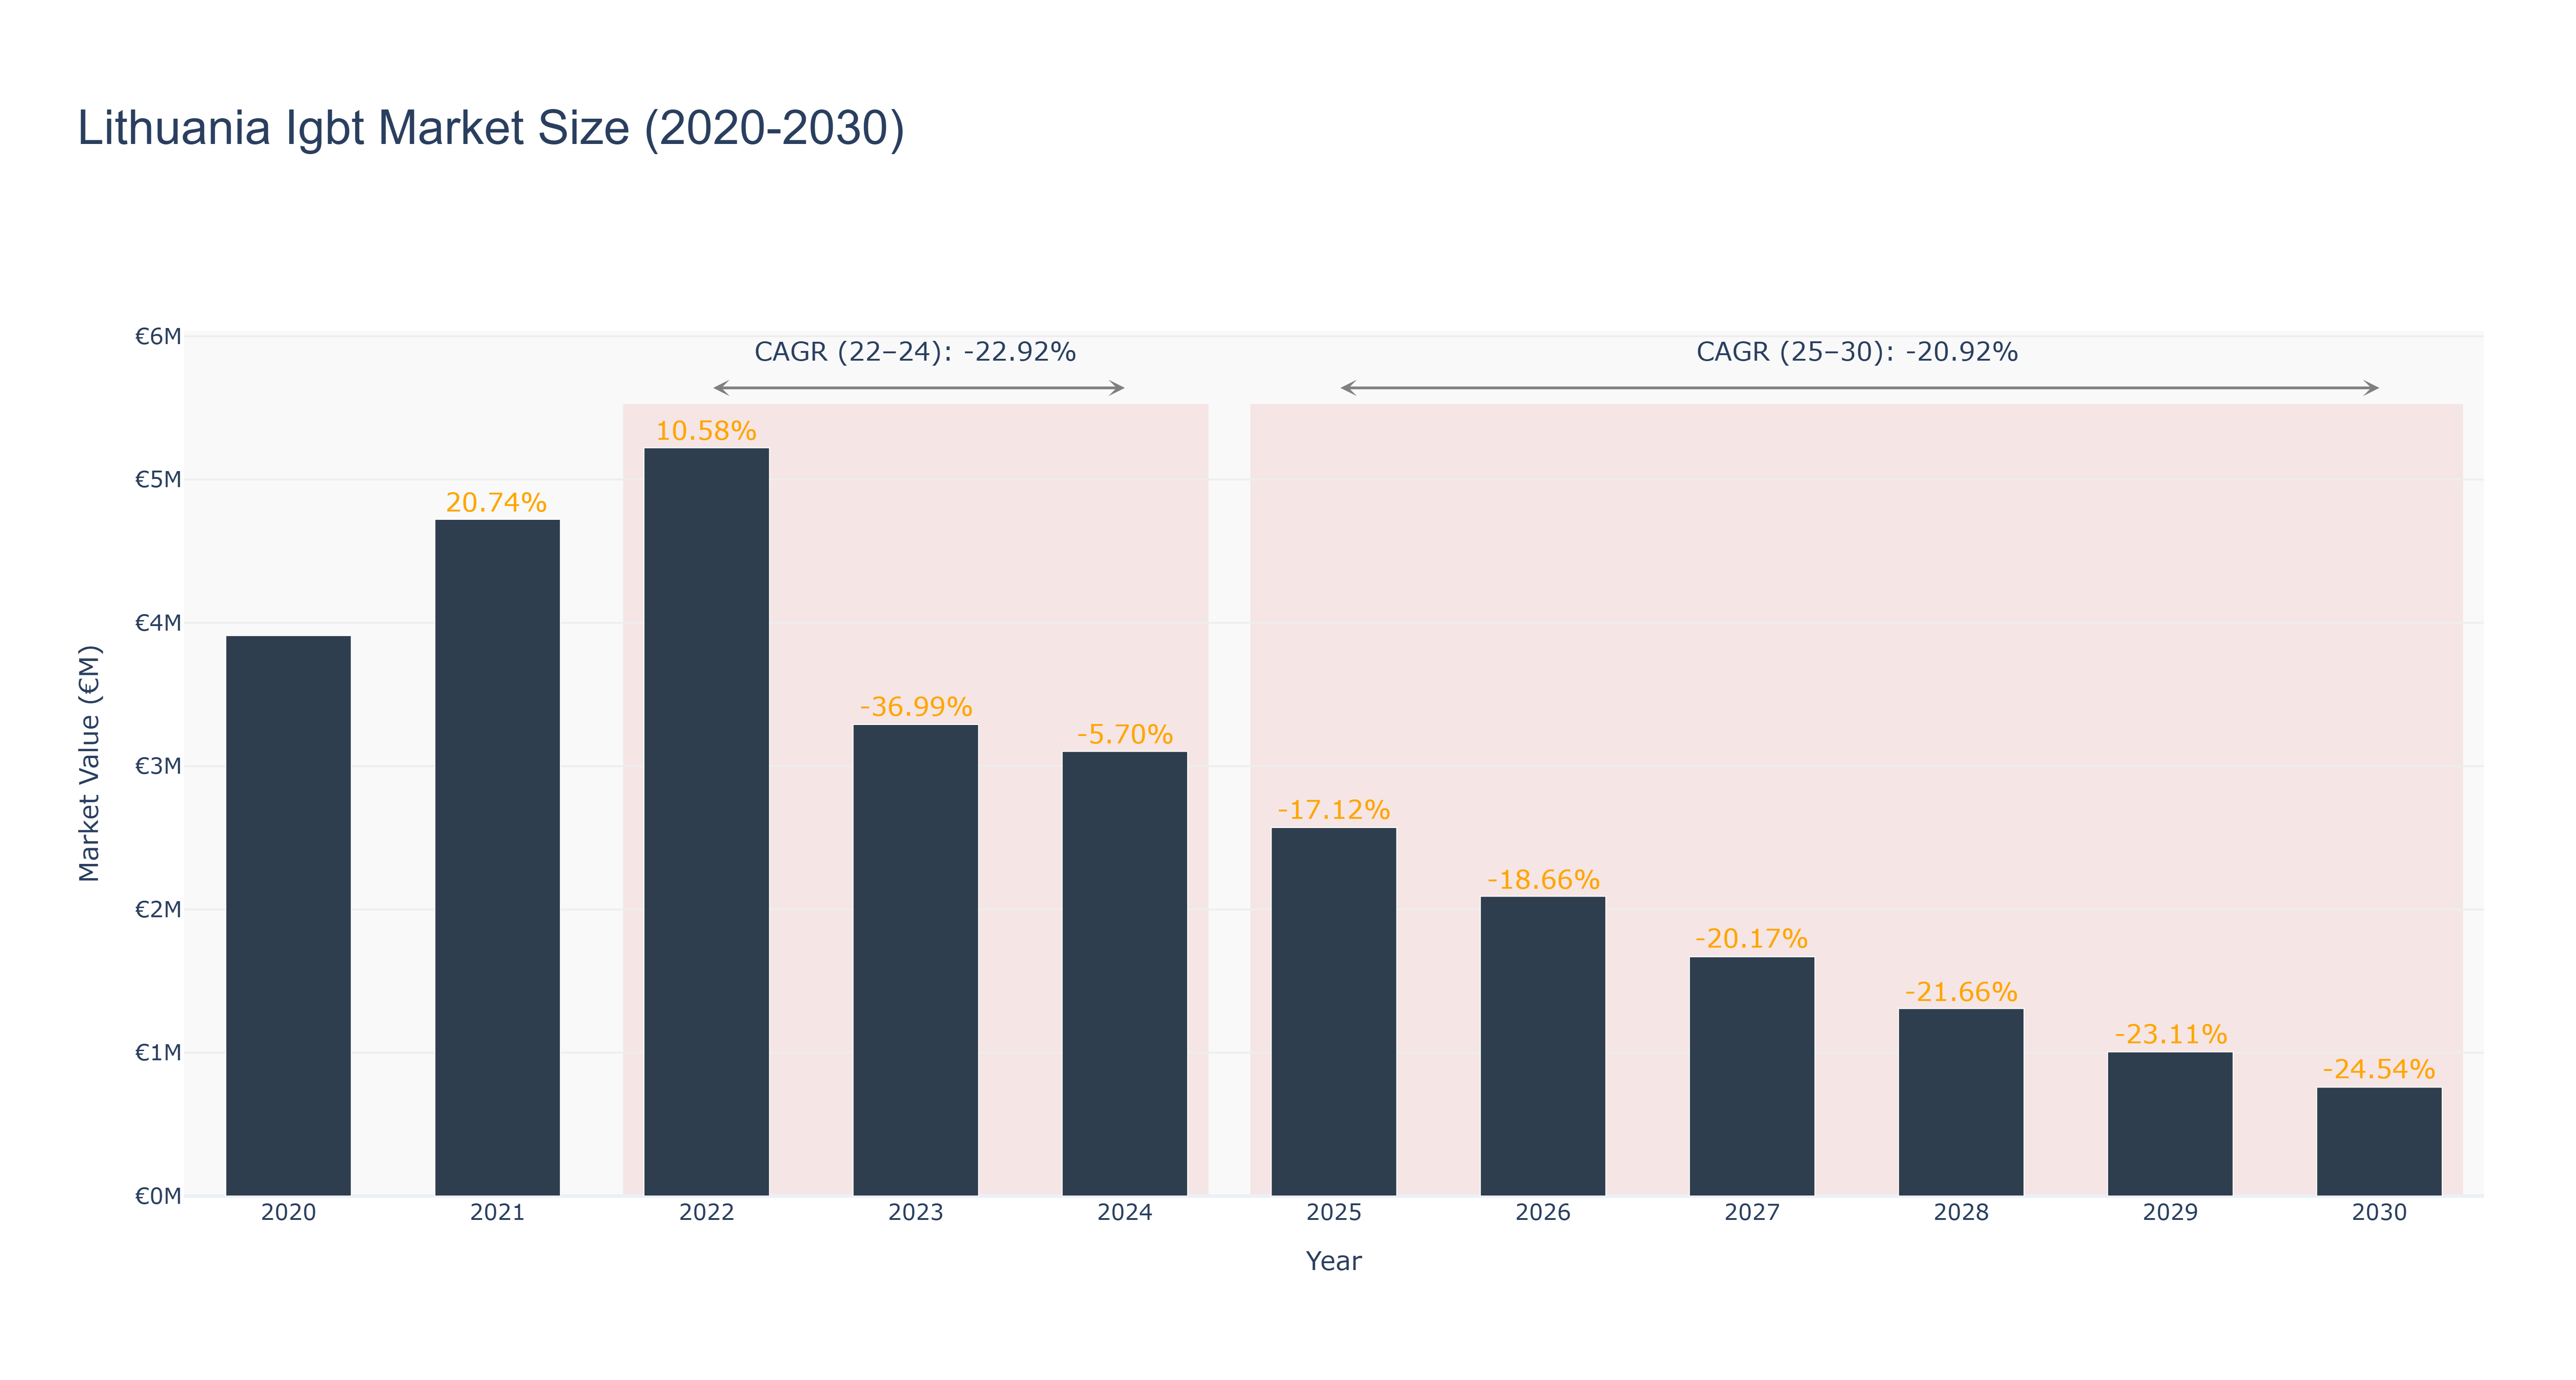
Lithuania Igbt Market has seen a significant decline in market size over the years. The peak market size of €5.22 million was recorded in 2022, followed by a downward trend to €0.76 million in 2030. The market experienced a sharp decrease from 2022 to 2024, with a CAGR of -22.92%, and is forecasted to continue declining with a CAGR of -20.92% from 2025 to 2030. The market downturn can be attributed to various factors such as technological advancements leading to decreased demand, economic uncertainties, and evolving consumer preferences. Despite the challenging market conditions, Lithuania is set to invest in renewable energy projects to boost the energy sector and potentially revitalize the Igbt market in the near future. Industry drivers for the Lithuania Igbt Market include increasing focus on energy efficiency, growing adoption of electric vehicles, and advancements in industrial automation technologies. Looking ahead, Lithuania's focus on renewable energy projects and sustainable initiatives will likely drive opportunities for growth and innovation in the Igbt market.
Lithuania Igbt Market: Production & Trade Performance (2019-2025)
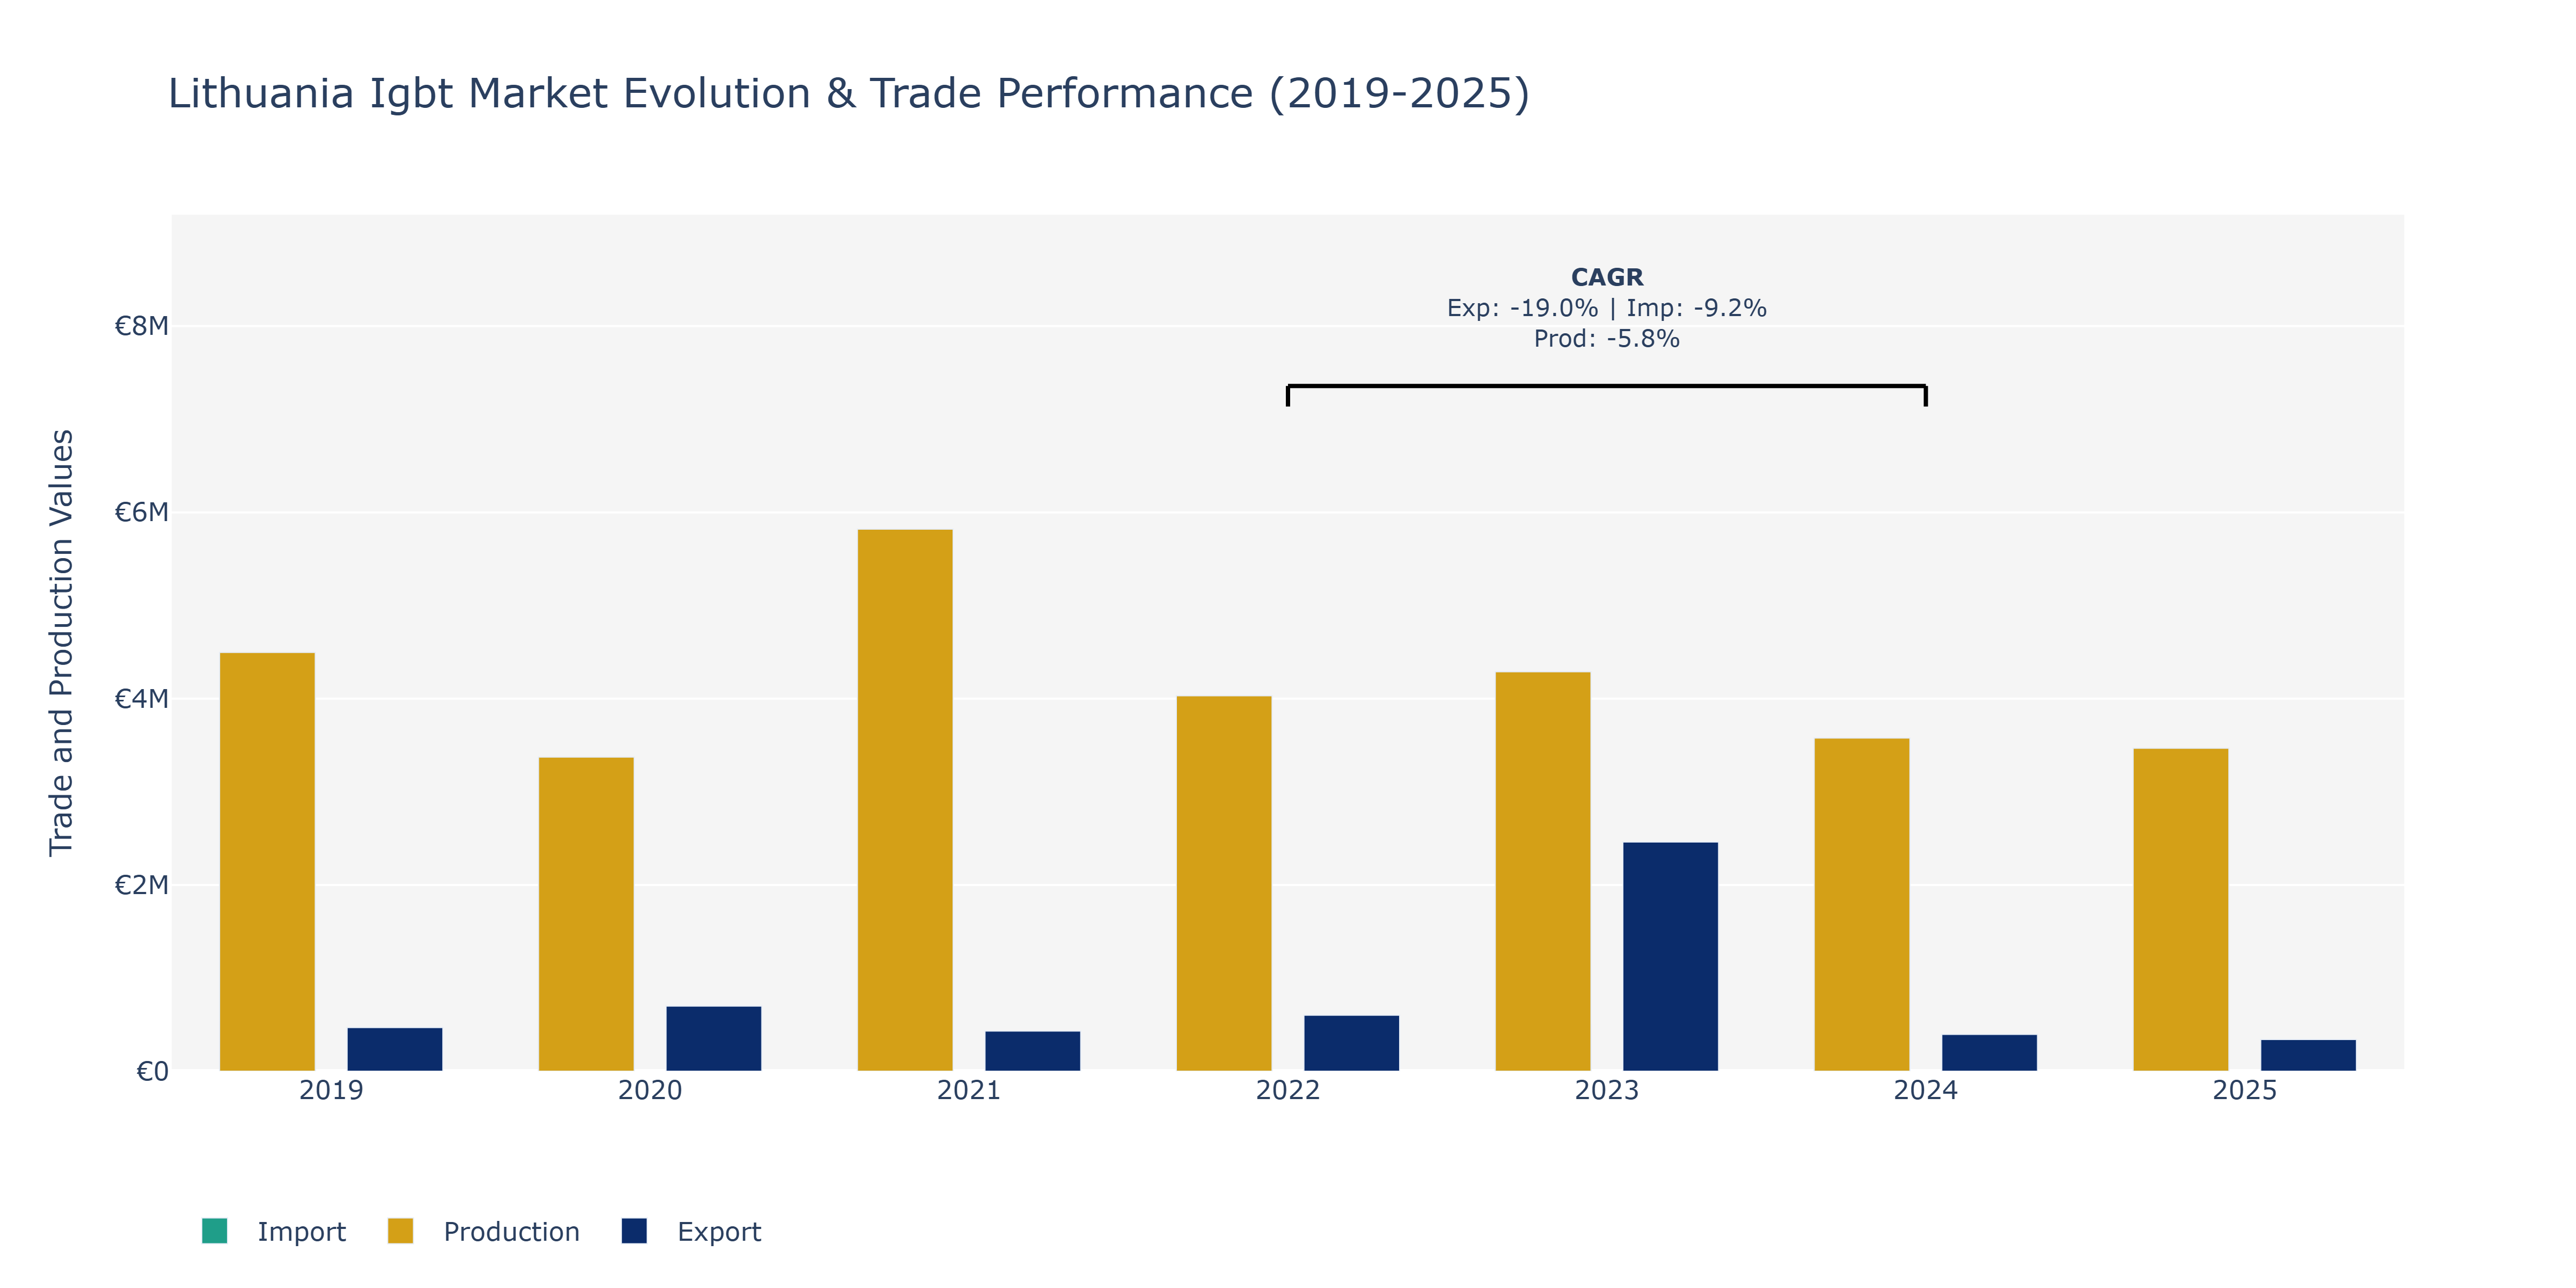
In the Lithuania IGBT market, exports witnessed fluctuations over the years, starting at €468.33 thousand in 2019, reaching a peak of €2.46 million in 2023, and then declining to €339.59 thousand in 2025. Imports, on the other hand, saw a peak in 2021 at €749.71 thousand, while Production value fluctuated from €4.49 billion in 2019 to a low of €3.46 billion in 2025. The market experienced a notable decline in exports from 2022 to 2025, possibly influenced by global economic conditions affecting demand for IGBT products. The decrease in production from 2019 to 2025 could be attributed to technological advancements leading to more efficient manufacturing processes, impacting the overall output levels. Import fluctuations might be linked to shifts in international trade agreements and supply chain disruptions. To remain competitive, companies in the Lithuania IGBT market may need to focus on innovation and cost-efficiency in production processes, aligning with the broader industry shift towards sustainability and digitalization.
Key Highlights of the Report:
- Lithuania IGBT Market Outlook
- Market Size of Lithuania IGBT Market,2024
- Forecast of Lithuania IGBT Market, 2031
- Historical Data and Forecast of Lithuania IGBT Revenues & Volume for the Period 2021-2031
- Lithuania IGBT Market Trend Evolution
- Lithuania IGBT Market Drivers and Challenges
- Lithuania IGBT Price Trends
- Lithuania IGBT Porter's Five Forces
- Lithuania IGBT Industry Life Cycle
- Historical Data and Forecast of Lithuania IGBT Market Revenues & Volume By IGBT Type for the Period 2021-2031
- Historical Data and Forecast of Lithuania IGBT Market Revenues & Volume By Discrete IGBT for the Period 2021-2031
- Historical Data and Forecast of Lithuania IGBT Market Revenues & Volume By IGBT Module for the Period 2021-2031
- Historical Data and Forecast of Lithuania IGBT Market Revenues & Volume By Soft Punch-Through IGBTs for the Period 2021-2031
- Historical Data and Forecast of Lithuania IGBT Market Revenues & Volume By Field-Stop IGBTs for the Period 2021-2031
- Historical Data and Forecast of Lithuania IGBT Market Revenues & Volume By Reverse Conducting IGBTs for the Period 2021 - 2029
- Historical Data and Forecast of Lithuania IGBT Market Revenues & Volume By Application for the Period 2021-2031
- Historical Data and Forecast of Lithuania IGBT Market Revenues & Volume By Automotive Power Systems for the Period 2021-2031
- Historical Data and Forecast of Lithuania IGBT Market Revenues & Volume By Consumer Electronics for the Period 2021-2031
- Historical Data and Forecast of Lithuania IGBT Market Revenues & Volume By Wind & Solar Energy Systems for the Period 2021-2031
- Historical Data and Forecast of Lithuania IGBT Market Revenues & Volume By Railway Traction for the Period 2021-2031
- Historical Data and Forecast of Lithuania IGBT Market Revenues & Volume By Aerospace & Defense for the Period 2021 - 2029
- Historical Data and Forecast of Lithuania IGBT Market Revenues & Volume By Voltage Class for the Period 2021-2031
- Historical Data and Forecast of Lithuania IGBT Market Revenues & Volume By Low Voltage for the Period 2021-2031
- Historical Data and Forecast of Lithuania IGBT Market Revenues & Volume By Medium Voltage for the Period 2021-2031
- Historical Data and Forecast of Lithuania IGBT Market Revenues & Volume By High Voltage for the Period 2021-2031
- Historical Data and Forecast of Lithuania IGBT Market Revenues & Volume By Ultra-High Voltage for the Period 2021-2031
- Historical Data and Forecast of Lithuania IGBT Market Revenues & Volume By Very High Voltage for the Period 2021 - 2029
- Historical Data and Forecast of Lithuania IGBT Market Revenues & Volume By Sales Channel for the Period 2021-2031
- Historical Data and Forecast of Lithuania IGBT Market Revenues & Volume By Direct Sales for the Period 2021-2031
- Historical Data and Forecast of Lithuania IGBT Market Revenues & Volume By Distributors for the Period 2021-2031
- Historical Data and Forecast of Lithuania IGBT Market Revenues & Volume By Online Retail for the Period 2021-2031
- Historical Data and Forecast of Lithuania IGBT Market Revenues & Volume By Bulk Procurement for the Period 2021-2031
- Historical Data and Forecast of Lithuania IGBT Market Revenues & Volume By Retail Stores for the Period 2021 - 2029
- Historical Data and Forecast of Lithuania IGBT Market Revenues & Volume By End User for the Period 2021-2031
- Historical Data and Forecast of Lithuania IGBT Market Revenues & Volume By Automotive for the Period 2021-2031
- Historical Data and Forecast of Lithuania IGBT Market Revenues & Volume By Power Grids for the Period 2021-2031
- Historical Data and Forecast of Lithuania IGBT Market Revenues & Volume By Industrial Automation for the Period 2021-2031
- Historical Data and Forecast of Lithuania IGBT Market Revenues & Volume By Data Centers for the Period 2021 - 2029
- Historical Data and Forecast of Lithuania IGBT Market Revenues & Volume By Telecom & IT for the Period 2021 - 2029
- Lithuania IGBT Import Export Trade Statistics
- Market Opportunity Assessment By IGBT Type
- Market Opportunity Assessment By Application
- Market Opportunity Assessment By Voltage Class
- Market Opportunity Assessment By Sales Channel
- Market Opportunity Assessment By End User
- Lithuania IGBT Top Companies Market Share
- Lithuania IGBT Competitive Benchmarking By Technical and Operational Parameters
- Lithuania IGBT Company Profiles
- Lithuania IGBT Key Strategic Recommendations
Frequently Asked Questions About the Market Study (FAQs):
6Wresearch actively monitors the Lithuania IGBT Market and publishes its comprehensive annual report, highlighting emerging trends, growth drivers, revenue analysis, and forecast outlook. Our insights help businesses to make data-backed strategic decisions with ongoing market dynamics. Our analysts track relevent industries related to the Lithuania IGBT Market, allowing our clients with actionable intelligence and reliable forecasts tailored to emerging regional needs.
Yes, we provide customisation as per your requirements. To learn more, feel free to contact us on sales@6wresearch.com
1 Executive Summary |
2 Introduction |
2.1 Key Highlights of the Report |
2.2 Report Description |
2.3 Market Scope & Segmentation |
2.4 Research Methodology |
2.5 Assumptions |
3 Lithuania IGBT Market Overview |
3.1 Lithuania Country Macro Economic Indicators |
3.2 Lithuania IGBT Market Revenues & Volume, 2021 & 2031F |
3.3 Lithuania IGBT Market - Industry Life Cycle |
3.4 Lithuania IGBT Market - Porter's Five Forces |
3.5 Lithuania IGBT Market Revenues & Volume Share, By IGBT Type, 2021 & 2031F |
3.6 Lithuania IGBT Market Revenues & Volume Share, By Application, 2021 & 2031F |
3.7 Lithuania IGBT Market Revenues & Volume Share, By Voltage Class, 2021 & 2031F |
3.8 Lithuania IGBT Market Revenues & Volume Share, By Sales Channel, 2021 & 2031F |
3.9 Lithuania IGBT Market Revenues & Volume Share, By End User, 2021 & 2031F |
4 Lithuania IGBT Market Dynamics |
4.1 Impact Analysis |
4.2 Market Drivers |
4.2.1 Increasing demand for energy-efficient solutions in various industries |
4.2.2 Growing adoption of renewable energy sources in Lithuania |
4.2.3 Favorable government initiatives and regulations promoting the use of IGBT technology |
4.3 Market Restraints |
4.3.1 High initial investment cost associated with IGBT technology |
4.3.2 Technological challenges and complexities in IGBT manufacturing |
4.3.3 Competition from other power semiconductor devices in the market |
5 Lithuania IGBT Market Trends |
6 Lithuania IGBT Market, By Types |
6.1 Lithuania IGBT Market, By IGBT Type |
6.1.1 Overview and Analysis |
6.1.2 Lithuania IGBT Market Revenues & Volume, By IGBT Type, 2021 - 2031F |
6.1.3 Lithuania IGBT Market Revenues & Volume, By Discrete IGBT, 2021 - 2031F |
6.1.4 Lithuania IGBT Market Revenues & Volume, By IGBT Module, 2021 - 2031F |
6.1.5 Lithuania IGBT Market Revenues & Volume, By Soft Punch-Through IGBTs, 2021 - 2031F |
6.1.6 Lithuania IGBT Market Revenues & Volume, By Field-Stop IGBTs, 2021 - 2031F |
6.1.7 Lithuania IGBT Market Revenues & Volume, By Reverse Conducting IGBTs, 2021 - 2031F |
6.2 Lithuania IGBT Market, By Application |
6.2.1 Overview and Analysis |
6.2.2 Lithuania IGBT Market Revenues & Volume, By Automotive Power Systems, 2021 - 2031F |
6.2.3 Lithuania IGBT Market Revenues & Volume, By Consumer Electronics, 2021 - 2031F |
6.2.4 Lithuania IGBT Market Revenues & Volume, By Wind & Solar Energy Systems, 2021 - 2031F |
6.2.5 Lithuania IGBT Market Revenues & Volume, By Railway Traction, 2021 - 2031F |
6.2.6 Lithuania IGBT Market Revenues & Volume, By Aerospace & Defense, 2021 - 2031F |
6.3 Lithuania IGBT Market, By Voltage Class |
6.3.1 Overview and Analysis |
6.3.2 Lithuania IGBT Market Revenues & Volume, By Low Voltage, 2021 - 2031F |
6.3.3 Lithuania IGBT Market Revenues & Volume, By Medium Voltage, 2021 - 2031F |
6.3.4 Lithuania IGBT Market Revenues & Volume, By High Voltage, 2021 - 2031F |
6.3.5 Lithuania IGBT Market Revenues & Volume, By Ultra-High Voltage, 2021 - 2031F |
6.3.6 Lithuania IGBT Market Revenues & Volume, By Very High Voltage, 2021 - 2031F |
6.4 Lithuania IGBT Market, By Sales Channel |
6.4.1 Overview and Analysis |
6.4.2 Lithuania IGBT Market Revenues & Volume, By Direct Sales, 2021 - 2031F |
6.4.3 Lithuania IGBT Market Revenues & Volume, By Distributors, 2021 - 2031F |
6.4.4 Lithuania IGBT Market Revenues & Volume, By Online Retail, 2021 - 2031F |
6.4.5 Lithuania IGBT Market Revenues & Volume, By Bulk Procurement, 2021 - 2031F |
6.4.6 Lithuania IGBT Market Revenues & Volume, By Retail Stores, 2021 - 2031F |
6.5 Lithuania IGBT Market, By End User |
6.5.1 Overview and Analysis |
6.5.2 Lithuania IGBT Market Revenues & Volume, By Automotive, 2021 - 2031F |
6.5.3 Lithuania IGBT Market Revenues & Volume, By Power Grids, 2021 - 2031F |
6.5.4 Lithuania IGBT Market Revenues & Volume, By Industrial Automation, 2021 - 2031F |
6.5.5 Lithuania IGBT Market Revenues & Volume, By Data Centers, 2021 - 2031F |
6.5.6 Lithuania IGBT Market Revenues & Volume, By Telecom & IT, 2021 - 2031F |
7 Lithuania IGBT Market Import-Export Trade Statistics |
7.1 Lithuania IGBT Market Export to Major Countries |
7.2 Lithuania IGBT Market Imports from Major Countries |
8 Lithuania IGBT Market Key Performance Indicators |
8.1 Average efficiency improvement rate of IGBT technology |
8.2 Percentage increase in the number of renewable energy projects using IGBTs |
8.3 Adoption rate of IGBT technology in key industries in Lithuania |
9 Lithuania IGBT Market - Opportunity Assessment |
9.1 Lithuania IGBT Market Opportunity Assessment, By IGBT Type, 2021 & 2031F |
9.2 Lithuania IGBT Market Opportunity Assessment, By Application, 2021 & 2031F |
9.3 Lithuania IGBT Market Opportunity Assessment, By Voltage Class, 2021 & 2031F |
9.4 Lithuania IGBT Market Opportunity Assessment, By Sales Channel, 2021 & 2031F |
9.5 Lithuania IGBT Market Opportunity Assessment, By End User, 2021 & 2031F |
10 Lithuania IGBT Market - Competitive Landscape |
10.1 Lithuania IGBT Market Revenue Share, By Companies, 2024 |
10.2 Lithuania IGBT Market Competitive Benchmarking, By Operating and Technical Parameters |
11 Company Profiles |
12 Recommendations |
13 Disclaimer |
Global Go To Market Strategy - 2030
Export potential enables firms to identify high-growth global markets with greater confidence by combining advanced trade intelligence with a structured quantitative methodology. The framework analyzes emerging demand trends and country-level import patterns while integrating macroeconomic and trade datasets such as GDP and population forecasts, bilateral import–export flows, tariff structures, elasticity differentials between developed and developing economies, geographic distance, and import demand projections. Using weighted trade values from 2020–2024 as the base period to project country-to-country export potential for 2030, these inputs are operationalized through calculated drivers such as gravity model parameters, tariff impact factors, and projected GDP per-capita growth. Through an analysis of hidden potentials, demand hotspots, and market conditions that are most favorable to success, this method enables firms to focus on target countries, maximize returns, and global expansion with data, backed by accuracy.
By factoring in the projected importer demand gap that is currently unmet and could be potential opportunity, it identifies the potential for the Exporter (Country) among 190 countries, against the general trade analysis, which identifies the biggest importer or exporter.
To discover high-growth global markets and optimize your business strategy:
Click Here
Pricing
- Single User License$ 1,995
- Department License$ 2,400
- Site License$ 3,120
- Global License$ 3,795

Leadership Perspectives from Industry Events
Search
Thought Leadership and Analyst Meet


Our Clients
6WResearch In News
- Doha a strategic location for EV manufacturing hub: IPA Qatar
- Demand for luxury TVs surging in the GCC, says Samsung
- Empowering Growth: The Thriving Journey of Bangladesh’s Cable Industry
- Demand for luxury TVs surging in the GCC, says Samsung
- Video call with a traditional healer? Once unthinkable, it’s now common in South Africa
- Intelligent Buildings To Smooth GCC’s Path To Net Zero
Latest Reports
- Cape Verde Portable Hand-Thrown Extinguisher Market (2026-2032)
- Canada Portable Hand-Thrown Extinguisher Market (2026-2032)
- Cameroon Portable Hand-Thrown Extinguisher Market (2026-2032)
- Burundi Portable Hand-Thrown Extinguisher Market (2026-2032)
- Burkina Faso Portable Hand-Thrown Extinguisher Market (2026-2032)
- Bulgaria Portable Hand-Thrown Extinguisher Market (2026-2032)
- Brunei Portable Hand-Thrown Extinguisher Market (2026-2032)
- Botswana Portable Hand-Thrown Extinguisher Market (2026-2032)
- Bosnia and Herzegovina Portable Hand-Thrown Extinguisher Market (2026-2032)
- Bolivia Portable Hand-Thrown Extinguisher Market (2026-2032)
Industry Events and Analyst Meet

HIMTEX 2026

India Refining Summit 2026

India EV Show 2026

EV tech India Expo 2026

Auto Tech Asia 2026
Whitepaper
- Middle East & Africa Commercial Security Market Click here to view more.
- Middle East & Africa Fire Safety Systems & Equipment Market Click here to view more.
- GCC Drone Market Click here to view more.
- Middle East Lighting Fixture Market Click here to view more.
- GCC Physical & Perimeter Security Market Click here to view more.