Lithuania Industrial Drum Market (2026-2032) | Strategy, Segments, Share, Forecast, Industry, Challenges, Pricing Analysis, Revenue, Growth, Consumer Insights, Trends, Segmentation, Size, Supply, Value, Opportunities, Investment Trends, Restraints, Strategic Insights, Drivers, Competition, Outlook, Companies, Analysis, Demand, Competitive
Market Forecast By Drum Type (Open Head Drums, Tight Head Drums, Fiber Drums, Composite Drums), By Material Type (Steel, Plastic, Fiberboard, Hybrid Materials), By Application (Chemical Storage, Hazardous Waste Disposal, Industrial Lubricants, Paints & Coatings), By End User (Oil & Gas, Food & Beverage, Pharmaceuticals, Construction), By Capacity (Small (‰50L), Medium (50-200L), Large (>200L), Extra-Large (>500L)) And Competitive Landscape
| Product Code: ETC12481146 | Publication Date: Apr 2025 | Updated Date: Apr 2026 | Product Type: Market Research Report | |
| Publisher: 6Wresearch | No. of Pages: 65 | No. of Figures: 34 | No. of Tables: 19 | |
Lithuania Industrial Drum Market Size (2020-2030)
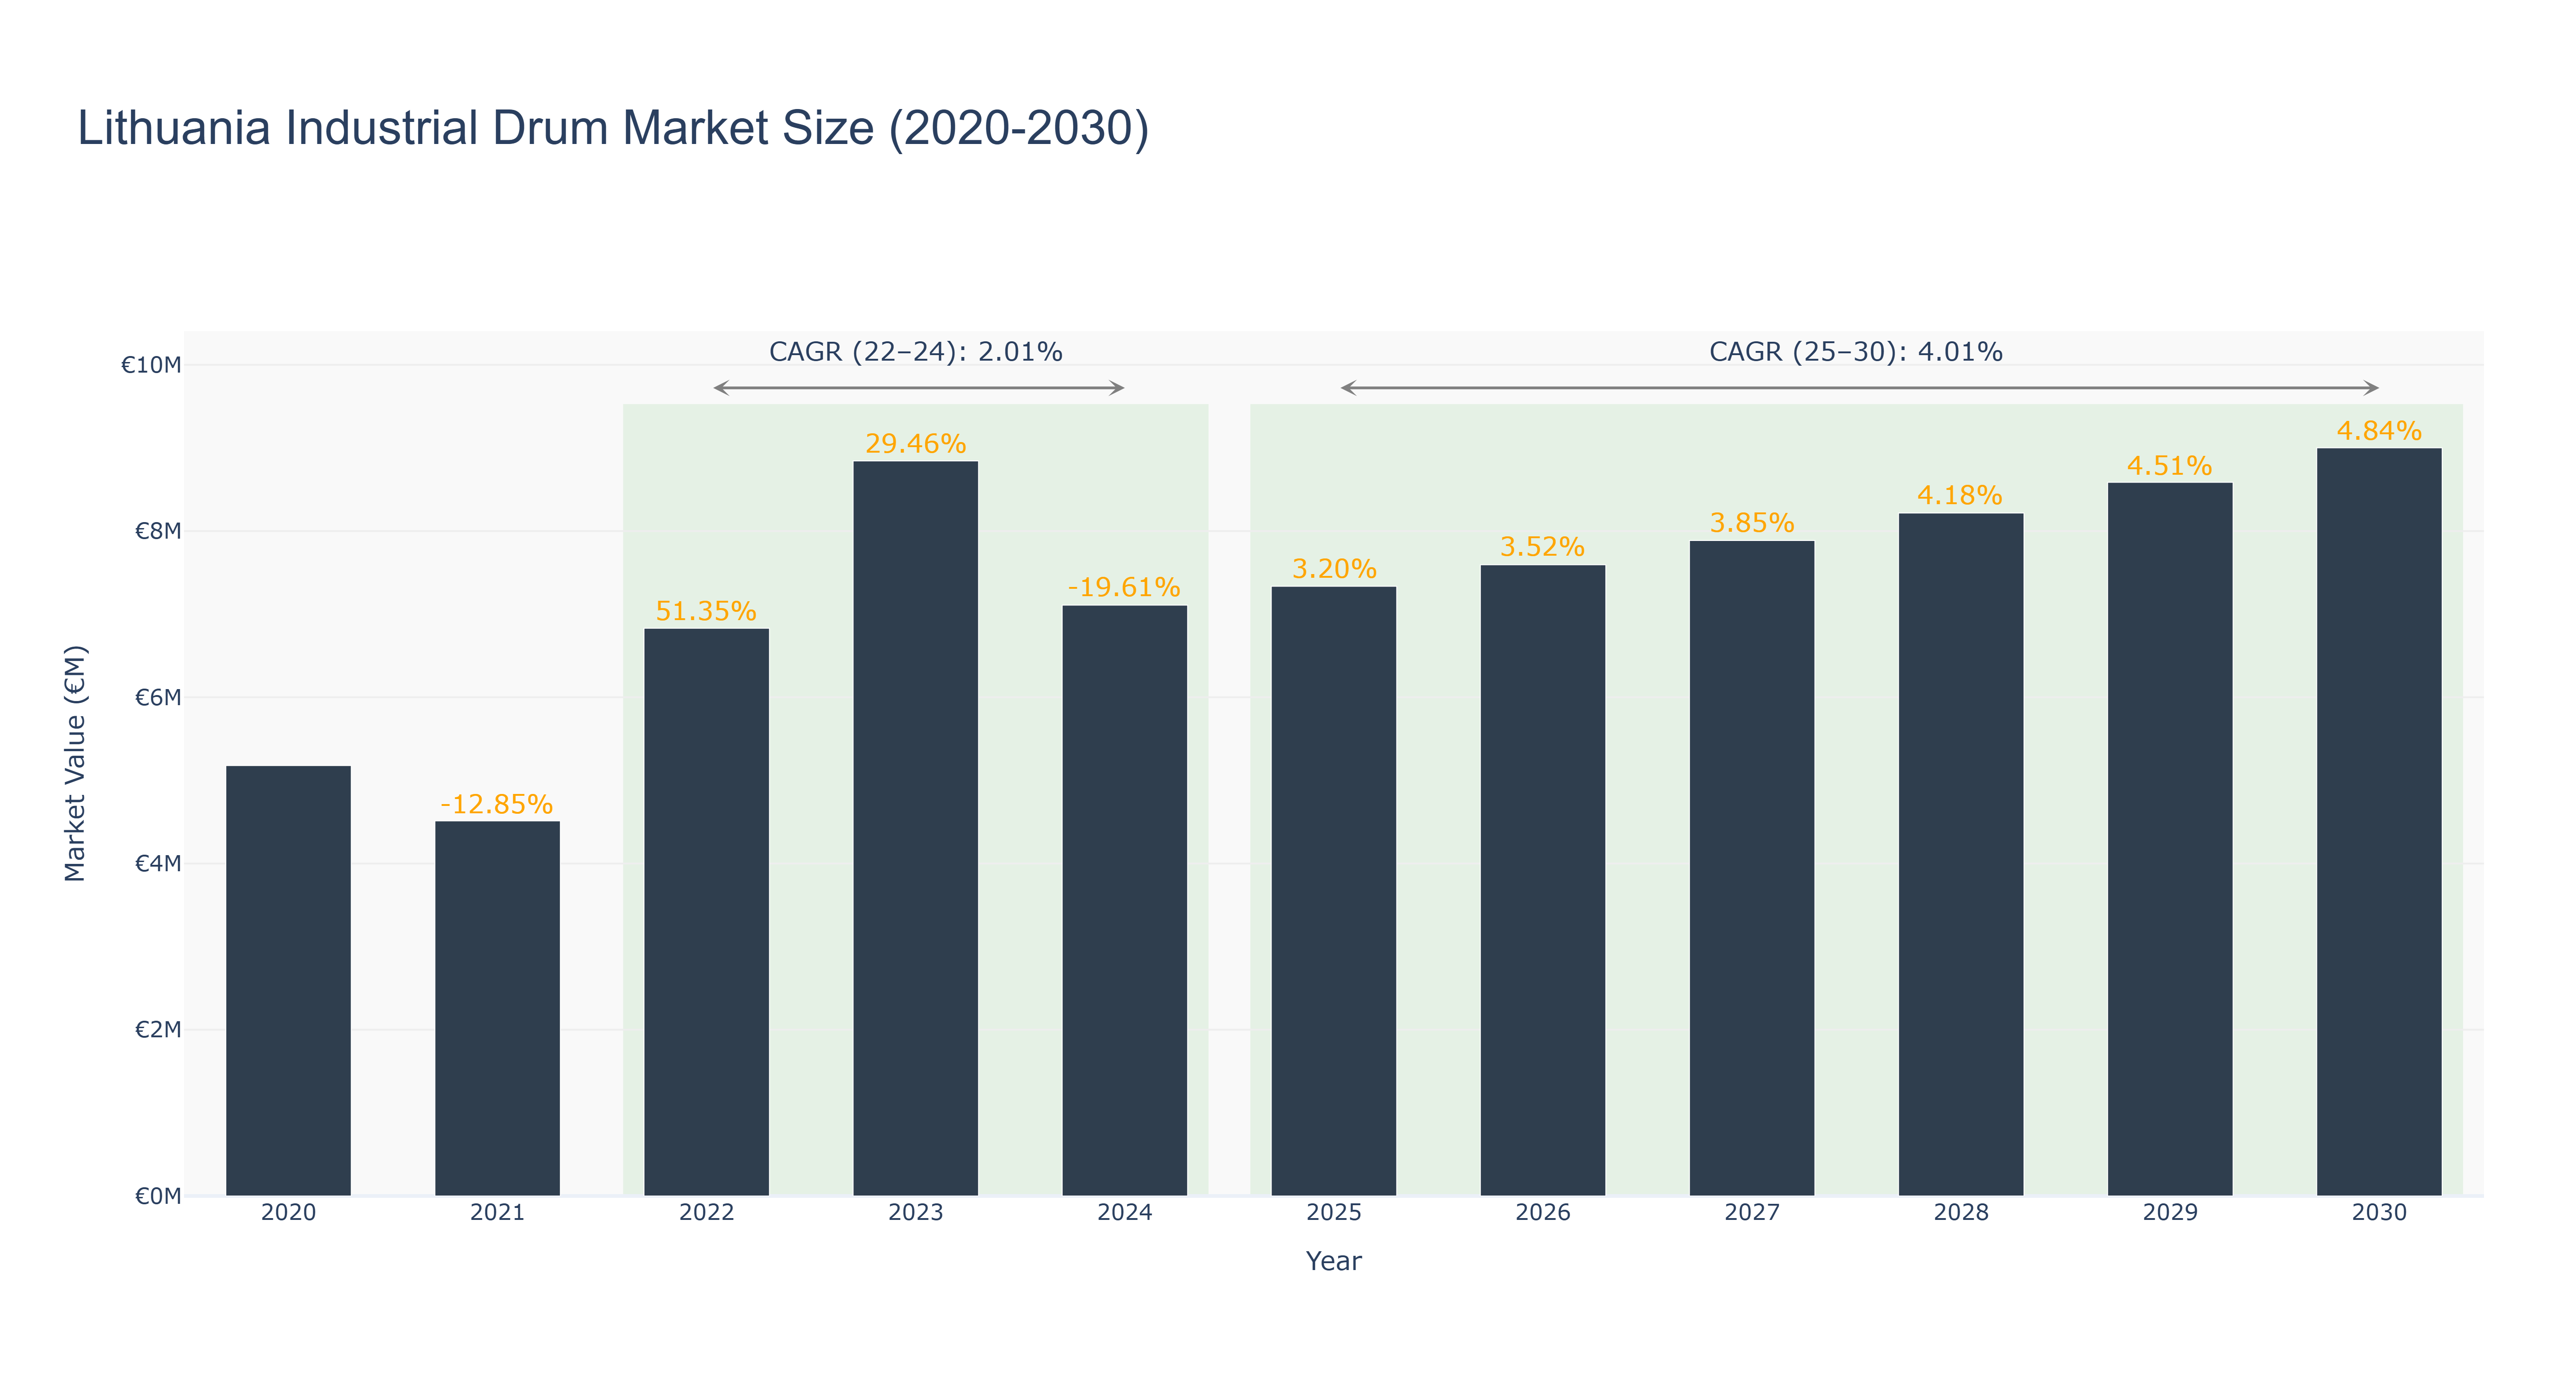
Lithuania Industrial Drum Market has shown a fluctuating trend over the years. The peak market size of €9.00 million is forecasted for 2030. From 2020 to 2024, the market size ranged from €5.18 million to €7.11 million, experiencing a dip in 2024 due to a -19.61% growth rate. However, a steady growth trajectory is observed from 2025 to 2030, with a forecasted market size of €9.00 million in 2030. The CAGR for the periods 2022-24 and 2025-30 are 2.01% and 4.01% respectively. Industry drivers for this market include increasing demand for industrial drums in the manufacturing sector. Looking ahead, Lithuania is set to introduce new sustainability initiatives in the industrial sector, promoting eco-friendly drum production processes and materials to meet growing environmental regulations.
Lithuania Industrial Drum Market: Production & Trade Performance (2019-2025)
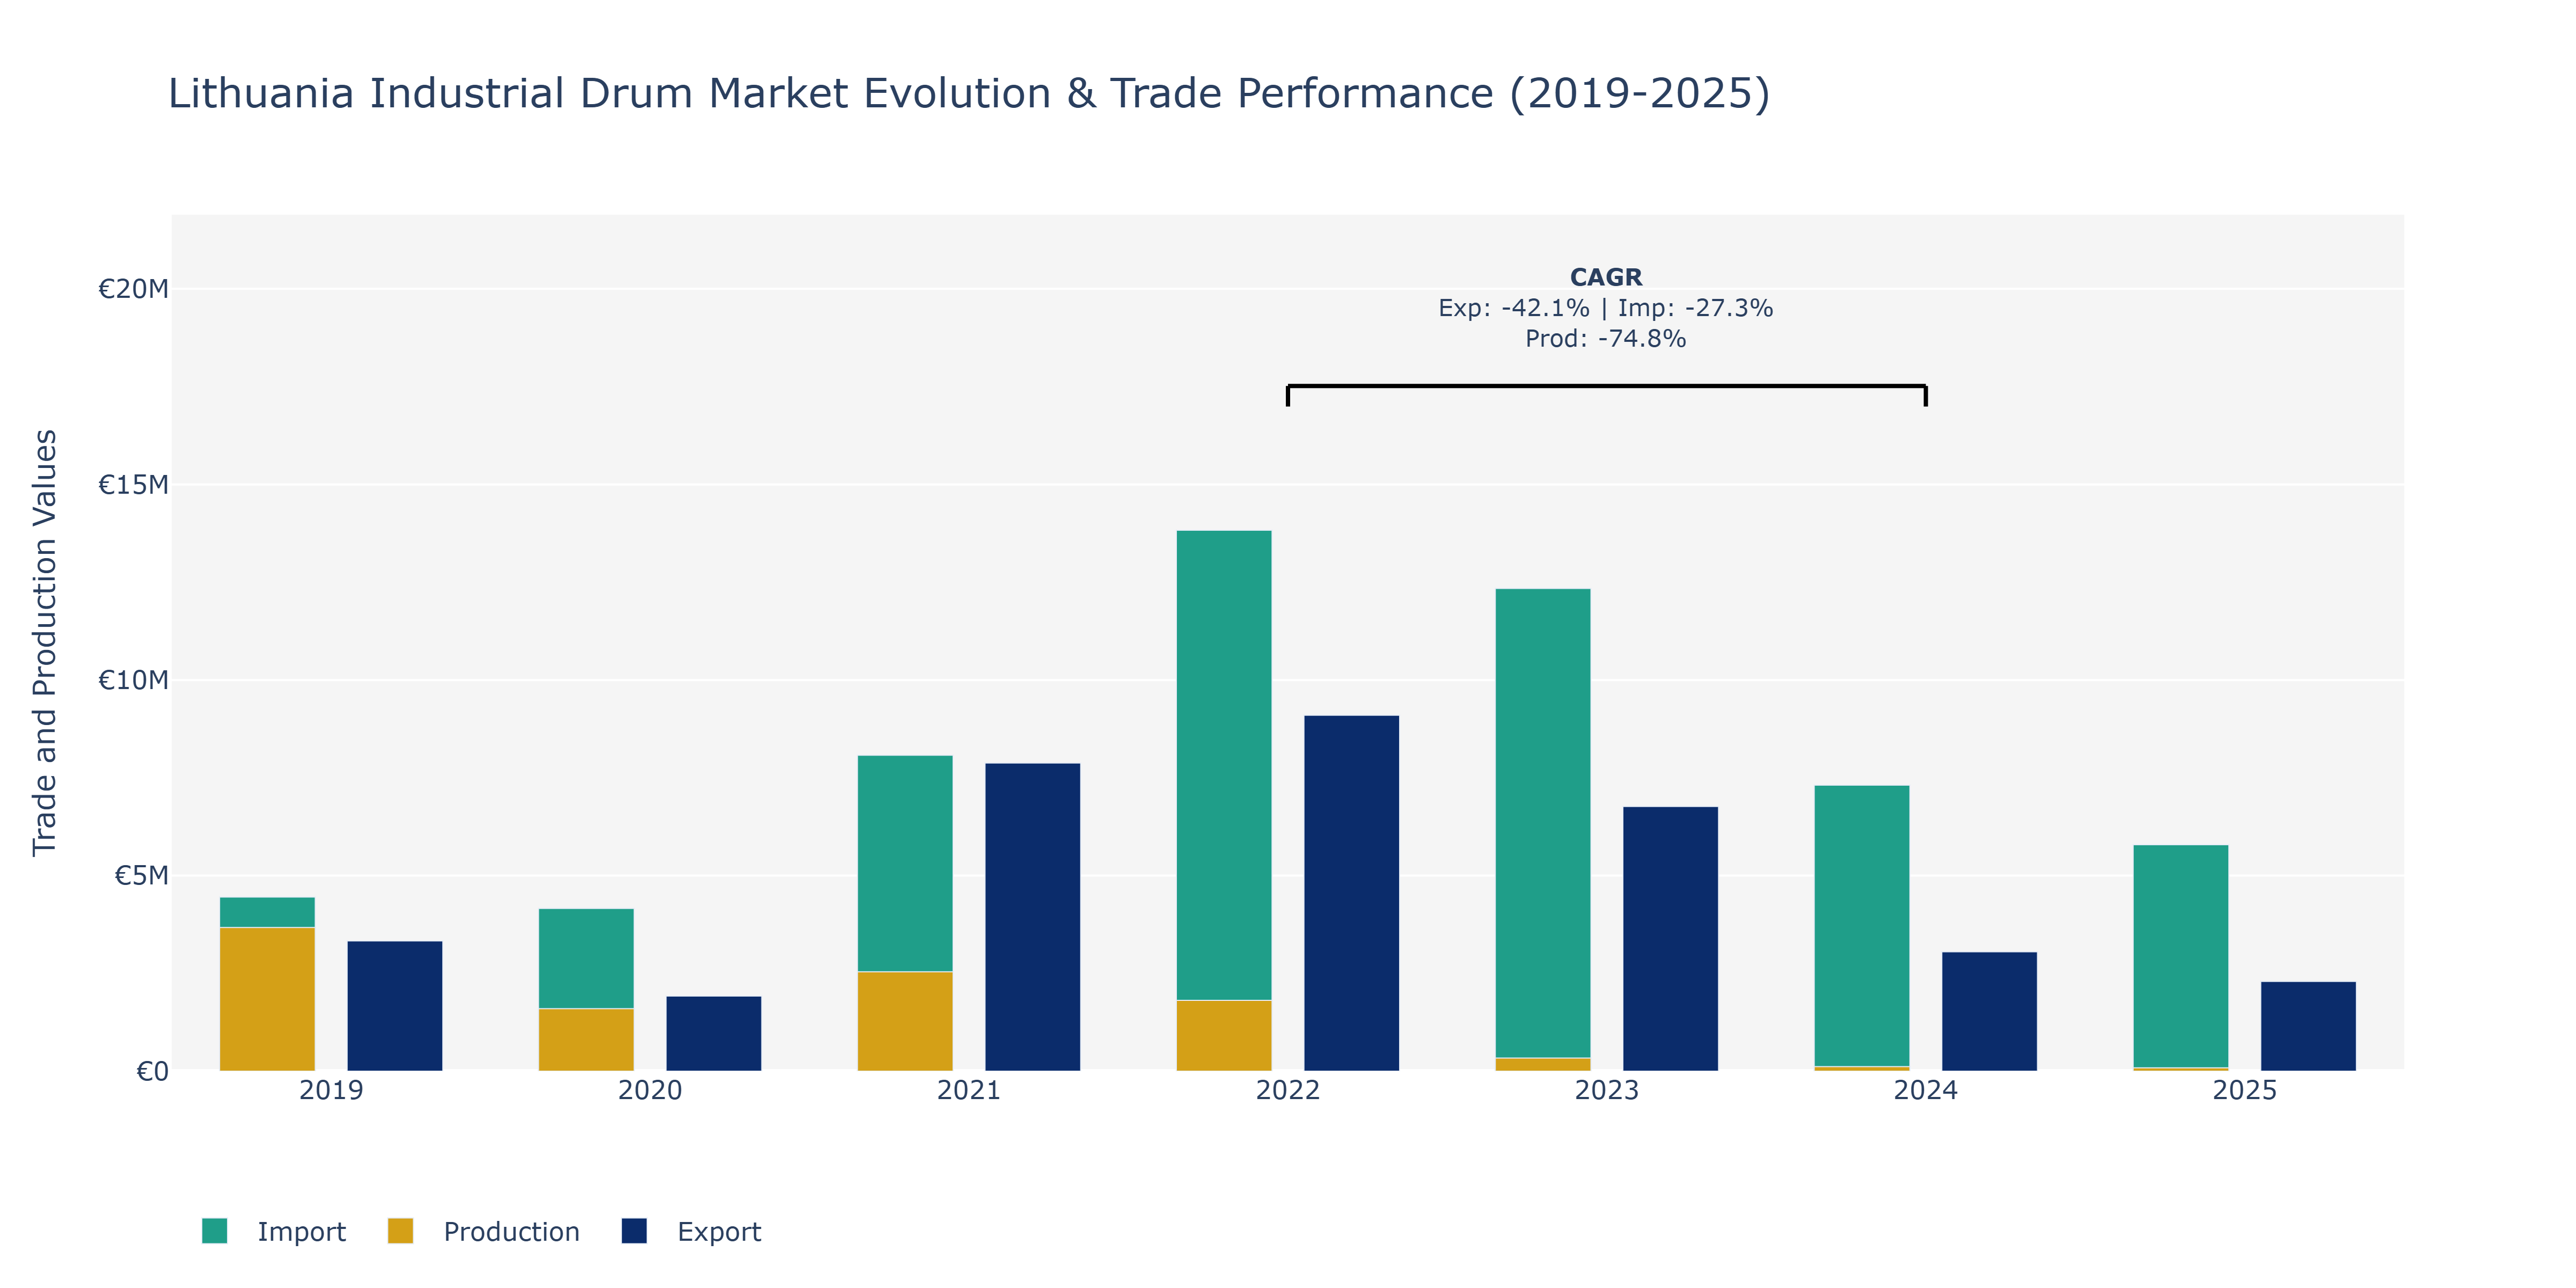
In the Lithuania Industrial Drum Market, from 2019 to 2025, there were noticeable fluctuations in exports, imports, and production. Exports peaked in 2022 at €9.1 million, showing a significant increase from 2019. However, a sharp decline was observed in 2023 and further in 2024. Imports followed a similar trend, peaking in 2022 at €13.83 million before decreasing notably in the following years. Production also experienced fluctuations, with a peak in 2019 at €3.7 million, and a significant decrease by 2025. The decline in production could be attributed to factors such as changes in demand, supply chain disruptions, or technological advancements impacting manufacturing processes. The fluctuating trends in exports and imports may have been influenced by global market conditions, trade policies, or shifts in consumer preferences within the industry. These fluctuations highlight the market's sensitivity to external factors, necessitating strategic planning and adaptability for stakeholders in the Lithuania Industrial Drum Market.
Key Highlights of the Report:
- Lithuania Industrial Drum Market Outlook
- Market Size of Lithuania Industrial Drum Market, 2025
- Forecast of Lithuania Industrial Drum Market, 2032
- Historical Data and Forecast of Lithuania Industrial Drum Revenues & Volume for the Period 2022 - 2032F
- Lithuania Industrial Drum Market Trend Evolution
- Lithuania Industrial Drum Market Drivers and Challenges
- Lithuania Industrial Drum Price Trends
- Lithuania Industrial Drum Porter's Five Forces
- Lithuania Industrial Drum Industry Life Cycle
- Historical Data and Forecast of Lithuania Industrial Drum Market Revenues & Volume By Drum Type for the Period 2022 - 2032F
- Historical Data and Forecast of Lithuania Industrial Drum Market Revenues & Volume By Open Head Drums for the Period 2022 - 2032F
- Historical Data and Forecast of Lithuania Industrial Drum Market Revenues & Volume By Tight Head Drums for the Period 2022 - 2032F
- Historical Data and Forecast of Lithuania Industrial Drum Market Revenues & Volume By Fiber Drums for the Period 2022 - 2032F
- Historical Data and Forecast of Lithuania Industrial Drum Market Revenues & Volume By Composite Drums for the Period 2022 - 2032F
- Historical Data and Forecast of Lithuania Industrial Drum Market Revenues & Volume By Material Type for the Period 2022 - 2032F
- Historical Data and Forecast of Lithuania Industrial Drum Market Revenues & Volume By Steel for the Period 2022 - 2032F
- Historical Data and Forecast of Lithuania Industrial Drum Market Revenues & Volume By Plastic for the Period 2022 - 2032F
- Historical Data and Forecast of Lithuania Industrial Drum Market Revenues & Volume By Fiberboard for the Period 2022 - 2032F
- Historical Data and Forecast of Lithuania Industrial Drum Market Revenues & Volume By Hybrid Materials for the Period 2022 - 2032F
- Historical Data and Forecast of Lithuania Industrial Drum Market Revenues & Volume By Application for the Period 2022 - 2032F
- Historical Data and Forecast of Lithuania Industrial Drum Market Revenues & Volume By Chemical Storage for the Period 2022 - 2032F
- Historical Data and Forecast of Lithuania Industrial Drum Market Revenues & Volume By Hazardous Waste Disposal for the Period 2022 - 2032F
- Historical Data and Forecast of Lithuania Industrial Drum Market Revenues & Volume By Industrial Lubricants for the Period 2022 - 2032F
- Historical Data and Forecast of Lithuania Industrial Drum Market Revenues & Volume By Paints & Coatings for the Period 2022 - 2032F
- Historical Data and Forecast of Lithuania Industrial Drum Market Revenues & Volume By End User for the Period 2022 - 2032F
- Historical Data and Forecast of Lithuania Industrial Drum Market Revenues & Volume By Oil & Gas for the Period 2022 - 2032F
- Historical Data and Forecast of Lithuania Industrial Drum Market Revenues & Volume By Food & Beverage for the Period 2022 - 2032F
- Historical Data and Forecast of Lithuania Industrial Drum Market Revenues & Volume By Pharmaceuticals for the Period 2022 - 2032F
- Historical Data and Forecast of Lithuania Industrial Drum Market Revenues & Volume By Construction for the Period 2022 - 2032F
- Historical Data and Forecast of Lithuania Industrial Drum Market Revenues & Volume By Capacity for the Period 2022 - 2032F
- Historical Data and Forecast of Lithuania Industrial Drum Market Revenues & Volume By Small (50L) for the Period 2022 - 2032F
- Historical Data and Forecast of Lithuania Industrial Drum Market Revenues & Volume By Medium (50-200L) for the Period 2022 - 2032F
- Historical Data and Forecast of Lithuania Industrial Drum Market Revenues & Volume By Large (>200L) for the Period 2022 - 2032F
- Historical Data and Forecast of Lithuania Industrial Drum Market Revenues & Volume By Extra-Large (>500L) for the Period 2022 - 2032F
- Lithuania Industrial Drum Import Export Trade Statistics
- Market Opportunity Assessment By Drum Type
- Market Opportunity Assessment By Material Type
- Market Opportunity Assessment By Application
- Market Opportunity Assessment By End User
- Market Opportunity Assessment By Capacity
- Lithuania Industrial Drum Top Companies Market Share
- Lithuania Industrial Drum Competitive Benchmarking By Technical and Operational Parameters
- Lithuania Industrial Drum Company Profiles
- Lithuania Industrial Drum Key Strategic Recommendations
Frequently Asked Questions About the Market Study (FAQs):
6Wresearch actively monitors the Lithuania Industrial Drum Market and publishes its comprehensive annual report, highlighting emerging trends, growth drivers, revenue analysis, and forecast outlook. Our insights help businesses to make data-backed strategic decisions with ongoing market dynamics. Our analysts track relevent industries related to the Lithuania Industrial Drum Market, allowing our clients with actionable intelligence and reliable forecasts tailored to emerging regional needs.
Yes, we provide customisation as per your requirements. To learn more, feel free to contact us on sales@6wresearch.com
1 Executive Summary |
2 Introduction |
2.1 Key Highlights of the Report |
2.2 Report Description |
2.3 Market Scope & Segmentation |
2.4 Research Methodology |
2.5 Assumptions |
3 Lithuania Industrial Drum Market Overview |
3.1 Lithuania Country Macro Economic Indicators |
3.2 Lithuania Industrial Drum Market Revenues & Volume, 2022 & 2032F |
3.3 Lithuania Industrial Drum Market - Industry Life Cycle |
3.4 Lithuania Industrial Drum Market - Porter's Five Forces |
3.5 Lithuania Industrial Drum Market Revenues & Volume Share, By Drum Type, 2022 & 2032F |
3.6 Lithuania Industrial Drum Market Revenues & Volume Share, By Material Type, 2022 & 2032F |
3.7 Lithuania Industrial Drum Market Revenues & Volume Share, By Application, 2022 & 2032F |
3.8 Lithuania Industrial Drum Market Revenues & Volume Share, By End User, 2022 & 2032F |
3.9 Lithuania Industrial Drum Market Revenues & Volume Share, By Capacity, 2022 & 2032F |
4 Lithuania Industrial Drum Market Dynamics |
4.1 Impact Analysis |
4.2 Market Drivers |
4.2.1 Growing industrial activities and manufacturing sectors in Lithuania |
4.2.2 Increasing demand for efficient and cost-effective storage solutions |
4.2.3 Emphasis on sustainability and environmental regulations driving the adoption of reusable industrial drums |
4.3 Market Restraints |
4.3.1 Fluctuating raw material prices impacting production costs |
4.3.2 Competition from alternative storage solutions like intermediate bulk containers (IBCs) |
4.3.3 Economic uncertainties affecting investment decisions in industrial equipment |
5 Lithuania Industrial Drum Market Trends |
6 Lithuania Industrial Drum Market, By Types |
6.1 Lithuania Industrial Drum Market, By Drum Type |
6.1.1 Overview and Analysis |
6.1.2 Lithuania Industrial Drum Market Revenues & Volume, By Drum Type, 2022 - 2032F |
6.1.3 Lithuania Industrial Drum Market Revenues & Volume, By Open Head Drums, 2022 - 2032F |
6.1.4 Lithuania Industrial Drum Market Revenues & Volume, By Tight Head Drums, 2022 - 2032F |
6.1.5 Lithuania Industrial Drum Market Revenues & Volume, By Fiber Drums, 2022 - 2032F |
6.1.6 Lithuania Industrial Drum Market Revenues & Volume, By Composite Drums, 2022 - 2032F |
6.2 Lithuania Industrial Drum Market, By Material Type |
6.2.1 Overview and Analysis |
6.2.2 Lithuania Industrial Drum Market Revenues & Volume, By Steel, 2022 - 2032F |
6.2.3 Lithuania Industrial Drum Market Revenues & Volume, By Plastic, 2022 - 2032F |
6.2.4 Lithuania Industrial Drum Market Revenues & Volume, By Fiberboard, 2022 - 2032F |
6.2.5 Lithuania Industrial Drum Market Revenues & Volume, By Hybrid Materials, 2022 - 2032F |
6.3 Lithuania Industrial Drum Market, By Application |
6.3.1 Overview and Analysis |
6.3.2 Lithuania Industrial Drum Market Revenues & Volume, By Chemical Storage, 2022 - 2032F |
6.3.3 Lithuania Industrial Drum Market Revenues & Volume, By Hazardous Waste Disposal, 2022 - 2032F |
6.3.4 Lithuania Industrial Drum Market Revenues & Volume, By Industrial Lubricants, 2022 - 2032F |
6.3.5 Lithuania Industrial Drum Market Revenues & Volume, By Paints & Coatings, 2022 - 2032F |
6.4 Lithuania Industrial Drum Market, By End User |
6.4.1 Overview and Analysis |
6.4.2 Lithuania Industrial Drum Market Revenues & Volume, By Oil & Gas, 2022 - 2032F |
6.4.3 Lithuania Industrial Drum Market Revenues & Volume, By Food & Beverage, 2022 - 2032F |
6.4.4 Lithuania Industrial Drum Market Revenues & Volume, By Pharmaceuticals, 2022 - 2032F |
6.4.5 Lithuania Industrial Drum Market Revenues & Volume, By Construction, 2022 - 2032F |
6.5 Lithuania Industrial Drum Market, By Capacity |
6.5.1 Overview and Analysis |
6.5.2 Lithuania Industrial Drum Market Revenues & Volume, By Small (‰ 50L), 2022 - 2032F |
6.5.3 Lithuania Industrial Drum Market Revenues & Volume, By Medium (50-200L), 2022 - 2032F |
6.5.4 Lithuania Industrial Drum Market Revenues & Volume, By Large (>200L), 2022 - 2032F |
6.5.5 Lithuania Industrial Drum Market Revenues & Volume, By Extra-Large (>500L), 2022 - 2032F |
7 Lithuania Industrial Drum Market Import-Export Trade Statistics |
7.1 Lithuania Industrial Drum Market Export to Major Countries |
7.2 Lithuania Industrial Drum Market Imports from Major Countries |
8 Lithuania Industrial Drum Market Key Performance Indicators |
8.1 Percentage increase in the number of manufacturing facilities using industrial drums |
8.2 Average lifespan of industrial drums in use |
8.3 Percentage of industrial drums recycled or reused in the market |
9 Lithuania Industrial Drum Market - Opportunity Assessment |
9.1 Lithuania Industrial Drum Market Opportunity Assessment, By Drum Type, 2022 & 2032F |
9.2 Lithuania Industrial Drum Market Opportunity Assessment, By Material Type, 2022 & 2032F |
9.3 Lithuania Industrial Drum Market Opportunity Assessment, By Application, 2022 & 2032F |
9.4 Lithuania Industrial Drum Market Opportunity Assessment, By End User, 2022 & 2032F |
9.5 Lithuania Industrial Drum Market Opportunity Assessment, By Capacity, 2022 & 2032F |
10 Lithuania Industrial Drum Market - Competitive Landscape |
10.1 Lithuania Industrial Drum Market Revenue Share, By Companies, 2025 |
10.2 Lithuania Industrial Drum Market Competitive Benchmarking, By Operating and Technical Parameters |
11 Company Profiles |
12 Recommendations |
13 Disclaimer |
Global Go To Market Strategy - 2030
Export potential enables firms to identify high-growth global markets with greater confidence by combining advanced trade intelligence with a structured quantitative methodology. The framework analyzes emerging demand trends and country-level import patterns while integrating macroeconomic and trade datasets such as GDP and population forecasts, bilateral import–export flows, tariff structures, elasticity differentials between developed and developing economies, geographic distance, and import demand projections. Using weighted trade values from 2020–2024 as the base period to project country-to-country export potential for 2030, these inputs are operationalized through calculated drivers such as gravity model parameters, tariff impact factors, and projected GDP per-capita growth. Through an analysis of hidden potentials, demand hotspots, and market conditions that are most favorable to success, this method enables firms to focus on target countries, maximize returns, and global expansion with data, backed by accuracy.
By factoring in the projected importer demand gap that is currently unmet and could be potential opportunity, it identifies the potential for the Exporter (Country) among 190 countries, against the general trade analysis, which identifies the biggest importer or exporter.
To discover high-growth global markets and optimize your business strategy:
Click Here
Pricing
- Single User License$ 1,995
- Department License$ 2,400
- Site License$ 3,120
- Global License$ 3,795

Leadership Perspectives from Industry Events
Search
Thought Leadership and Analyst Meet


Our Clients
6WResearch In News
- Doha a strategic location for EV manufacturing hub: IPA Qatar
- Demand for luxury TVs surging in the GCC, says Samsung
- Empowering Growth: The Thriving Journey of Bangladesh’s Cable Industry
- Demand for luxury TVs surging in the GCC, says Samsung
- Video call with a traditional healer? Once unthinkable, it’s now common in South Africa
- Intelligent Buildings To Smooth GCC’s Path To Net Zero
Latest Reports
- Taiwan Airport Wireless Infrastructure Market (2026-2032)
- Vietnam Airport Wireless Infrastructure Market (2026-2032)
- Thailand Airport Wireless Infrastructure Market (2026-2032)
- South Korea Airport Wireless Infrastructure Market (2026-2032)
- Romania Airport Wireless Infrastructure Market (2026-2032)
- Qatar Airport Wireless Infrastructure Market (2026-2032)
- Philippines Airport Wireless Infrastructure Market (2026-2032)
- Japan Airport Wireless Infrastructure Market (2026-2032)
- Taiwan Airport Winter Services Market (2026-2032)
- Vietnam Airport Winter Services Market (2026-2032)
Industry Events and Analyst Meet

HIMTEX 2026

India Refining Summit 2026

India EV Show 2026

EV tech India Expo 2026

Auto Tech Asia 2026
Whitepaper
- Middle East & Africa Commercial Security Market Click here to view more.
- Middle East & Africa Fire Safety Systems & Equipment Market Click here to view more.
- GCC Drone Market Click here to view more.
- Middle East Lighting Fixture Market Click here to view more.
- GCC Physical & Perimeter Security Market Click here to view more.