Lithuania Kitchen Countertop Market (2026-2032) | Share, Companies, Segmentation, Competition, Forecast, Strategy, Growth, Analysis, Size, Competitive, Demand, Segments, Outlook, Trends, Value, Investment Trends, Pricing Analysis, Strategic Insights, Revenue, Industry, Consumer Insights, Challenges, Supply, Opportunities, Restraints, Drivers
Market Forecast By Material (Granite, Quartz, Marble, Laminate, Solid Surface), By Surface Type (Smooth, Textured, Polished, Rough, Non-Porous), By Installation Type (Built-In, Freestanding, Modular, Wall-Mounted, Custom), By Application (Residential, Commercial, Hospitality, Institutional, Industrial), By Finish (Glossy, Matte, Polished, Textured, Satin) And Competitive Landscape
| Product Code: ETC12606906 | Publication Date: Apr 2025 | Updated Date: Apr 2026 | Product Type: Market Research Report | |
| Publisher: 6Wresearch | No. of Pages: 65 | No. of Figures: 34 | No. of Tables: 19 | |
Lithuania Kitchen Countertop Market Size (2020-2030)
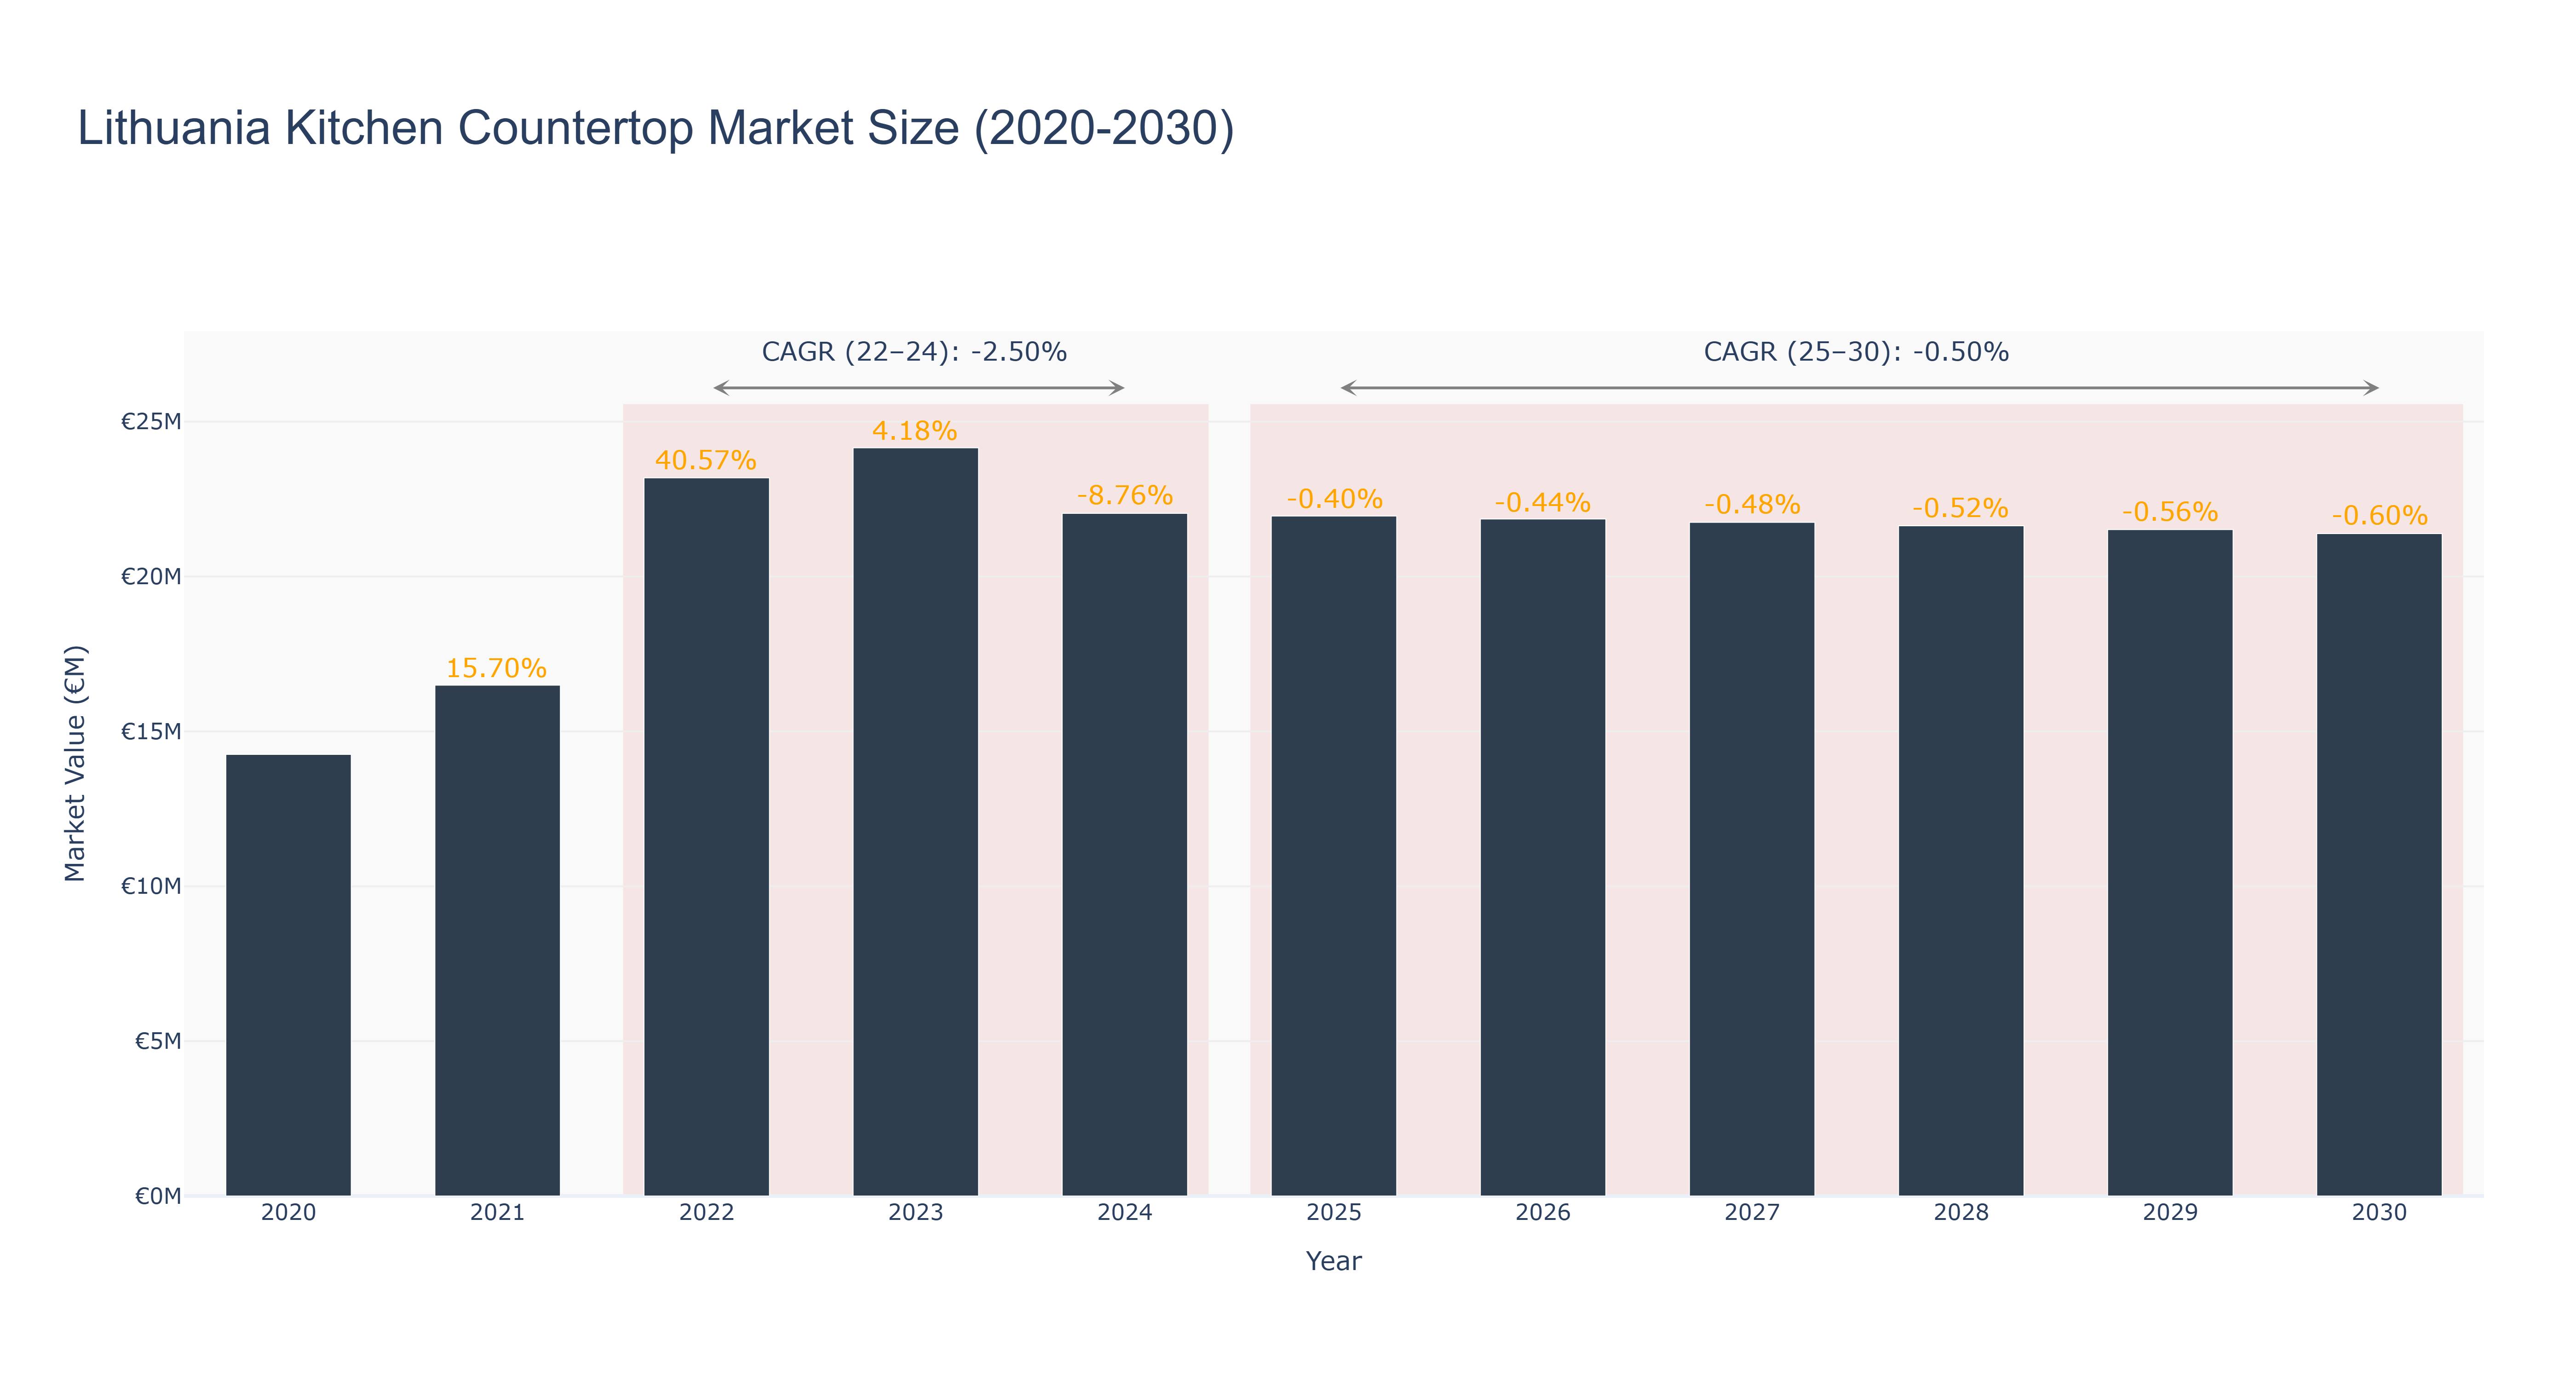
The Lithuania Kitchen Countertop Market experienced a peak market size of €24.16 million in 2023. The market size saw a decrease from €14.26 million in 2020 to €22.04 million in 2024, mainly attributed to economic fluctuations and changing consumer preferences. Forecasted market sizes from 2025 to 2030 are expected to range from €21.95 million to €21.39 million, with a CAGR of -0.50% from 2025-2030. The market's downward trend can be attributed to global economic uncertainties and increased competition. However, recent developments in sustainable countertop materials and innovative design trends are expected to drive market growth in the near future, with upcoming projects focusing on enhancing product durability and environmental sustainability.
Lithuania Kitchen Countertop Market: Production & Trade Performance (2019-2025)
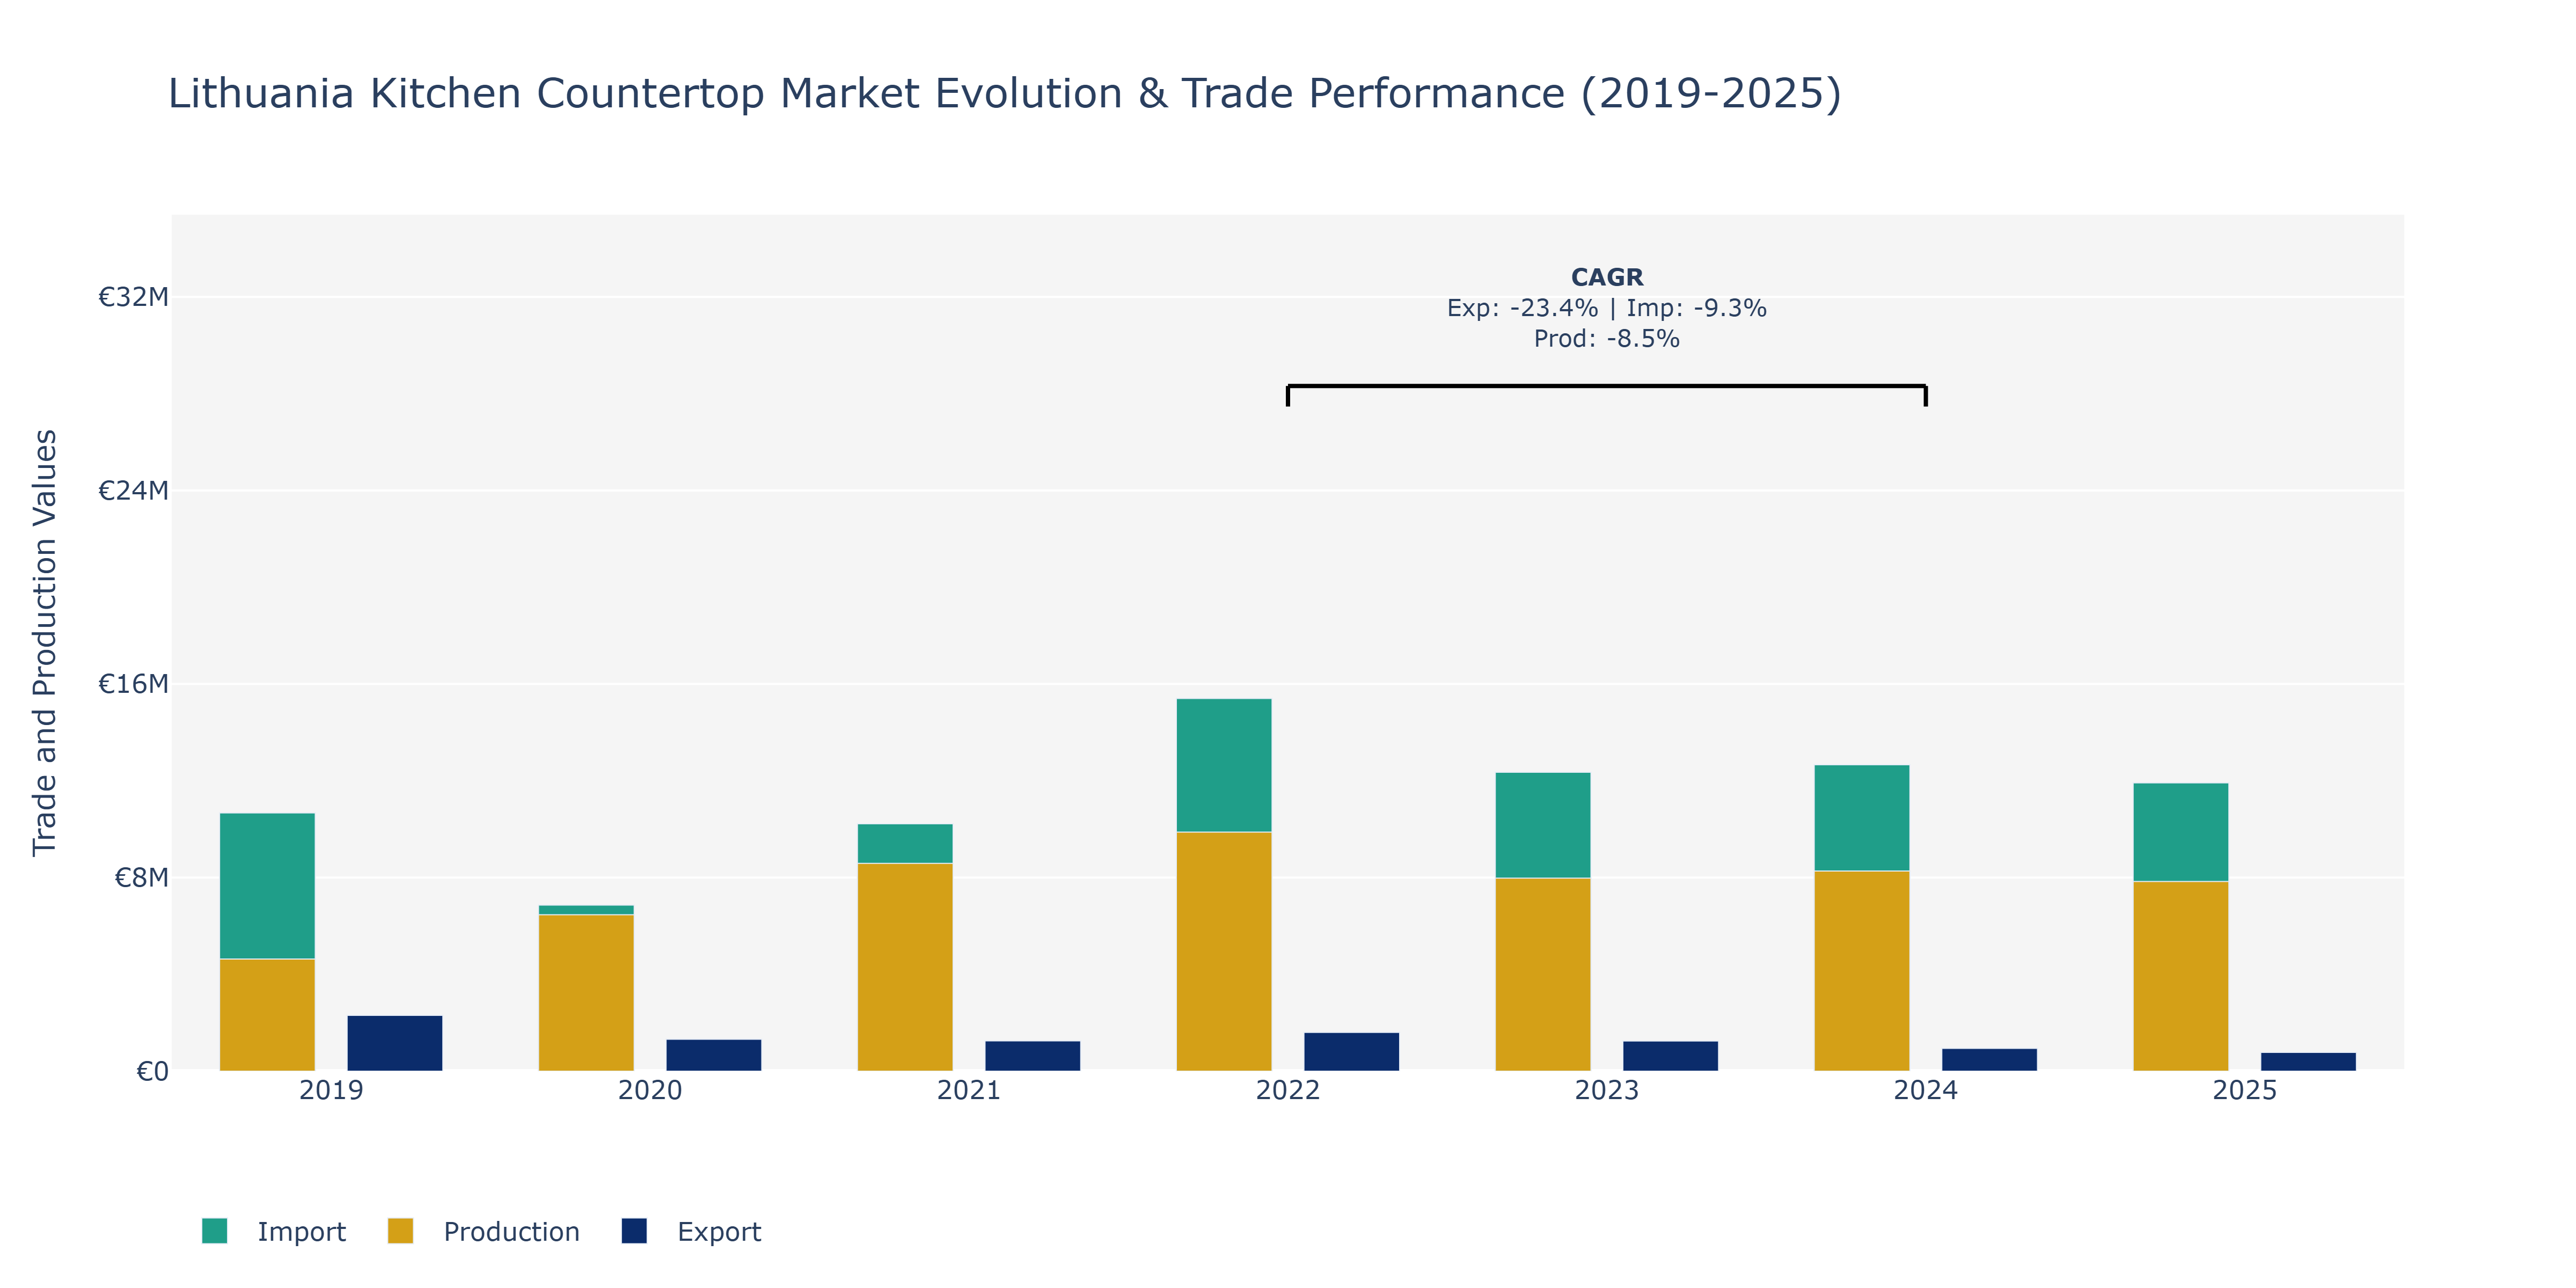
In the Lithuania Kitchen Countertop Market, from 2019 to 2025, there were notable trends in exports, imports, and production. Exports experienced a continuous decline from €2.31 million in 2019 to around €0.78 million in 2025. This downward trend may be attributed to changing consumer preferences, global economic uncertainties impacting demand, and possibly increased competition in international markets. Imports saw fluctuations, reaching a peak of €15.4 million in 2022 before dropping to €11.92 million in 2025. These fluctuations could be linked to variations in raw material costs, changes in trade policies affecting import volumes, and shifts in domestic demand. Production levels also fluctuated, with a peak in 2021 at €8.59 million, followed by a decrease in subsequent years. The decline might be due to supply chain disruptions, changes in manufacturing technologies, and evolving market dynamics influencing production capacities. To sustain growth, market players could focus on innovation, cost efficiencies, and market diversification strategies in response to changing market conditions.
Key Highlights of the Report:
- Lithuania Kitchen Countertop Market Outlook
- Market Size of Lithuania Kitchen Countertop Market, 2025
- Forecast of Lithuania Kitchen Countertop Market, 2032
- Historical Data and Forecast of Lithuania Kitchen Countertop Revenues & Volume for the Period 2022 - 2032F
- Lithuania Kitchen Countertop Market Trend Evolution
- Lithuania Kitchen Countertop Market Drivers and Challenges
- Lithuania Kitchen Countertop Price Trends
- Lithuania Kitchen Countertop Porter's Five Forces
- Lithuania Kitchen Countertop Industry Life Cycle
- Historical Data and Forecast of Lithuania Kitchen Countertop Market Revenues & Volume By Material for the Period 2022 - 2032F
- Historical Data and Forecast of Lithuania Kitchen Countertop Market Revenues & Volume By Granite for the Period 2022 - 2032F
- Historical Data and Forecast of Lithuania Kitchen Countertop Market Revenues & Volume By Quartz for the Period 2022 - 2032F
- Historical Data and Forecast of Lithuania Kitchen Countertop Market Revenues & Volume By Marble for the Period 2022 - 2032F
- Historical Data and Forecast of Lithuania Kitchen Countertop Market Revenues & Volume By Laminate for the Period 2022 - 2032F
- Historical Data and Forecast of Lithuania Kitchen Countertop Market Revenues & Volume By Solid Surface for the Period 2022 - 2032F
- Historical Data and Forecast of Lithuania Kitchen Countertop Market Revenues & Volume By Surface Type for the Period 2022 - 2032F
- Historical Data and Forecast of Lithuania Kitchen Countertop Market Revenues & Volume By Smooth for the Period 2022 - 2032F
- Historical Data and Forecast of Lithuania Kitchen Countertop Market Revenues & Volume By Textured for the Period 2022 - 2032F
- Historical Data and Forecast of Lithuania Kitchen Countertop Market Revenues & Volume By Polished for the Period 2022 - 2032F
- Historical Data and Forecast of Lithuania Kitchen Countertop Market Revenues & Volume By Rough for the Period 2022 - 2032F
- Historical Data and Forecast of Lithuania Kitchen Countertop Market Revenues & Volume By Non-Porous for the Period 2022 - 2032F
- Historical Data and Forecast of Lithuania Kitchen Countertop Market Revenues & Volume By Installation Type for the Period 2022 - 2032F
- Historical Data and Forecast of Lithuania Kitchen Countertop Market Revenues & Volume By Built-In for the Period 2022 - 2032F
- Historical Data and Forecast of Lithuania Kitchen Countertop Market Revenues & Volume By Freestanding for the Period 2022 - 2032F
- Historical Data and Forecast of Lithuania Kitchen Countertop Market Revenues & Volume By Modular for the Period 2022 - 2032F
- Historical Data and Forecast of Lithuania Kitchen Countertop Market Revenues & Volume By Wall-Mounted for the Period 2022 - 2032F
- Historical Data and Forecast of Lithuania Kitchen Countertop Market Revenues & Volume By Custom for the Period 2022 - 2032F
- Historical Data and Forecast of Lithuania Kitchen Countertop Market Revenues & Volume By Application for the Period 2022 - 2032F
- Historical Data and Forecast of Lithuania Kitchen Countertop Market Revenues & Volume By Residential for the Period 2022 - 2032F
- Historical Data and Forecast of Lithuania Kitchen Countertop Market Revenues & Volume By Commercial for the Period 2022 - 2032F
- Historical Data and Forecast of Lithuania Kitchen Countertop Market Revenues & Volume By Hospitality for the Period 2022 - 2032F
- Historical Data and Forecast of Lithuania Kitchen Countertop Market Revenues & Volume By Institutional for the Period 2022 - 2032F
- Historical Data and Forecast of Lithuania Kitchen Countertop Market Revenues & Volume By Industrial for the Period 2022 - 2032F
- Historical Data and Forecast of Lithuania Kitchen Countertop Market Revenues & Volume By Finish for the Period 2022 - 2032F
- Historical Data and Forecast of Lithuania Kitchen Countertop Market Revenues & Volume By Glossy for the Period 2022 - 2032F
- Historical Data and Forecast of Lithuania Kitchen Countertop Market Revenues & Volume By Matte for the Period 2022 - 2032F
- Historical Data and Forecast of Lithuania Kitchen Countertop Market Revenues & Volume By Polished for the Period 2022 - 2032F
- Historical Data and Forecast of Lithuania Kitchen Countertop Market Revenues & Volume By Textured for the Period 2022 - 2032F
- Historical Data and Forecast of Lithuania Kitchen Countertop Market Revenues & Volume By Satin for the Period 2022 - 2032F
- Lithuania Kitchen Countertop Import Export Trade Statistics
- Market Opportunity Assessment By Material
- Market Opportunity Assessment By Surface Type
- Market Opportunity Assessment By Installation Type
- Market Opportunity Assessment By Application
- Market Opportunity Assessment By Finish
- Lithuania Kitchen Countertop Top Companies Market Share
- Lithuania Kitchen Countertop Competitive Benchmarking By Technical and Operational Parameters
- Lithuania Kitchen Countertop Company Profiles
- Lithuania Kitchen Countertop Key Strategic Recommendations
Frequently Asked Questions About the Market Study (FAQs):
6Wresearch actively monitors the Lithuania Kitchen Countertop Market and publishes its comprehensive annual report, highlighting emerging trends, growth drivers, revenue analysis, and forecast outlook. Our insights help businesses to make data-backed strategic decisions with ongoing market dynamics. Our analysts track relevent industries related to the Lithuania Kitchen Countertop Market, allowing our clients with actionable intelligence and reliable forecasts tailored to emerging regional needs.
Yes, we provide customisation as per your requirements. To learn more, feel free to contact us on sales@6wresearch.com
1 Executive Summary |
2 Introduction |
2.1 Key Highlights of the Report |
2.2 Report Description |
2.3 Market Scope & Segmentation |
2.4 Research Methodology |
2.5 Assumptions |
3 Lithuania Kitchen Countertop Market Overview |
3.1 Lithuania Country Macro Economic Indicators |
3.2 Lithuania Kitchen Countertop Market Revenues & Volume, 2022 & 2032F |
3.3 Lithuania Kitchen Countertop Market - Industry Life Cycle |
3.4 Lithuania Kitchen Countertop Market - Porter's Five Forces |
3.5 Lithuania Kitchen Countertop Market Revenues & Volume Share, By Material, 2022 & 2032F |
3.6 Lithuania Kitchen Countertop Market Revenues & Volume Share, By Surface Type, 2022 & 2032F |
3.7 Lithuania Kitchen Countertop Market Revenues & Volume Share, By Installation Type, 2022 & 2032F |
3.8 Lithuania Kitchen Countertop Market Revenues & Volume Share, By Application, 2022 & 2032F |
3.9 Lithuania Kitchen Countertop Market Revenues & Volume Share, By Finish, 2022 & 2032F |
4 Lithuania Kitchen Countertop Market Dynamics |
4.1 Impact Analysis |
4.2 Market Drivers |
4.2.1 Growing demand for modern kitchen designs and renovations in Lithuania. |
4.2.2 Increase in disposable income leading to higher spending on home improvement projects. |
4.2.3 Rise in urbanization and changing lifestyles driving the demand for kitchen countertop upgrades. |
4.3 Market Restraints |
4.3.1 Fluctuations in raw material prices impacting the cost of kitchen countertops. |
4.3.2 Intense competition from local and international kitchen countertop manufacturers. |
4.3.3 Economic uncertainty affecting consumer willingness to invest in kitchen renovations. |
5 Lithuania Kitchen Countertop Market Trends |
6 Lithuania Kitchen Countertop Market, By Types |
6.1 Lithuania Kitchen Countertop Market, By Material |
6.1.1 Overview and Analysis |
6.1.2 Lithuania Kitchen Countertop Market Revenues & Volume, By Material, 2022 - 2032F |
6.1.3 Lithuania Kitchen Countertop Market Revenues & Volume, By Granite, 2022 - 2032F |
6.1.4 Lithuania Kitchen Countertop Market Revenues & Volume, By Quartz, 2022 - 2032F |
6.1.5 Lithuania Kitchen Countertop Market Revenues & Volume, By Marble, 2022 - 2032F |
6.1.6 Lithuania Kitchen Countertop Market Revenues & Volume, By Laminate, 2022 - 2032F |
6.1.7 Lithuania Kitchen Countertop Market Revenues & Volume, By Solid Surface, 2022 - 2032F |
6.2 Lithuania Kitchen Countertop Market, By Surface Type |
6.2.1 Overview and Analysis |
6.2.2 Lithuania Kitchen Countertop Market Revenues & Volume, By Smooth, 2022 - 2032F |
6.2.3 Lithuania Kitchen Countertop Market Revenues & Volume, By Textured, 2022 - 2032F |
6.2.4 Lithuania Kitchen Countertop Market Revenues & Volume, By Polished, 2022 - 2032F |
6.2.5 Lithuania Kitchen Countertop Market Revenues & Volume, By Rough, 2022 - 2032F |
6.2.6 Lithuania Kitchen Countertop Market Revenues & Volume, By Non-Porous, 2022 - 2032F |
6.3 Lithuania Kitchen Countertop Market, By Installation Type |
6.3.1 Overview and Analysis |
6.3.2 Lithuania Kitchen Countertop Market Revenues & Volume, By Built-In, 2022 - 2032F |
6.3.3 Lithuania Kitchen Countertop Market Revenues & Volume, By Freestanding, 2022 - 2032F |
6.3.4 Lithuania Kitchen Countertop Market Revenues & Volume, By Modular, 2022 - 2032F |
6.3.5 Lithuania Kitchen Countertop Market Revenues & Volume, By Wall-Mounted, 2022 - 2032F |
6.3.6 Lithuania Kitchen Countertop Market Revenues & Volume, By Custom, 2022 - 2032F |
6.4 Lithuania Kitchen Countertop Market, By Application |
6.4.1 Overview and Analysis |
6.4.2 Lithuania Kitchen Countertop Market Revenues & Volume, By Residential, 2022 - 2032F |
6.4.3 Lithuania Kitchen Countertop Market Revenues & Volume, By Commercial, 2022 - 2032F |
6.4.4 Lithuania Kitchen Countertop Market Revenues & Volume, By Hospitality, 2022 - 2032F |
6.4.5 Lithuania Kitchen Countertop Market Revenues & Volume, By Institutional, 2022 - 2032F |
6.4.6 Lithuania Kitchen Countertop Market Revenues & Volume, By Industrial, 2022 - 2032F |
6.5 Lithuania Kitchen Countertop Market, By Finish |
6.5.1 Overview and Analysis |
6.5.2 Lithuania Kitchen Countertop Market Revenues & Volume, By Glossy, 2022 - 2032F |
6.5.3 Lithuania Kitchen Countertop Market Revenues & Volume, By Matte, 2022 - 2032F |
6.5.4 Lithuania Kitchen Countertop Market Revenues & Volume, By Polished, 2022 - 2032F |
6.5.5 Lithuania Kitchen Countertop Market Revenues & Volume, By Textured, 2022 - 2032F |
6.5.6 Lithuania Kitchen Countertop Market Revenues & Volume, By Satin, 2022 - 2032F |
7 Lithuania Kitchen Countertop Market Import-Export Trade Statistics |
7.1 Lithuania Kitchen Countertop Market Export to Major Countries |
7.2 Lithuania Kitchen Countertop Market Imports from Major Countries |
8 Lithuania Kitchen Countertop Market Key Performance Indicators |
8.1 Average order value for kitchen countertop installations. |
8.2 Number of new kitchen countertop designs introduced to the market. |
8.3 Customer satisfaction ratings for kitchen countertop suppliers. |
9 Lithuania Kitchen Countertop Market - Opportunity Assessment |
9.1 Lithuania Kitchen Countertop Market Opportunity Assessment, By Material, 2022 & 2032F |
9.2 Lithuania Kitchen Countertop Market Opportunity Assessment, By Surface Type, 2022 & 2032F |
9.3 Lithuania Kitchen Countertop Market Opportunity Assessment, By Installation Type, 2022 & 2032F |
9.4 Lithuania Kitchen Countertop Market Opportunity Assessment, By Application, 2022 & 2032F |
9.5 Lithuania Kitchen Countertop Market Opportunity Assessment, By Finish, 2022 & 2032F |
10 Lithuania Kitchen Countertop Market - Competitive Landscape |
10.1 Lithuania Kitchen Countertop Market Revenue Share, By Companies, 2025 |
10.2 Lithuania Kitchen Countertop Market Competitive Benchmarking, By Operating and Technical Parameters |
11 Company Profiles |
12 Recommendations |
13 Disclaimer |
Global Go To Market Strategy - 2030
Export potential enables firms to identify high-growth global markets with greater confidence by combining advanced trade intelligence with a structured quantitative methodology. The framework analyzes emerging demand trends and country-level import patterns while integrating macroeconomic and trade datasets such as GDP and population forecasts, bilateral import–export flows, tariff structures, elasticity differentials between developed and developing economies, geographic distance, and import demand projections. Using weighted trade values from 2020–2024 as the base period to project country-to-country export potential for 2030, these inputs are operationalized through calculated drivers such as gravity model parameters, tariff impact factors, and projected GDP per-capita growth. Through an analysis of hidden potentials, demand hotspots, and market conditions that are most favorable to success, this method enables firms to focus on target countries, maximize returns, and global expansion with data, backed by accuracy.
By factoring in the projected importer demand gap that is currently unmet and could be potential opportunity, it identifies the potential for the Exporter (Country) among 190 countries, against the general trade analysis, which identifies the biggest importer or exporter.
To discover high-growth global markets and optimize your business strategy:
Click Here
Pricing
- Single User License$ 1,995
- Department License$ 2,400
- Site License$ 3,120
- Global License$ 3,795

Leadership Perspectives from Industry Events
Search
Thought Leadership and Analyst Meet


Our Clients
6WResearch In News
- Doha a strategic location for EV manufacturing hub: IPA Qatar
- Demand for luxury TVs surging in the GCC, says Samsung
- Empowering Growth: The Thriving Journey of Bangladesh’s Cable Industry
- Demand for luxury TVs surging in the GCC, says Samsung
- Video call with a traditional healer? Once unthinkable, it’s now common in South Africa
- Intelligent Buildings To Smooth GCC’s Path To Net Zero
Latest Reports
- Taiwan Airport Wireless Infrastructure Market (2026-2032)
- Vietnam Airport Wireless Infrastructure Market (2026-2032)
- Thailand Airport Wireless Infrastructure Market (2026-2032)
- South Korea Airport Wireless Infrastructure Market (2026-2032)
- Romania Airport Wireless Infrastructure Market (2026-2032)
- Qatar Airport Wireless Infrastructure Market (2026-2032)
- Philippines Airport Wireless Infrastructure Market (2026-2032)
- Japan Airport Wireless Infrastructure Market (2026-2032)
- Taiwan Airport Winter Services Market (2026-2032)
- Vietnam Airport Winter Services Market (2026-2032)
Industry Events and Analyst Meet

HIMTEX 2026

India Refining Summit 2026

India EV Show 2026

EV tech India Expo 2026

Auto Tech Asia 2026
Whitepaper
- Middle East & Africa Commercial Security Market Click here to view more.
- Middle East & Africa Fire Safety Systems & Equipment Market Click here to view more.
- GCC Drone Market Click here to view more.
- Middle East Lighting Fixture Market Click here to view more.
- GCC Physical & Perimeter Security Market Click here to view more.