Lithuania Marine Propulsion Engines Market (2026-2032) | Share, Competition, Value, Analysis, Industry, Investment Trends, Competitive, Revenue, Segmentation, Companies, Forecast, Segments, Drivers, Demand, Opportunities, Consumer Insights, Outlook, Trends, Size, Supply, Growth, Strategy, Challenges, Restraints, Pricing Analysis, Strategic Insights
Market Forecast By Type (Fully Electric, Hybrid, Fuel Cell), By Propulsion System (Lithium-Ion, Lead-Acid, Hydrogen), By Battery Type (Yachts, Cargo Ships, Submarines), By Application (Leisure Boats, Commercial Vessels, Military Operations) And Competitive Landscape
| Product Code: ETC12921018 | Publication Date: Apr 2025 | Updated Date: Apr 2026 | Product Type: Market Research Report | |
| Publisher: 6Wresearch | Author: Sachin Kumar Rai | No. of Pages: 65 | No. of Figures: 34 | No. of Tables: 19 |
Lithuania Marine Propulsion Engines Market Size (2020-2030)
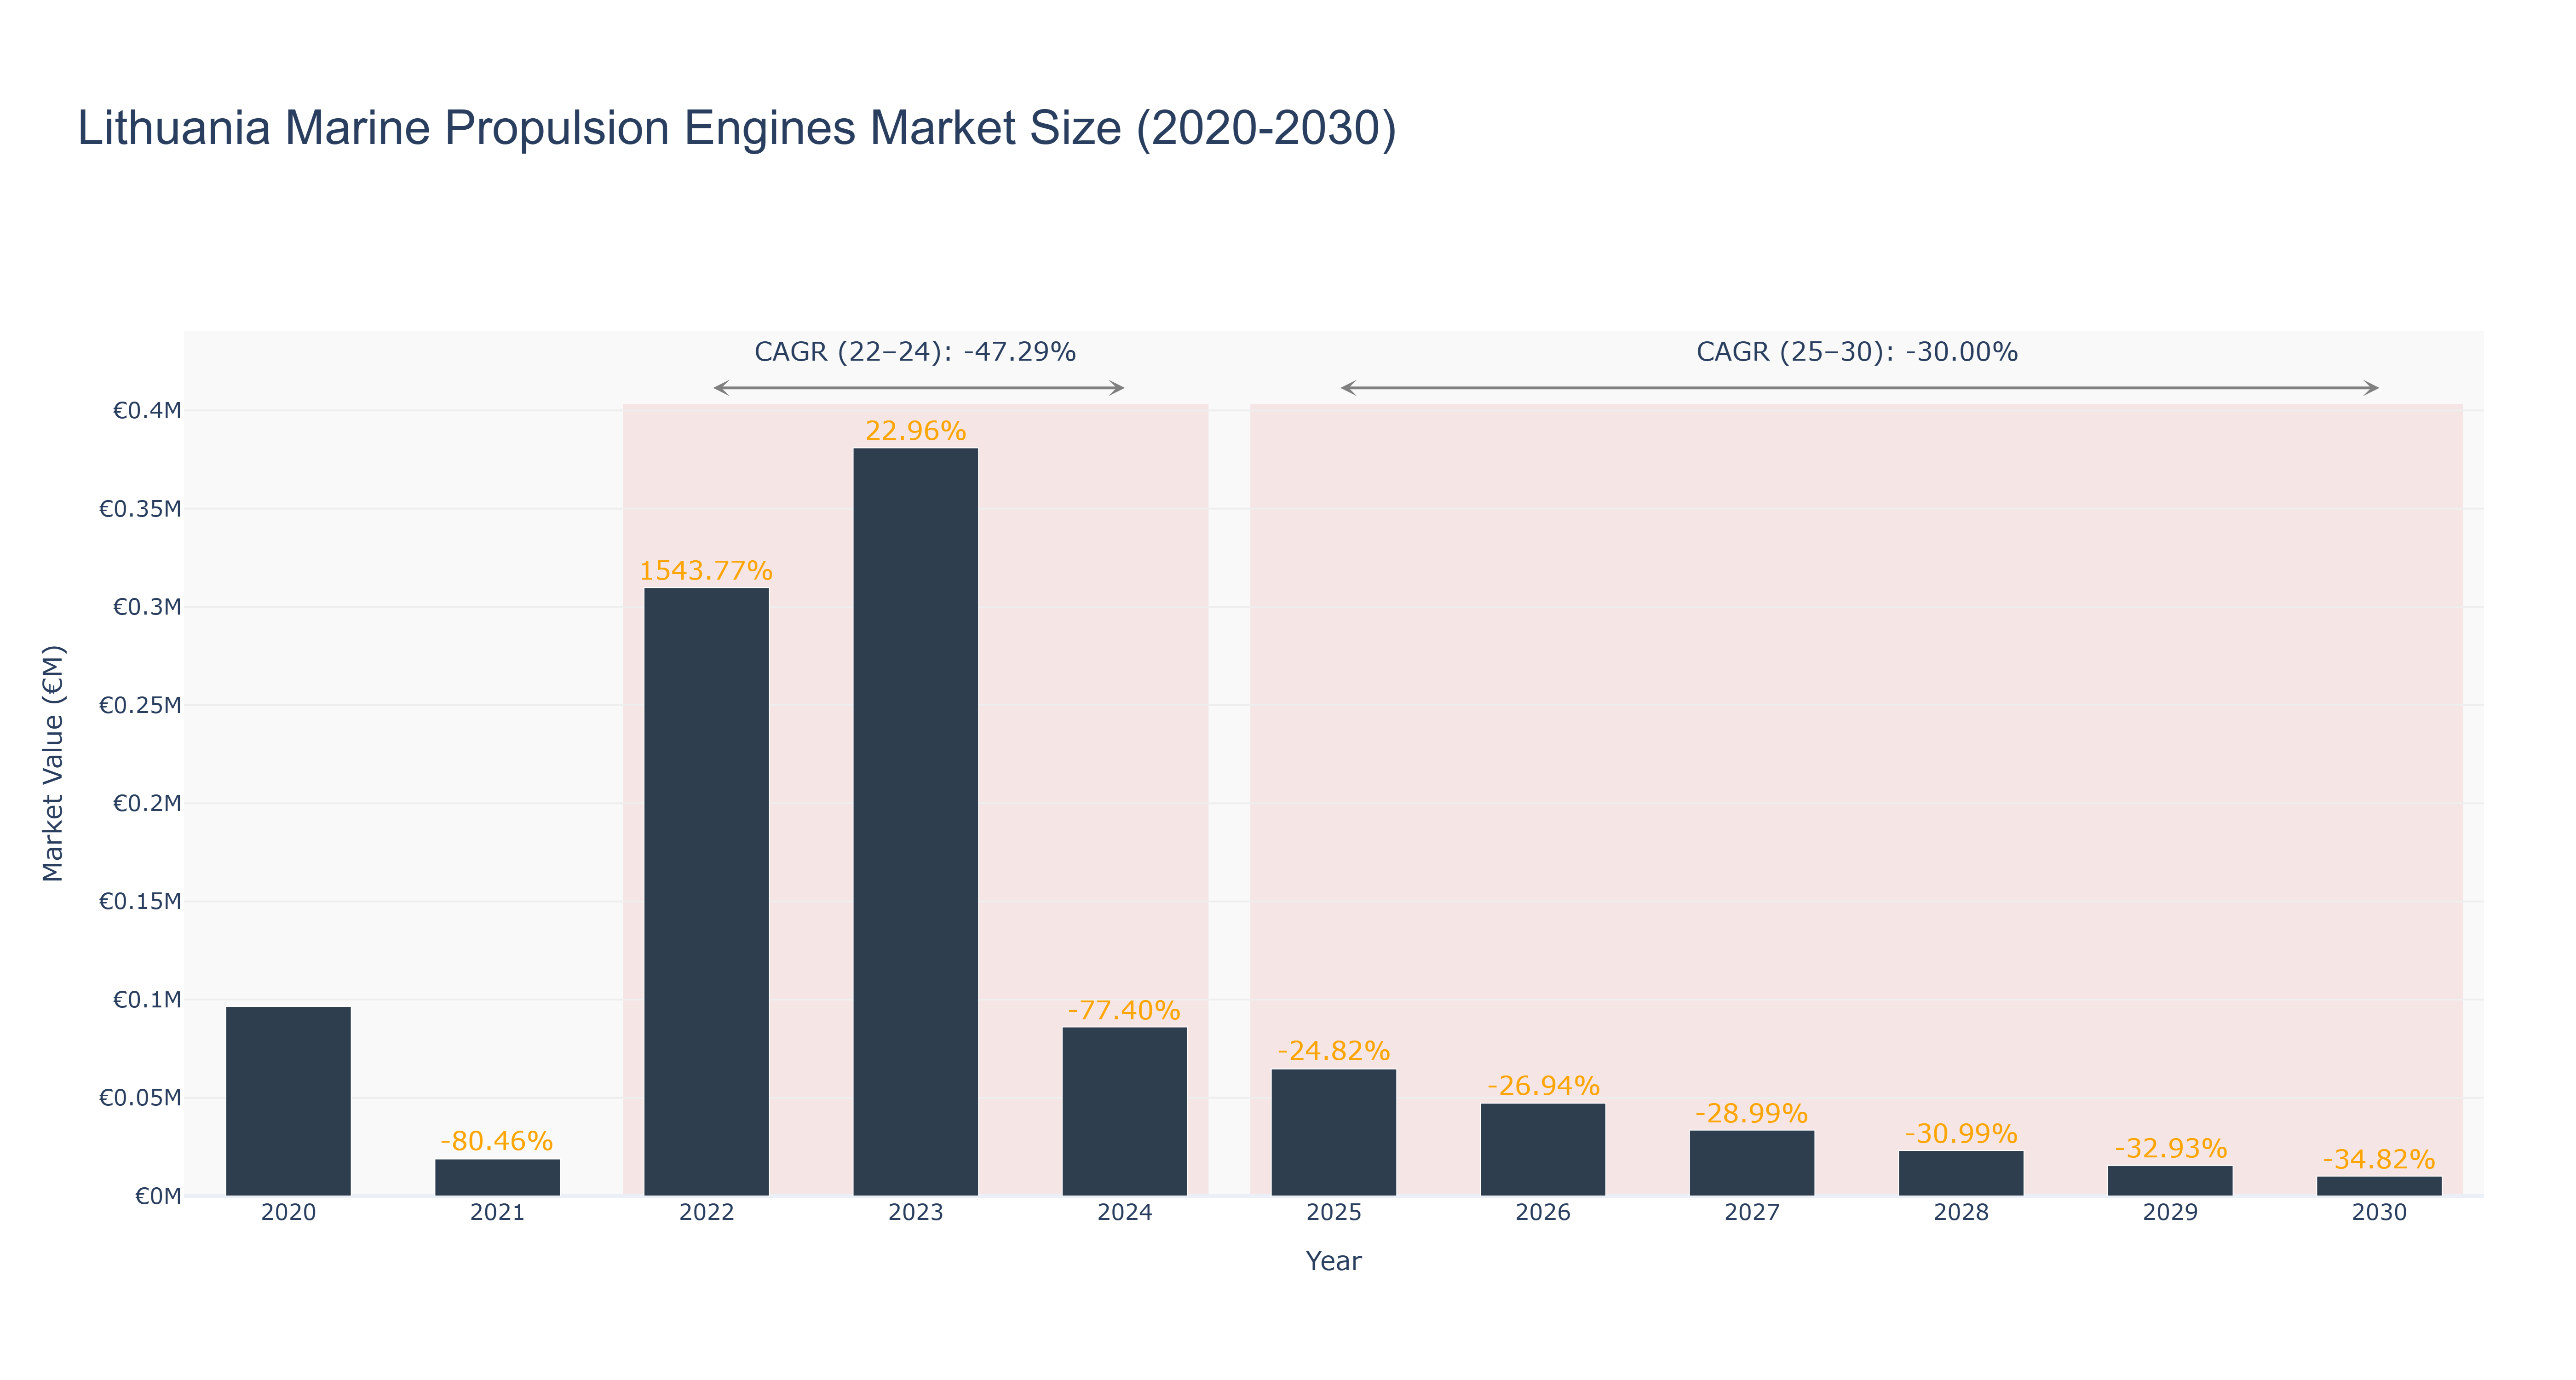
The Lithuania Marine Propulsion Engines Market experienced a peak market size of €0.38 million in 2023, followed by a significant decline to €0.09 million in 2024. This sharp decrease can be attributed to a negative CAGR of -47.29% from 2022 to 2024. The market continued to contract, reaching €0.06 million in 2025 and is forecasted to further decrease to €0.01 million by 2030, with a CAGR of -30.0% from 2025 to 2030. The downturn in the market can be linked to factors such as economic instability, technological advancements leading to more efficient engines, and shifting consumer preferences towards greener alternatives. Looking ahead, Lithuania is set to invest in renewable energy projects, potentially impacting the marine propulsion sector positively by creating demand for eco-friendly propulsion solutions in the near future.
Lithuania Marine Propulsion Engines Market: Production & Trade Performance (2019-2025)
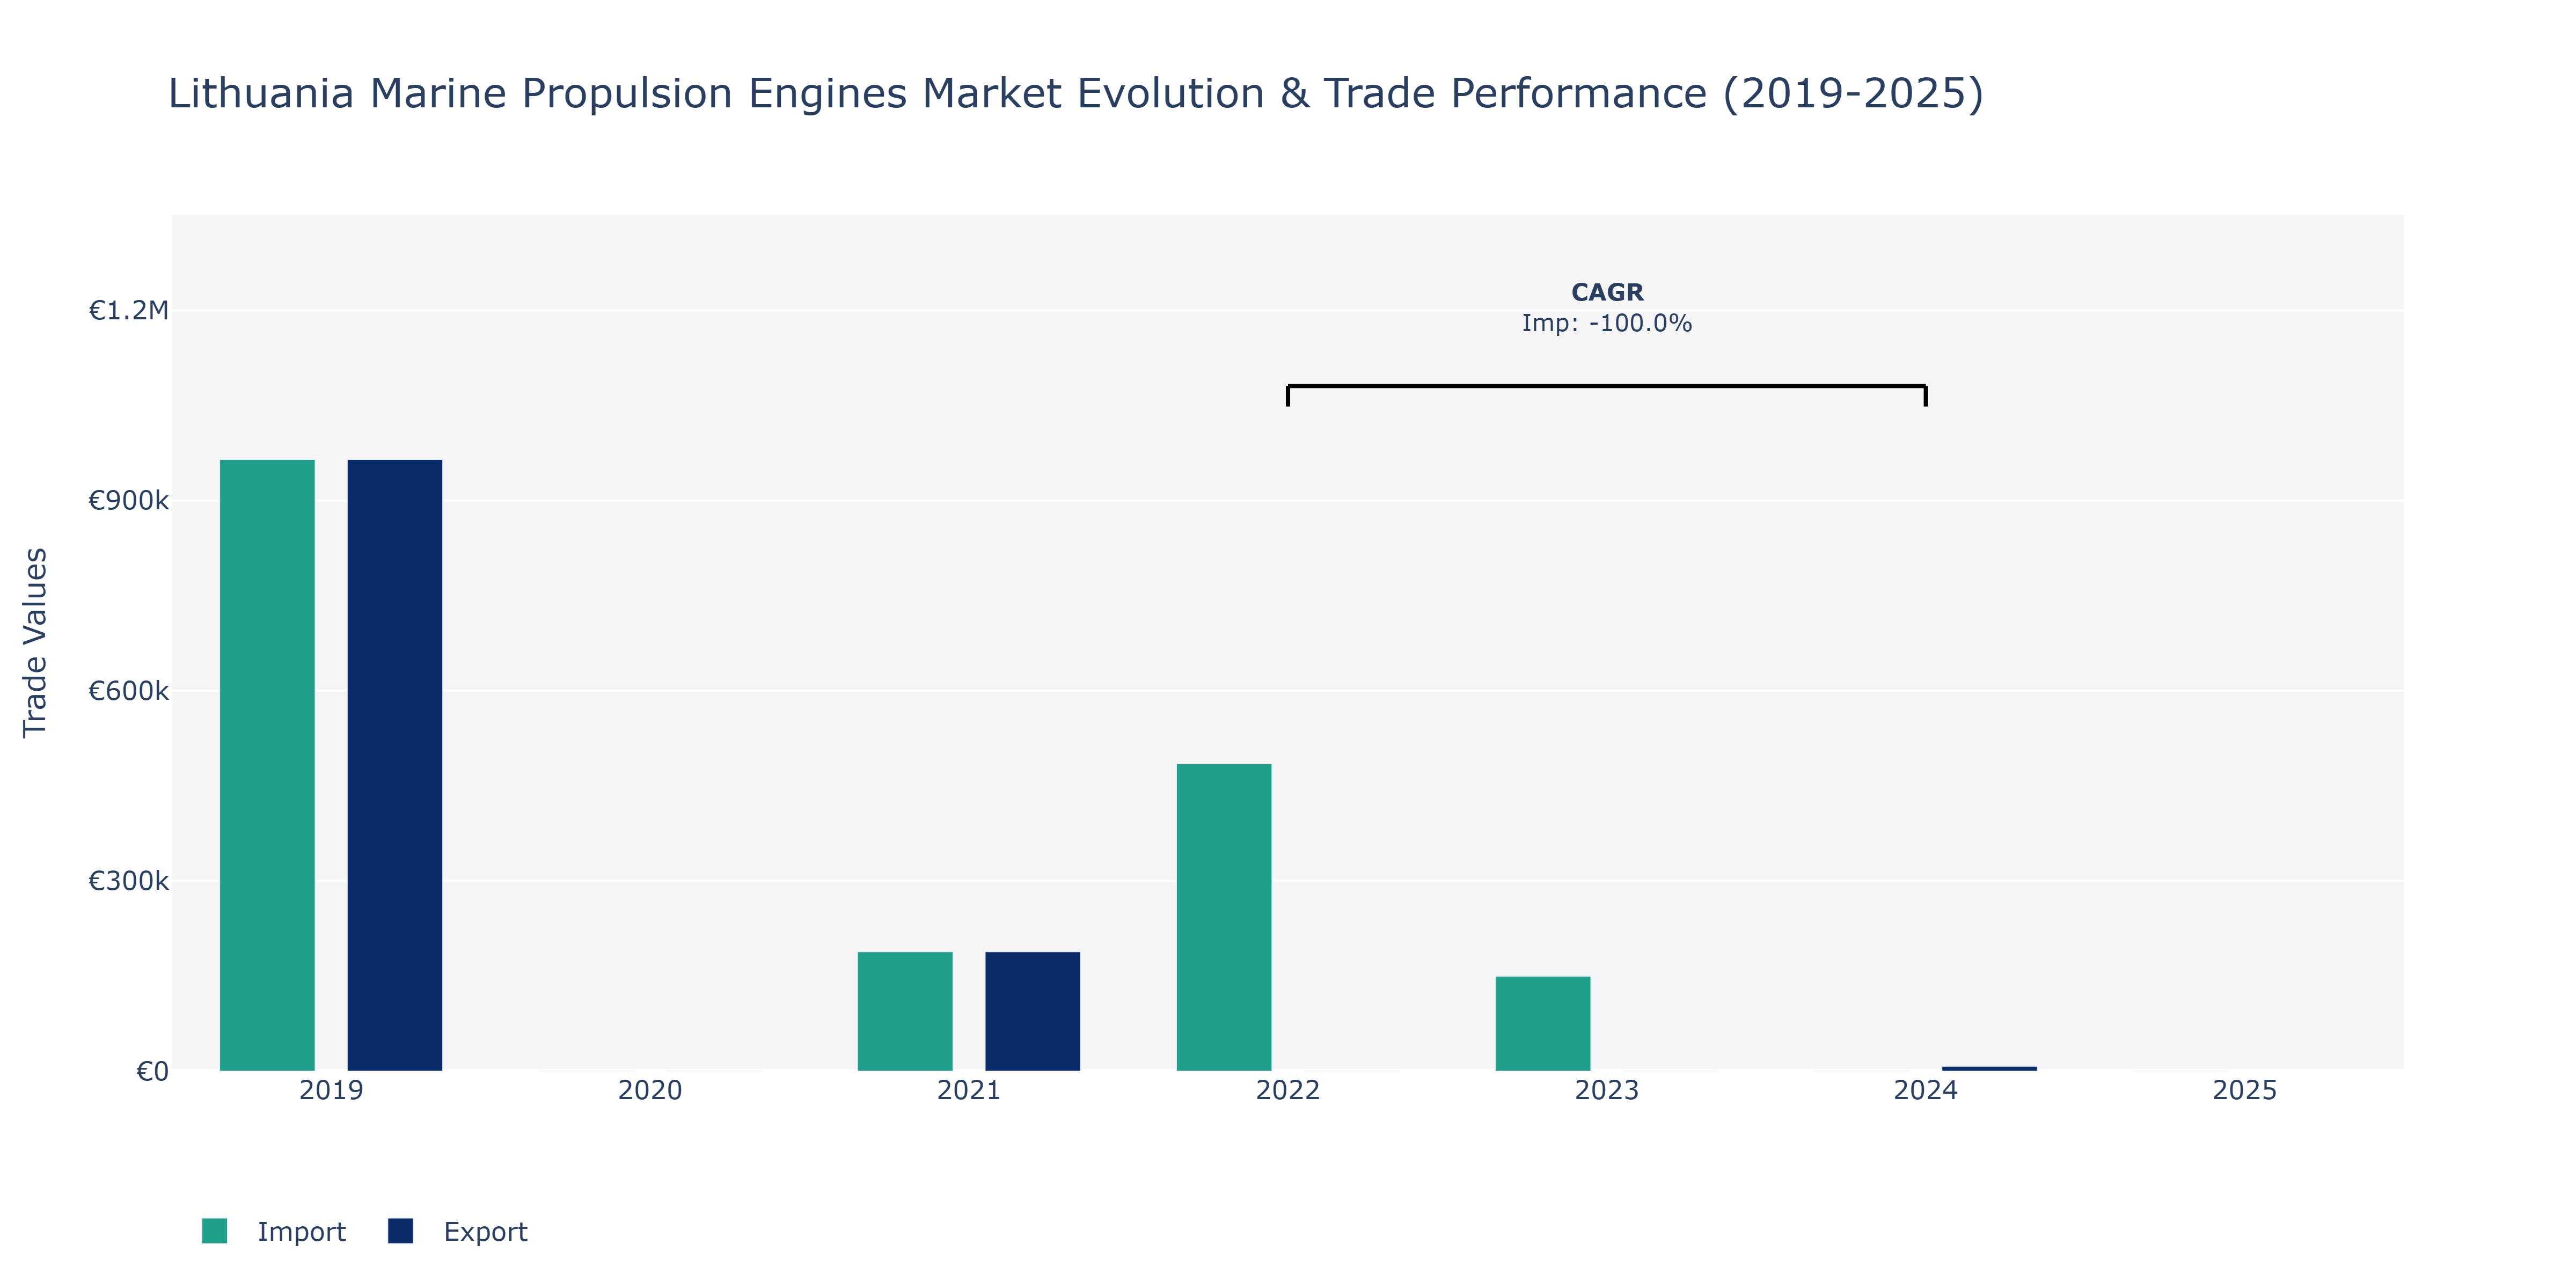
Between 2019 and 2024, the Lithuania Marine Propulsion Engines Market witnessed notable fluctuations in both exports and imports. In 2019, both exports and imports stood at €964.89 thousand, indicating a balanced trade scenario. By 2021, figures dropped to €188.5 thousand, reflecting a sharp decline. The year 2022 saw imports spike to €485.0 thousand, while exports plummeted to €7.83 thousand in 2024. Such contrasting trends suggest a shift in market dynamics. The decline in exports could be attributed to decreased demand or increased competition from other markets, leading domestic suppliers to focus more on imports to meet local demands for marine propulsion engines. This market behavior underscores the importance of strategic planning to adapt to changing market conditions. Efforts to enhance product competitiveness, streamline supply chains, and explore new export markets could help Lithuania's marine propulsion engine sector regain its footing.
Key Highlights of the Report:
- Lithuania Marine Propulsion Engines Market Outlook
- Market Size of Lithuania Marine Propulsion Engines Market, 2025
- Forecast of Lithuania Marine Propulsion Engines Market, 2032
- Historical Data and Forecast of Lithuania Marine Propulsion Engines Revenues & Volume for the Period 2022 - 2032F
- Lithuania Marine Propulsion Engines Market Trend Evolution
- Lithuania Marine Propulsion Engines Market Drivers and Challenges
- Lithuania Marine Propulsion Engines Price Trends
- Lithuania Marine Propulsion Engines Porter's Five Forces
- Lithuania Marine Propulsion Engines Industry Life Cycle
- Historical Data and Forecast of Lithuania Marine Propulsion Engines Market Revenues & Volume By Type for the Period 2022 - 2032F
- Historical Data and Forecast of Lithuania Marine Propulsion Engines Market Revenues & Volume By Fully Electric for the Period 2022 - 2032F
- Historical Data and Forecast of Lithuania Marine Propulsion Engines Market Revenues & Volume By Hybrid for the Period 2022 - 2032F
- Historical Data and Forecast of Lithuania Marine Propulsion Engines Market Revenues & Volume By Fuel Cell for the Period 2022 - 2032F
- Historical Data and Forecast of Lithuania Marine Propulsion Engines Market Revenues & Volume By Propulsion System for the Period 2022 - 2032F
- Historical Data and Forecast of Lithuania Marine Propulsion Engines Market Revenues & Volume By Lithium-Ion for the Period 2022 - 2032F
- Historical Data and Forecast of Lithuania Marine Propulsion Engines Market Revenues & Volume By Lead-Acid for the Period 2022 - 2032F
- Historical Data and Forecast of Lithuania Marine Propulsion Engines Market Revenues & Volume By Hydrogen for the Period 2022 - 2032F
- Historical Data and Forecast of Lithuania Marine Propulsion Engines Market Revenues & Volume By Battery Type for the Period 2022 - 2032F
- Historical Data and Forecast of Lithuania Marine Propulsion Engines Market Revenues & Volume By Yachts for the Period 2022 - 2032F
- Historical Data and Forecast of Lithuania Marine Propulsion Engines Market Revenues & Volume By Cargo Ships for the Period 2022 - 2032F
- Historical Data and Forecast of Lithuania Marine Propulsion Engines Market Revenues & Volume By Submarines for the Period 2022 - 2032F
- Historical Data and Forecast of Lithuania Marine Propulsion Engines Market Revenues & Volume By Application for the Period 2022 - 2032F
- Historical Data and Forecast of Lithuania Marine Propulsion Engines Market Revenues & Volume By Leisure Boats for the Period 2022 - 2032F
- Historical Data and Forecast of Lithuania Marine Propulsion Engines Market Revenues & Volume By Commercial Vessels for the Period 2022 - 2032F
- Historical Data and Forecast of Lithuania Marine Propulsion Engines Market Revenues & Volume By Military Operations for the Period 2022 - 2032F
- Lithuania Marine Propulsion Engines Import Export Trade Statistics
- Market Opportunity Assessment By Type
- Market Opportunity Assessment By Propulsion System
- Market Opportunity Assessment By Battery Type
- Market Opportunity Assessment By Application
- Lithuania Marine Propulsion Engines Top Companies Market Share
- Lithuania Marine Propulsion Engines Competitive Benchmarking By Technical and Operational Parameters
- Lithuania Marine Propulsion Engines Company Profiles
- Lithuania Marine Propulsion Engines Key Strategic Recommendations
Frequently Asked Questions About the Market Study (FAQs):
6Wresearch actively monitors the Lithuania Marine Propulsion Engines Market and publishes its comprehensive annual report, highlighting emerging trends, growth drivers, revenue analysis, and forecast outlook. Our insights help businesses to make data-backed strategic decisions with ongoing market dynamics. Our analysts track relevent industries related to the Lithuania Marine Propulsion Engines Market, allowing our clients with actionable intelligence and reliable forecasts tailored to emerging regional needs.
Yes, we provide customisation as per your requirements. To learn more, feel free to contact us on sales@6wresearch.com
1 Executive Summary |
2 Introduction |
2.1 Key Highlights of the Report |
2.2 Report Description |
2.3 Market Scope & Segmentation |
2.4 Research Methodology |
2.5 Assumptions |
3 Lithuania Marine Propulsion Engines Market Overview |
3.1 Lithuania Country Macro Economic Indicators |
3.2 Lithuania Marine Propulsion Engines Market Revenues & Volume, 2022 & 2032F |
3.3 Lithuania Marine Propulsion Engines Market - Industry Life Cycle |
3.4 Lithuania Marine Propulsion Engines Market - Porter's Five Forces |
3.5 Lithuania Marine Propulsion Engines Market Revenues & Volume Share, By Type, 2022 & 2032F |
3.6 Lithuania Marine Propulsion Engines Market Revenues & Volume Share, By Propulsion System, 2022 & 2032F |
3.7 Lithuania Marine Propulsion Engines Market Revenues & Volume Share, By Battery Type, 2022 & 2032F |
3.8 Lithuania Marine Propulsion Engines Market Revenues & Volume Share, By Application, 2022 & 2032F |
4 Lithuania Marine Propulsion Engines Market Dynamics |
4.1 Impact Analysis |
4.2 Market Drivers |
4.2.1 Increase in demand for commercial shipping activities in Lithuania |
4.2.2 Government initiatives promoting the use of environmentally friendly propulsion engines |
4.2.3 Growth in the tourism industry leading to higher demand for marine transportation services |
4.3 Market Restraints |
4.3.1 High initial investment costs for adopting new propulsion engine technologies |
4.3.2 Fluctuating fuel prices impacting operational costs for marine transportation companies |
5 Lithuania Marine Propulsion Engines Market Trends |
6 Lithuania Marine Propulsion Engines Market, By Types |
6.1 Lithuania Marine Propulsion Engines Market, By Type |
6.1.1 Overview and Analysis |
6.1.2 Lithuania Marine Propulsion Engines Market Revenues & Volume, By Type, 2022 - 2032F |
6.1.3 Lithuania Marine Propulsion Engines Market Revenues & Volume, By Fully Electric, 2022 - 2032F |
6.1.4 Lithuania Marine Propulsion Engines Market Revenues & Volume, By Hybrid, 2022 - 2032F |
6.1.5 Lithuania Marine Propulsion Engines Market Revenues & Volume, By Fuel Cell, 2022 - 2032F |
6.2 Lithuania Marine Propulsion Engines Market, By Propulsion System |
6.2.1 Overview and Analysis |
6.2.2 Lithuania Marine Propulsion Engines Market Revenues & Volume, By Lithium-Ion, 2022 - 2032F |
6.2.3 Lithuania Marine Propulsion Engines Market Revenues & Volume, By Lead-Acid, 2022 - 2032F |
6.2.4 Lithuania Marine Propulsion Engines Market Revenues & Volume, By Hydrogen, 2022 - 2032F |
6.3 Lithuania Marine Propulsion Engines Market, By Battery Type |
6.3.1 Overview and Analysis |
6.3.2 Lithuania Marine Propulsion Engines Market Revenues & Volume, By Yachts, 2022 - 2032F |
6.3.3 Lithuania Marine Propulsion Engines Market Revenues & Volume, By Cargo Ships, 2022 - 2032F |
6.3.4 Lithuania Marine Propulsion Engines Market Revenues & Volume, By Submarines, 2022 - 2032F |
6.4 Lithuania Marine Propulsion Engines Market, By Application |
6.4.1 Overview and Analysis |
6.4.2 Lithuania Marine Propulsion Engines Market Revenues & Volume, By Leisure Boats, 2022 - 2032F |
6.4.3 Lithuania Marine Propulsion Engines Market Revenues & Volume, By Commercial Vessels, 2022 - 2032F |
6.4.4 Lithuania Marine Propulsion Engines Market Revenues & Volume, By Military Operations, 2022 - 2032F |
7 Lithuania Marine Propulsion Engines Market Import-Export Trade Statistics |
7.1 Lithuania Marine Propulsion Engines Market Export to Major Countries |
7.2 Lithuania Marine Propulsion Engines Market Imports from Major Countries |
8 Lithuania Marine Propulsion Engines Market Key Performance Indicators |
8.1 Average age of propulsion engines in the Lithuania marine industry |
8.2 Adoption rate of eco-friendly propulsion technologies in the market |
8.3 Number of new ship registrations in Lithuania |
8.4 Average fuel consumption per vessel in the marine industry |
8.5 Number of shipbuilding projects in Lithuania’s maritime sector |
9 Lithuania Marine Propulsion Engines Market - Opportunity Assessment |
9.1 Lithuania Marine Propulsion Engines Market Opportunity Assessment, By Type, 2022 & 2032F |
9.2 Lithuania Marine Propulsion Engines Market Opportunity Assessment, By Propulsion System, 2022 & 2032F |
9.3 Lithuania Marine Propulsion Engines Market Opportunity Assessment, By Battery Type, 2022 & 2032F |
9.4 Lithuania Marine Propulsion Engines Market Opportunity Assessment, By Application, 2022 & 2032F |
10 Lithuania Marine Propulsion Engines Market - Competitive Landscape |
10.1 Lithuania Marine Propulsion Engines Market Revenue Share, By Companies, 2025 |
10.2 Lithuania Marine Propulsion Engines Market Competitive Benchmarking, By Operating and Technical Parameters |
11 Company Profiles |
12 Recommendations |
13 Disclaimer |
Export potential assessment - trade Analytics for 2030
Export potential enables firms to identify high-growth global markets with greater confidence by combining advanced trade intelligence with a structured quantitative methodology. The framework analyzes emerging demand trends and country-level import patterns while integrating macroeconomic and trade datasets such as GDP and population forecasts, bilateral import–export flows, tariff structures, elasticity differentials between developed and developing economies, geographic distance, and import demand projections. Using weighted trade values from 2020–2024 as the base period to project country-to-country export potential for 2030, these inputs are operationalized through calculated drivers such as gravity model parameters, tariff impact factors, and projected GDP per-capita growth. Through an analysis of hidden potentials, demand hotspots, and market conditions that are most favorable to success, this method enables firms to focus on target countries, maximize returns, and global expansion with data, backed by accuracy.
By factoring in the projected importer demand gap that is currently unmet and could be potential opportunity, it identifies the potential for the Exporter (Country) among 190 countries, against the general trade analysis, which identifies the biggest importer or exporter.
To discover high-growth global markets and optimize your business strategy:
Click Here
Pricing
- Single User License$ 1,995
- Department License$ 2,400
- Site License$ 3,120
- Global License$ 3,795

Search
Thought Leadership and Analyst Meet


Our Clients
Latest Reports
- Canada Cloud CFD Market (2026-2032) | Size & Revenue, Industry, Growth, Competitive Landscape, Forecast, Segmentation, Value, Outlook, Trends, Share, Analysis, Companies
- Taiwan Food Delivery Platform Market (2026-2032) | Companies, Outlook, Analysis, Trends, Value, Revenue, Segmentation, Share, Forecast, Competitive Landscape, Growth, Size & Forecast
- United Kingdom (UK) Long-term Care Insurance Market (2026-2032) | Growth, Share, Consumer Insights, Drivers, Opportunities, Competition, Pricing Analysis, Segments, Restraints, Companies, Competitive, Value, Outlook, Size, Demand, Analysis, Challenges, Strategic Insights, Investment Trends, Revenue, Trends, Supply, Forecast
- United Kingdom (UK) Long Term Care Market (2026-2032) | Companies, Outlook, Analysis, Trends, Value, Revenue, Segmentation, Share, Forecast, Competitive Landscape, Growth, Size & Forecast
- Iraq Insulation and Waterproofing Market (2026-2032) | Outlook, Drivers, Growth, Size, Share, Industry, Revenue, Trends, Demand, Competitive, Strategic Insights, Opportunities, Segments, Companies, Challenges, Strategy, Consumer Insights, Analysis, Investment Trends, Value, Segmentation, Forecast, Restraints
- India Switchgear Market Outlook (2026-2032) | Size, Share, Trends, Growth, Revenue, Forecast, Analysis, Value, Outlook
- Pakistan Contraceptive Implants Market (2025-2031) | Demand, Growth, Size, Share, Industry, Pricing Analysis, Competitive, Strategic Insights, Strategy, Consumer Insights, Analysis, Investment Trends, Opportunities, Revenue, Segments, Value, Segmentation, Supply, Forecast, Restraints, Outlook, Competition, Drivers, Trends, Companies, Challenges
- Sri Lanka Packaging Market (2026-2032) | Outlook, Competition, Drivers, Trends, Demand, Pricing Analysis, Competitive, Strategic Insights, Companies, Challenges, Strategy, Consumer Insights, Analysis, Investment Trends, Opportunities, Growth, Size, Share, Industry, Revenue, Segments, Value, Segmentation, Supply, Forecast, Restraints
- India Kids Watches Market (2026-2032) | Strategy, Consumer Insights, Analysis, Investment Trends, Opportunities, Growth, Size, Share, Industry, Revenue, Segments, Value, Segmentation, Supply, Forecast, Restraints, Outlook, Competition, Drivers, Trends, Demand, Pricing Analysis, Competitive, Strategic Insights, Companies, Challenges
- Saudi Arabia Core Assurance Service Market (2025-2031) | Strategy, Consumer Insights, Analysis, Investment Trends, Opportunities, Growth, Size, Share, Industry, Revenue, Segments, Value, Segmentation, Supply, Forecast, Restraints, Outlook, Competition, Drivers, Trends, Demand, Pricing Analysis, Competitive, Strategic Insights, Companies, Challenges
Industry Events and Analyst Meet

India EV Show 2026

EV tech India Expo 2026

Auto Tech Asia 2026

Battery Tech India 2026

Smart Production Solutions Guangzhou 2026
Whitepaper
- Middle East & Africa Commercial Security Market Click here to view more.
- Middle East & Africa Fire Safety Systems & Equipment Market Click here to view more.
- GCC Drone Market Click here to view more.
- Middle East Lighting Fixture Market Click here to view more.
- GCC Physical & Perimeter Security Market Click here to view more.
6WResearch In News
- Doha a strategic location for EV manufacturing hub: IPA Qatar
- Demand for luxury TVs surging in the GCC, says Samsung
- Empowering Growth: The Thriving Journey of Bangladesh’s Cable Industry
- Demand for luxury TVs surging in the GCC, says Samsung
- Video call with a traditional healer? Once unthinkable, it’s now common in South Africa
- Intelligent Buildings To Smooth GCC’s Path To Net Zero