Lithuania Methacrylic Acid Market (2026-2032) | Revenue, Industry, Analysis, Forecast, Value, Size, Share, Trends, Growth, Outlook, Segmentation & Companies
Market Forecast By Application (Paint and Adhesives, Fiber Processing Agent, Rubber Modifier, Leather Treatment, Paper Processing Agent, Lubricant Additive, Cement Mixing Agent, Others), By End-users (Paints and Coatings, Textile, Leather, Paper Manufacture, Construction, Automobiles, Electronics, Others), By Type (Liquid Products, Glacial Products) And Competitive Landscape
| Product Code: ETC4791517 | Publication Date: Nov 2023 | Updated Date: Apr 2026 | Product Type: Market Research Report | |
| Publisher: 6Wresearch | Author: Shubham Padhi | No. of Pages: 60 | No. of Figures: 30 | No. of Tables: 5 |
Lithuania Methacrylic Acid Market Size (2020-2030)
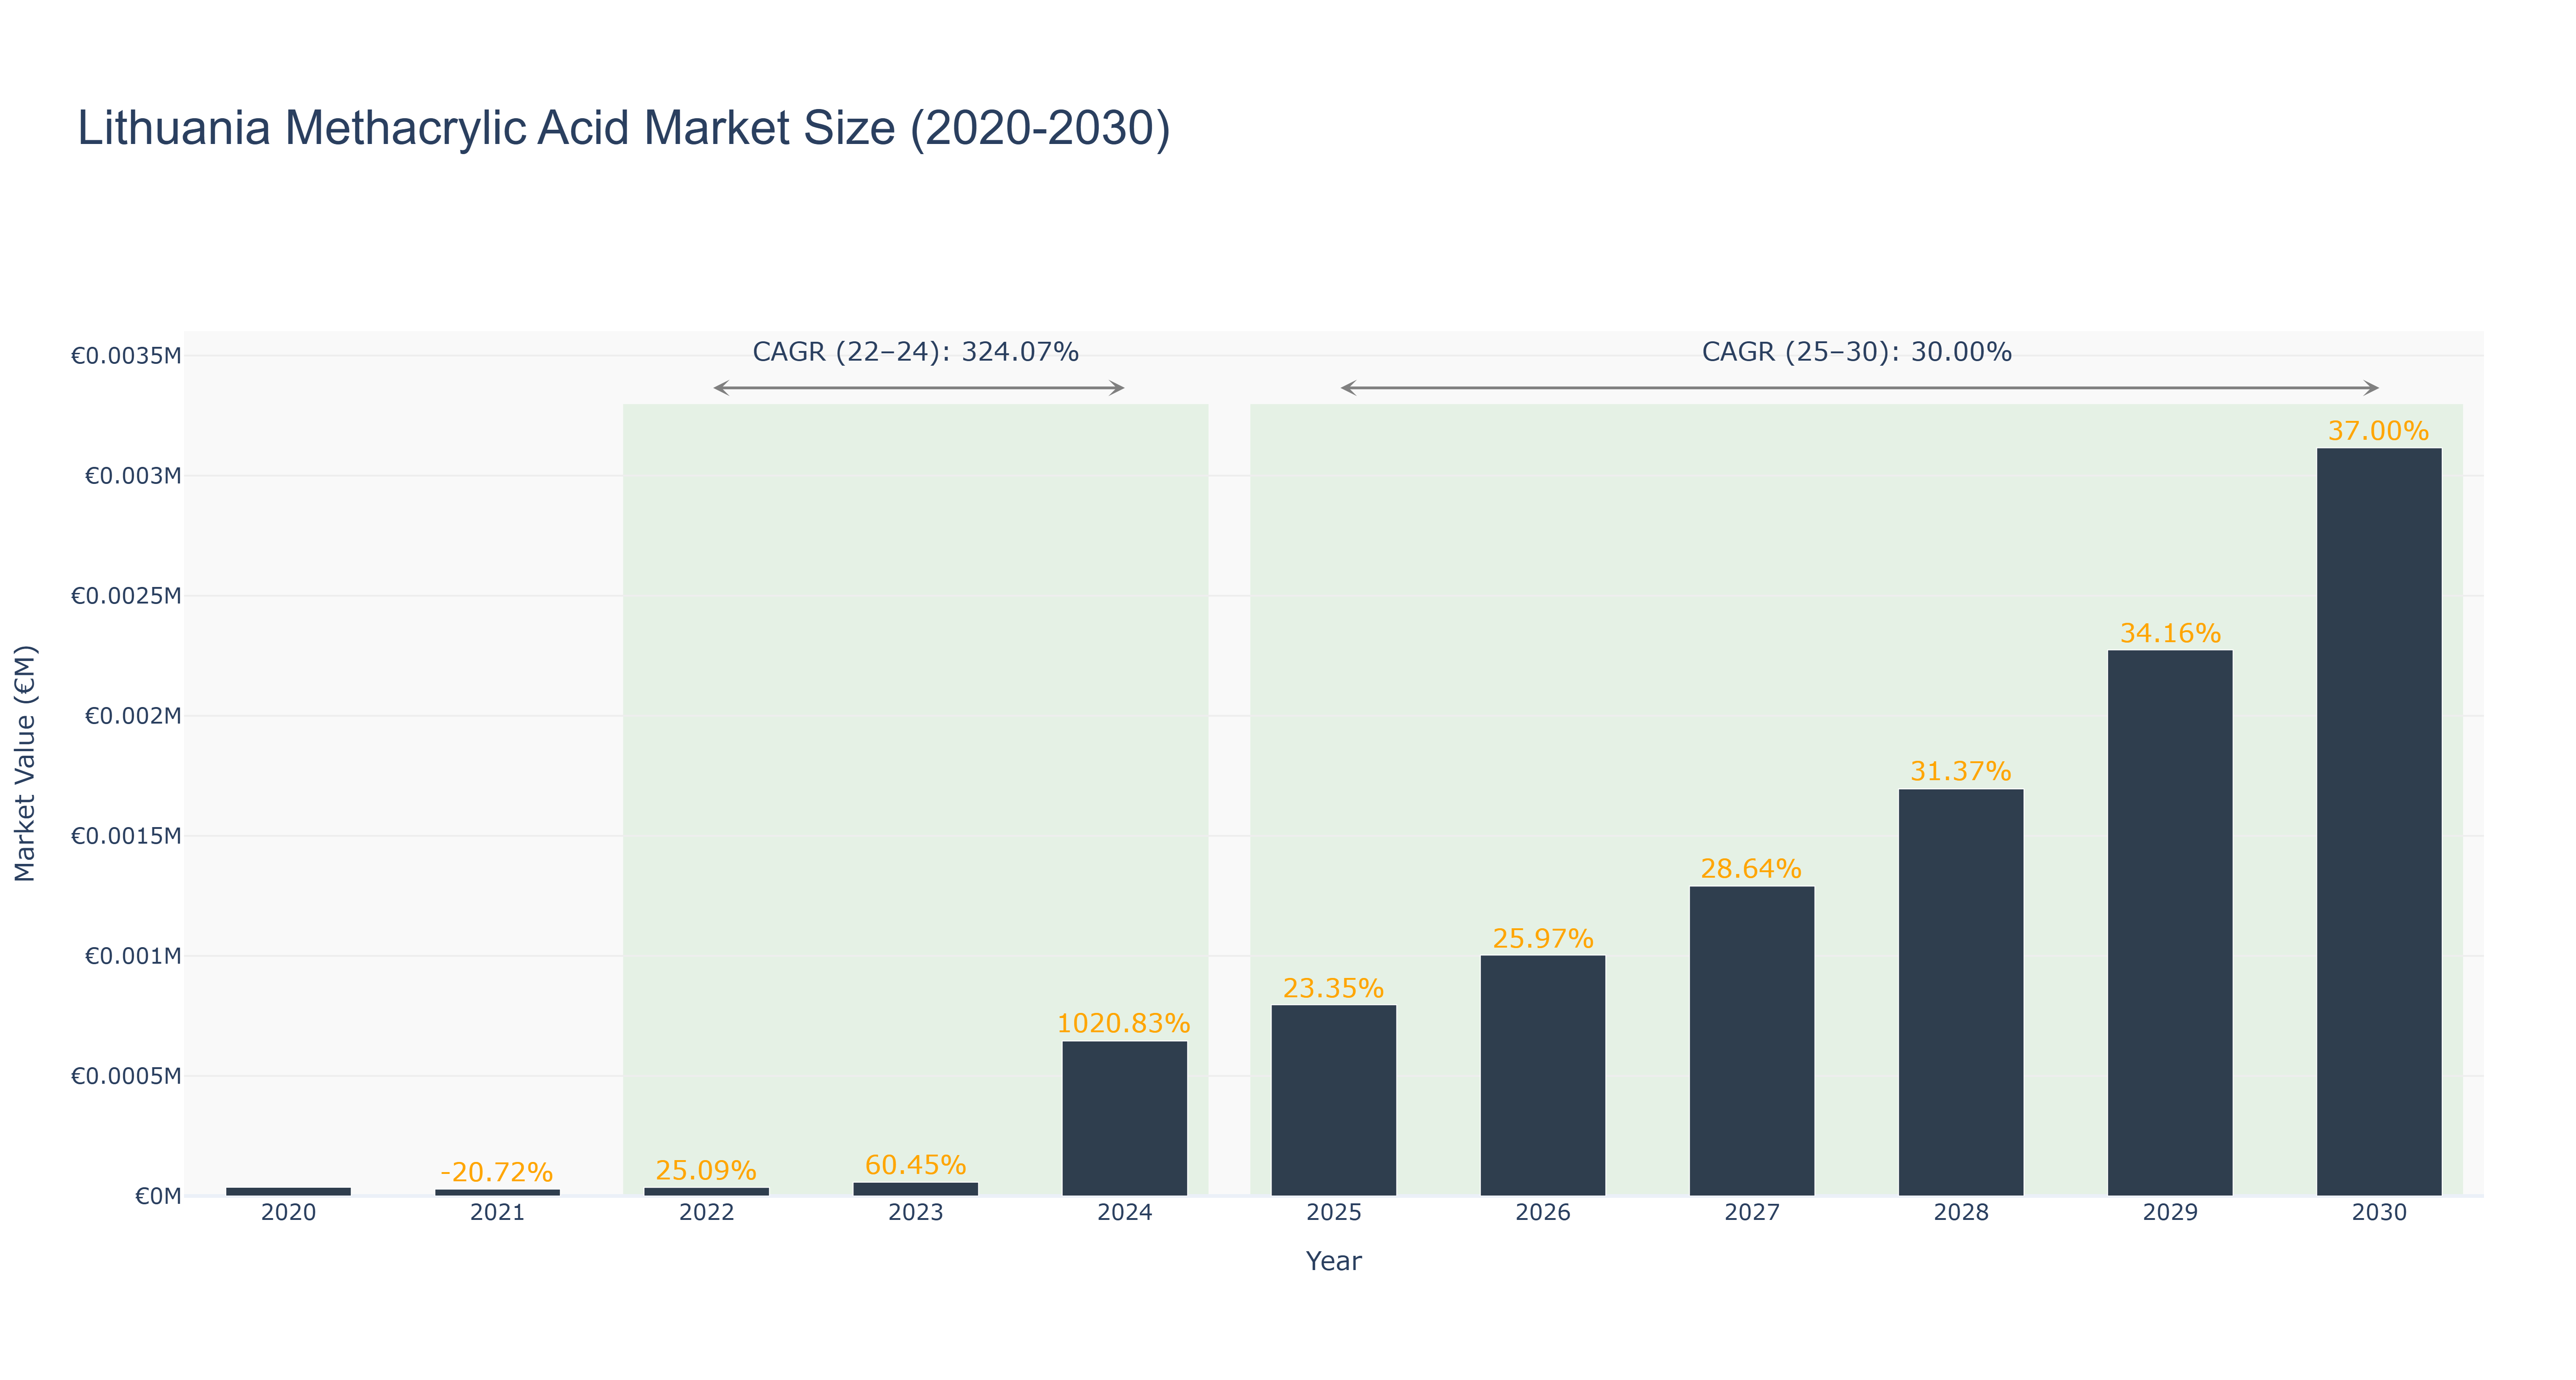
The Lithuania Methacrylic Acid Market has demonstrated a remarkable trajectory, characterized by significant fluctuations and robust growth. After a peak market size of €36.20 million in 2020, the market experienced a decline to €28.70 million in 2021, reflecting a -20.72% growth rate. However, a swift recovery ensued, with market sizes reaching €35.90 million in 2022 and €57.60 million in 2023, culminating in an extraordinary growth rate of 1020.83% in 2024, driven by rising demand in various applications such as coatings and adhesives. Looking ahead, the forecasted period from 2025 to 2030 anticipates a more stable growth trajectory, with projected market sizes increasing from €796.38 million in 2025 to €3.12 billion by 2030, reflecting a CAGR of 30.00%. This growth is likely fueled by ongoing advancements in manufacturing technologies and increased adoption across multiple industries, positioning Lithuania as a key player in the European methacrylic acid market.
Lithuania Methacrylic Acid Market: Production & Trade Performance (2019-2025)
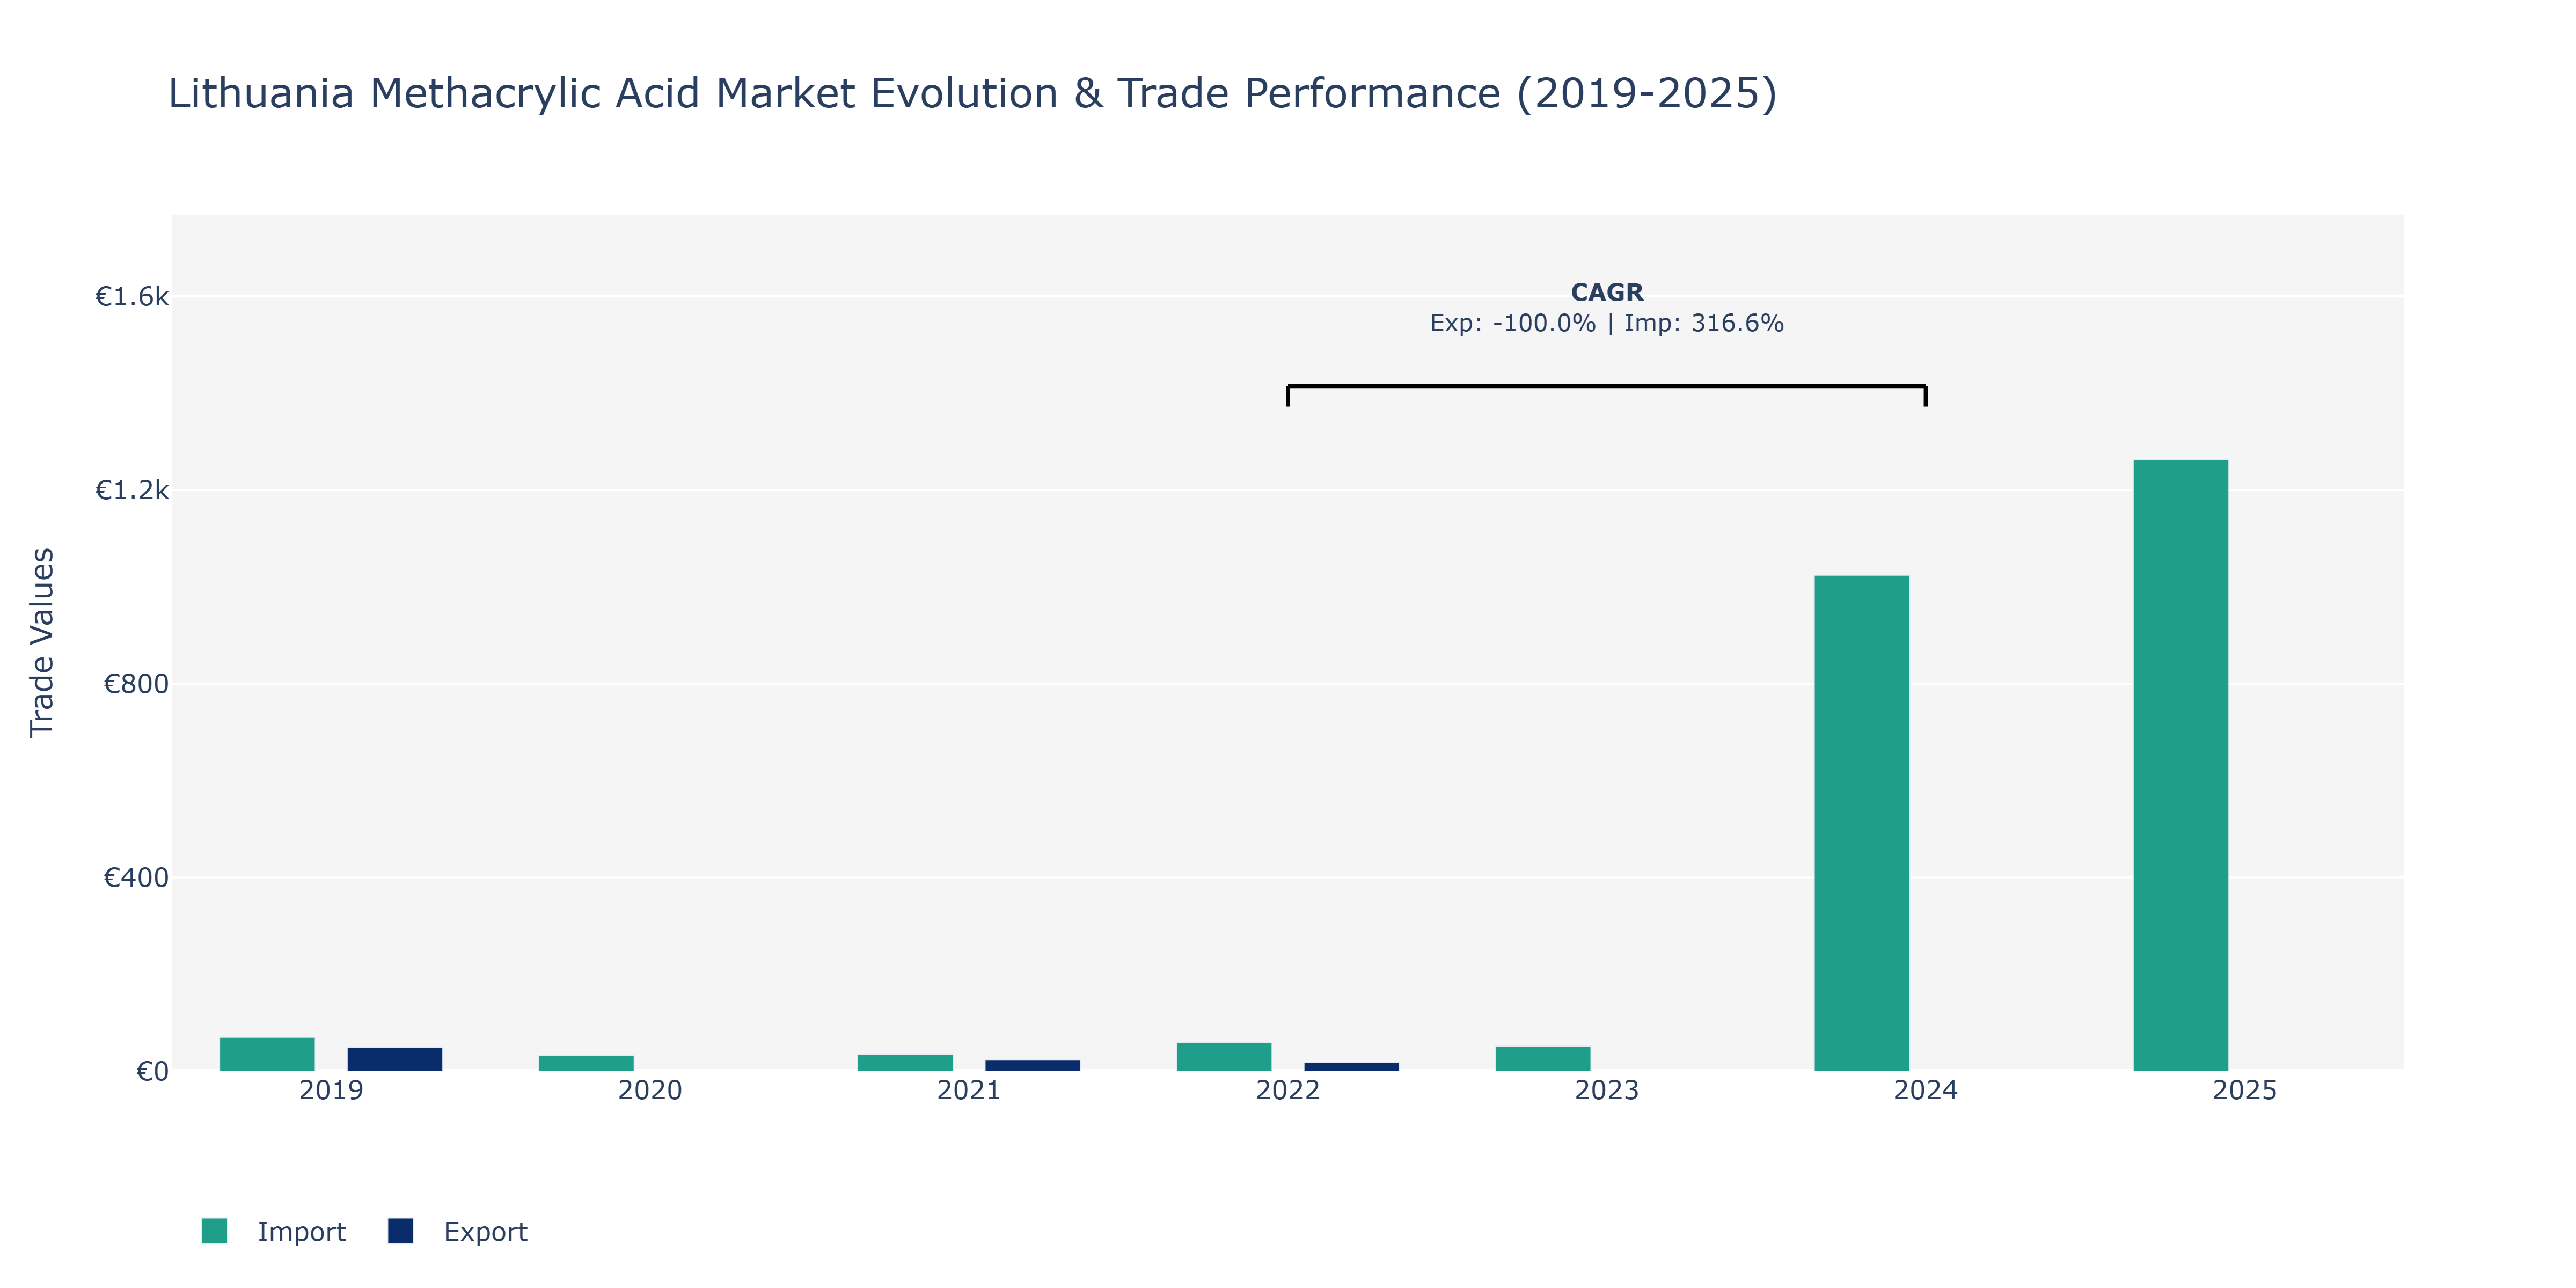
Between 2019 and 2025, Lithuania's Methacrylic Acid Market experienced fluctuations in both exports and imports. In 2019, exports were at €50 million, dropping to €23 million in 2021 before further declining to €18 million in 2022. On the other hand, imports stood at €70 million in 2019, decreased to €35 million in 2021, and then sharply rose to €1024 thousand in 2024 and €1263.1 thousand in 2025. The market saw a significant increase in imports starting in 2022, possibly due to heightened demand for methacrylic acid in sectors like automotive, construction, and electronics. The surge could be attributed to Lithuania's position as a key player in the chemical industry and its strategic location for trade within the European Union, driving the need for higher imports to support various industries and economic growth.
Key Highlights of the Report:
- Lithuania Methacrylic Acid Market Outlook
- Market Size of Lithuania Methacrylic Acid Market, 2025
- Forecast of Lithuania Methacrylic Acid Market, 2032
- Historical Data and Forecast of Lithuania Methacrylic Acid Revenues & Volume for the Period 2022 - 2032F
- Lithuania Methacrylic Acid Market Trend Evolution
- Lithuania Methacrylic Acid Market Drivers and Challenges
- Lithuania Methacrylic Acid Price Trends
- Lithuania Methacrylic Acid Porter`s Five Forces
- Lithuania Methacrylic Acid Industry Life Cycle
- Historical Data and Forecast of Lithuania Methacrylic Acid Market Revenues & Volume By Application for the Period 2022 - 2032F
- Historical Data and Forecast of Lithuania Methacrylic Acid Market Revenues & Volume By Paint and Adhesives for the Period 2022 - 2032F
- Historical Data and Forecast of Lithuania Methacrylic Acid Market Revenues & Volume By Fiber Processing Agent for the Period 2022 - 2032F
- Historical Data and Forecast of Lithuania Methacrylic Acid Market Revenues & Volume By Rubber Modifier for the Period 2022 - 2032F
- Historical Data and Forecast of Lithuania Methacrylic Acid Market Revenues & Volume By Leather Treatment for the Period 2022 - 2032F
- Historical Data and Forecast of Lithuania Methacrylic Acid Market Revenues & Volume By Paper Processing Agent for the Period 2022 - 2032F
- Historical Data and Forecast of Lithuania Methacrylic Acid Market Revenues & Volume By Lubricant Additive for the Period 2022 - 2032F
- Historical Data and Forecast of Lithuania Methacrylic Acid Market Revenues & Volume By Cement Mixing Agent for the Period 2022 - 2032F
- Historical Data and Forecast of Lithuania Paint and Adhesives Methacrylic Acid Market Revenues & Volume By Others for the Period 2022 - 2032F
- Historical Data and Forecast of Lithuania Methacrylic Acid Market Revenues & Volume By End-users for the Period 2022 - 2032F
- Historical Data and Forecast of Lithuania Methacrylic Acid Market Revenues & Volume By Paints and Coatings for the Period 2022 - 2032F
- Historical Data and Forecast of Lithuania Methacrylic Acid Market Revenues & Volume By Textile for the Period 2022 - 2032F
- Historical Data and Forecast of Lithuania Methacrylic Acid Market Revenues & Volume By Leather for the Period 2022 - 2032F
- Historical Data and Forecast of Lithuania Methacrylic Acid Market Revenues & Volume By Paper Manufacture for the Period 2022 - 2032F
- Historical Data and Forecast of Lithuania Methacrylic Acid Market Revenues & Volume By Construction for the Period 2022 - 2032F
- Historical Data and Forecast of Lithuania Methacrylic Acid Market Revenues & Volume By Automobiles for the Period 2022 - 2032F
- Historical Data and Forecast of Lithuania Methacrylic Acid Market Revenues & Volume By Electronics for the Period 2022 - 2032F
- Historical Data and Forecast of Lithuania Methacrylic Acid Market Revenues & Volume By Others for the Period 2022 - 2032F
- Historical Data and Forecast of Lithuania Methacrylic Acid Market Revenues & Volume By Type for the Period 2022 - 2032F
- Historical Data and Forecast of Lithuania Methacrylic Acid Market Revenues & Volume By Liquid Products for the Period 2022 - 2032F
- Historical Data and Forecast of Lithuania Methacrylic Acid Market Revenues & Volume By Glacial Products for the Period 2022 - 2032F
- Lithuania Methacrylic Acid Import Export Trade Statistics
- Market Opportunity Assessment By Application
- Market Opportunity Assessment By End-users
- Market Opportunity Assessment By Type
- Lithuania Methacrylic Acid Top Companies Market Share
- Lithuania Methacrylic Acid Competitive Benchmarking By Technical and Operational Parameters
- Lithuania Methacrylic Acid Company Profiles
- Lithuania Methacrylic Acid Key Strategic Recommendations
Frequently Asked Questions About the Market Study (FAQs):
6Wresearch actively monitors the Lithuania Methacrylic Acid Market and publishes its comprehensive annual report, highlighting emerging trends, growth drivers, revenue analysis, and forecast outlook. Our insights help businesses to make data-backed strategic decisions with ongoing market dynamics. Our analysts track relevent industries related to the Lithuania Methacrylic Acid Market, allowing our clients with actionable intelligence and reliable forecasts tailored to emerging regional needs.
Yes, we provide customisation as per your requirements. To learn more, feel free to contact us on sales@6wresearch.com
1 Executive Summary |
2 Introduction |
2.1 Key Highlights of the Report |
2.2 Report Description |
2.3 Market Scope & Segmentation |
2.4 Research Methodology |
2.5 Assumptions |
3 Lithuania Methacrylic Acid Market Overview |
3.1 Lithuania Country Macro Economic Indicators |
3.2 Lithuania Methacrylic Acid Market Revenues & Volume, 2022 & 2032F |
3.3 Lithuania Methacrylic Acid Market - Industry Life Cycle |
3.4 Lithuania Methacrylic Acid Market - Porter's Five Forces |
3.5 Lithuania Methacrylic Acid Market Revenues & Volume Share, By Application, 2022 & 2032F |
3.6 Lithuania Methacrylic Acid Market Revenues & Volume Share, By End-users, 2022 & 2032F |
3.7 Lithuania Methacrylic Acid Market Revenues & Volume Share, By Type, 2022 & 2032F |
4 Lithuania Methacrylic Acid Market Dynamics |
4.1 Impact Analysis |
4.2 Market Drivers |
4.2.1 Increasing demand for methacrylic acid in various industries such as automotive, construction, and electronics |
4.2.2 Growth in the manufacturing sector in Lithuania leading to higher consumption of methacrylic acid |
4.2.3 Favorable government regulations supporting the use of methacrylic acid in different applications |
4.3 Market Restraints |
4.3.1 Volatility in raw material prices impacting the production cost of methacrylic acid |
4.3.2 Competition from alternative materials affecting the market share of methacrylic acid in Lithuania |
5 Lithuania Methacrylic Acid Market Trends |
6 Lithuania Methacrylic Acid Market Segmentations |
6.1 Lithuania Methacrylic Acid Market, By Application |
6.1.1 Overview and Analysis |
6.1.2 Lithuania Methacrylic Acid Market Revenues & Volume, By Paint and Adhesives, 2022 - 2032F |
6.1.3 Lithuania Methacrylic Acid Market Revenues & Volume, By Fiber Processing Agent, 2022 - 2032F |
6.1.4 Lithuania Methacrylic Acid Market Revenues & Volume, By Rubber Modifier, 2022 - 2032F |
6.1.5 Lithuania Methacrylic Acid Market Revenues & Volume, By Leather Treatment, 2022 - 2032F |
6.1.6 Lithuania Methacrylic Acid Market Revenues & Volume, By Paper Processing Agent, 2022 - 2032F |
6.1.7 Lithuania Methacrylic Acid Market Revenues & Volume, By Lubricant Additive, 2022 - 2032F |
6.1.9 Lithuania Methacrylic Acid Market Revenues & Volume, By Others, 2022 - 2032F |
6.1.10 Lithuania Methacrylic Acid Market Revenues & Volume, By Others, 2022 - 2032F |
6.2 Lithuania Methacrylic Acid Market, By End-users |
6.2.1 Overview and Analysis |
6.2.2 Lithuania Methacrylic Acid Market Revenues & Volume, By Paints and Coatings, 2022 - 2032F |
6.2.3 Lithuania Methacrylic Acid Market Revenues & Volume, By Textile, 2022 - 2032F |
6.2.4 Lithuania Methacrylic Acid Market Revenues & Volume, By Leather, 2022 - 2032F |
6.2.5 Lithuania Methacrylic Acid Market Revenues & Volume, By Paper Manufacture, 2022 - 2032F |
6.2.6 Lithuania Methacrylic Acid Market Revenues & Volume, By Construction, 2022 - 2032F |
6.2.7 Lithuania Methacrylic Acid Market Revenues & Volume, By Automobiles, 2022 - 2032F |
6.2.8 Lithuania Methacrylic Acid Market Revenues & Volume, By Others, 2022 - 2032F |
6.2.9 Lithuania Methacrylic Acid Market Revenues & Volume, By Others, 2022 - 2032F |
6.3 Lithuania Methacrylic Acid Market, By Type |
6.3.1 Overview and Analysis |
6.3.2 Lithuania Methacrylic Acid Market Revenues & Volume, By Liquid Products, 2022 - 2032F |
6.3.3 Lithuania Methacrylic Acid Market Revenues & Volume, By Glacial Products, 2022 - 2032F |
7 Lithuania Methacrylic Acid Market Import-Export Trade Statistics |
7.1 Lithuania Methacrylic Acid Market Export to Major Countries |
7.2 Lithuania Methacrylic Acid Market Imports from Major Countries |
8 Lithuania Methacrylic Acid Market Key Performance Indicators |
8.1 Capacity utilization rate of methacrylic acid production plants in Lithuania |
8.2 Average selling price of methacrylic acid in the market |
8.3 Number of new applications or industries adopting methacrylic acid-based products in Lithuania |
9 Lithuania Methacrylic Acid Market - Opportunity Assessment |
9.1 Lithuania Methacrylic Acid Market Opportunity Assessment, By Application, 2022 & 2032F |
9.2 Lithuania Methacrylic Acid Market Opportunity Assessment, By End-users, 2022 & 2032F |
9.3 Lithuania Methacrylic Acid Market Opportunity Assessment, By Type, 2022 & 2032F |
10 Lithuania Methacrylic Acid Market - Competitive Landscape |
10.1 Lithuania Methacrylic Acid Market Revenue Share, By Companies, 2025 |
10.2 Lithuania Methacrylic Acid Market Competitive Benchmarking, By Operating and Technical Parameters |
11 Company Profiles |
12 Recommendations | 13 Disclaimer |
Global Go To Market Strategy - 2030
Export potential enables firms to identify high-growth global markets with greater confidence by combining advanced trade intelligence with a structured quantitative methodology. The framework analyzes emerging demand trends and country-level import patterns while integrating macroeconomic and trade datasets such as GDP and population forecasts, bilateral import–export flows, tariff structures, elasticity differentials between developed and developing economies, geographic distance, and import demand projections. Using weighted trade values from 2020–2024 as the base period to project country-to-country export potential for 2030, these inputs are operationalized through calculated drivers such as gravity model parameters, tariff impact factors, and projected GDP per-capita growth. Through an analysis of hidden potentials, demand hotspots, and market conditions that are most favorable to success, this method enables firms to focus on target countries, maximize returns, and global expansion with data, backed by accuracy.
By factoring in the projected importer demand gap that is currently unmet and could be potential opportunity, it identifies the potential for the Exporter (Country) among 190 countries, against the general trade analysis, which identifies the biggest importer or exporter.
To discover high-growth global markets and optimize your business strategy:
Click Here
Pricing
- Single User License$ 1,995
- Department License$ 2,400
- Site License$ 3,120
- Global License$ 3,795

Leadership Perspectives from Industry Events
Search
Thought Leadership and Analyst Meet


Our Clients
6WResearch In News
- Doha a strategic location for EV manufacturing hub: IPA Qatar
- Demand for luxury TVs surging in the GCC, says Samsung
- Empowering Growth: The Thriving Journey of Bangladesh’s Cable Industry
- Demand for luxury TVs surging in the GCC, says Samsung
- Video call with a traditional healer? Once unthinkable, it’s now common in South Africa
- Intelligent Buildings To Smooth GCC’s Path To Net Zero
Latest Reports
- Taiwan Airport Wireless Infrastructure Market (2026-2032)
- Vietnam Airport Wireless Infrastructure Market (2026-2032)
- Thailand Airport Wireless Infrastructure Market (2026-2032)
- South Korea Airport Wireless Infrastructure Market (2026-2032)
- Romania Airport Wireless Infrastructure Market (2026-2032)
- Qatar Airport Wireless Infrastructure Market (2026-2032)
- Philippines Airport Wireless Infrastructure Market (2026-2032)
- Japan Airport Wireless Infrastructure Market (2026-2032)
- Taiwan Airport Winter Services Market (2026-2032)
- Vietnam Airport Winter Services Market (2026-2032)
Industry Events and Analyst Meet

HIMTEX 2026

India Refining Summit 2026

India EV Show 2026

EV tech India Expo 2026

Auto Tech Asia 2026
Whitepaper
- Middle East & Africa Commercial Security Market Click here to view more.
- Middle East & Africa Fire Safety Systems & Equipment Market Click here to view more.
- GCC Drone Market Click here to view more.
- Middle East Lighting Fixture Market Click here to view more.
- GCC Physical & Perimeter Security Market Click here to view more.