Lithuania Mug Market (2025-2031) | Value, Forecast, Trends, Outlook, Industry, Growth, Segmentation, Companies, Size & Revenue, Competitive Landscape, Analysis, Share
Market Forecast By Materials (Strengthened Glass, True Porcelain, Vitreous Enamel, Stainless Steel, Plastic, Others), By Application (Shaving Mug, Tiki Mug, Travel Mug, Thermochromics Mug, Puzzle Mug, Others), By Distribution Channel (Online, Offline), By End use (Household, Office, Commuter, Sport, Others) And Competitive Landscape
| Product Code: ETC8045828 | Publication Date: Sep 2024 | Updated Date: Nov 2025 | Product Type: Market Research Report | |
| Publisher: 6Wresearch | Author: Dhaval Chaurasia | No. of Pages: 75 | No. of Figures: 35 | No. of Tables: 20 |
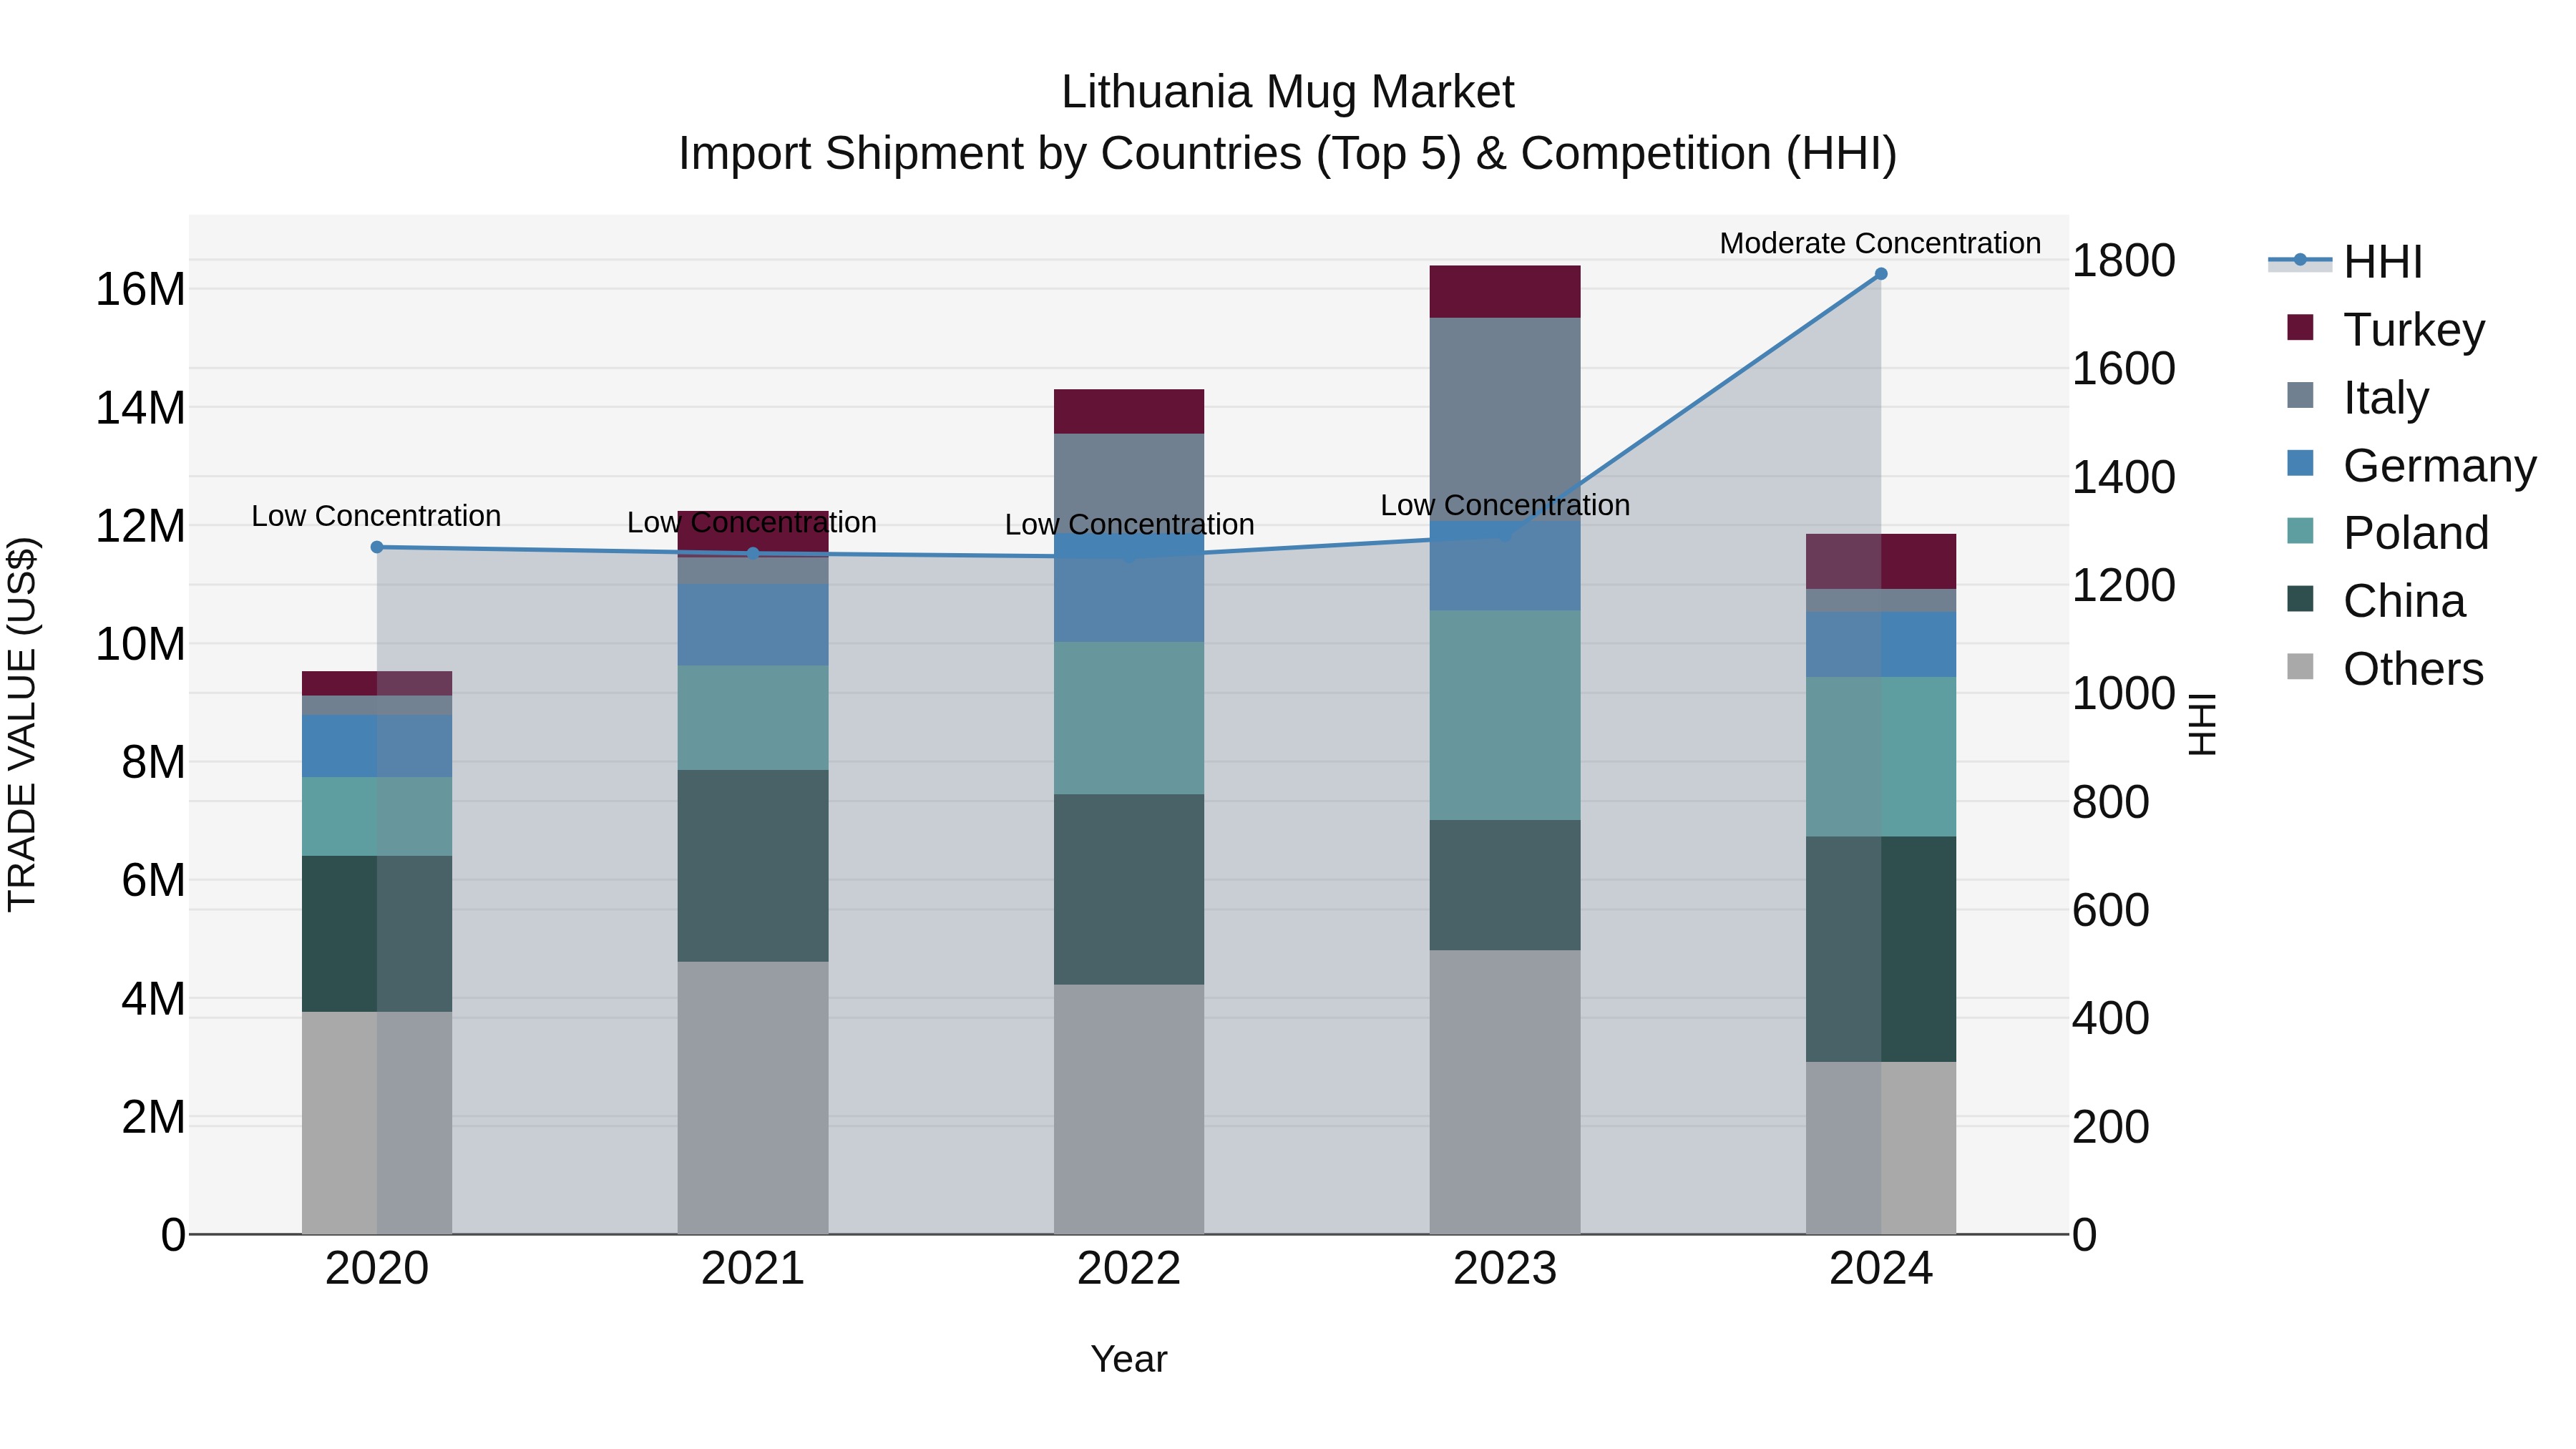
Lithuania Mug Market Top 5 Importing Countries and Market Competition (HHI) Analysis
In 2024, Lithuania saw an increase in the concentration of its mug import shipments, with top exporters being China, Poland, Germany, Turkey, and Latvia. Despite a decline in growth rate from the previous year, the compound annual growth rate (CAGR) remained positive at 5.62%. This shift towards moderate concentration indicates a potential shift in market dynamics and competition among exporters, highlighting the evolving landscape of the Lithuanian mug import market.
Key Highlights of the Report:
- Lithuania Mug Market Outlook
- Market Size of Lithuania Mug Market, 2024
- Forecast of Lithuania Mug Market, 2031
- Historical Data and Forecast of Lithuania Mug Revenues & Volume for the Period 2021- 2031
- Lithuania Mug Market Trend Evolution
- Lithuania Mug Market Drivers and Challenges
- Lithuania Mug Price Trends
- Lithuania Mug Porter's Five Forces
- Lithuania Mug Industry Life Cycle
- Historical Data and Forecast of Lithuania Mug Market Revenues & Volume By Materials for the Period 2021- 2031
- Historical Data and Forecast of Lithuania Mug Market Revenues & Volume By Strengthened Glass for the Period 2021- 2031
- Historical Data and Forecast of Lithuania Mug Market Revenues & Volume By True Porcelain for the Period 2021- 2031
- Historical Data and Forecast of Lithuania Mug Market Revenues & Volume By Vitreous Enamel for the Period 2021- 2031
- Historical Data and Forecast of Lithuania Mug Market Revenues & Volume By Stainless Steel for the Period 2021- 2031
- Historical Data and Forecast of Lithuania Mug Market Revenues & Volume By Plastic for the Period 2021- 2031
- Historical Data and Forecast of Lithuania Mug Market Revenues & Volume By Others for the Period 2021- 2031
- Historical Data and Forecast of Lithuania Mug Market Revenues & Volume By Application for the Period 2021- 2031
- Historical Data and Forecast of Lithuania Mug Market Revenues & Volume By Shaving Mug for the Period 2021- 2031
- Historical Data and Forecast of Lithuania Mug Market Revenues & Volume By Tiki Mug for the Period 2021- 2031
- Historical Data and Forecast of Lithuania Mug Market Revenues & Volume By Travel Mug for the Period 2021- 2031
- Historical Data and Forecast of Lithuania Mug Market Revenues & Volume By Thermochromics Mug for the Period 2021- 2031
- Historical Data and Forecast of Lithuania Mug Market Revenues & Volume By Puzzle Mug for the Period 2021- 2031
- Historical Data and Forecast of Lithuania Mug Market Revenues & Volume By Others for the Period 2021- 2031
- Historical Data and Forecast of Lithuania Mug Market Revenues & Volume By Distribution Channel for the Period 2021- 2031
- Historical Data and Forecast of Lithuania Mug Market Revenues & Volume By Online for the Period 2021- 2031
- Historical Data and Forecast of Lithuania Mug Market Revenues & Volume By Offline for the Period 2021- 2031
- Historical Data and Forecast of Lithuania Mug Market Revenues & Volume By End use for the Period 2021- 2031
- Historical Data and Forecast of Lithuania Mug Market Revenues & Volume By Household for the Period 2021- 2031
- Historical Data and Forecast of Lithuania Mug Market Revenues & Volume By Office for the Period 2021- 2031
- Historical Data and Forecast of Lithuania Mug Market Revenues & Volume By Commuter for the Period 2021- 2031
- Historical Data and Forecast of Lithuania Mug Market Revenues & Volume By Sport for the Period 2021- 2031
- Historical Data and Forecast of Lithuania Mug Market Revenues & Volume By Others for the Period 2021- 2031
- Lithuania Mug Import Export Trade Statistics
- Market Opportunity Assessment By Materials
- Market Opportunity Assessment By Application
- Market Opportunity Assessment By Distribution Channel
- Market Opportunity Assessment By End use
- Lithuania Mug Top Companies Market Share
- Lithuania Mug Competitive Benchmarking By Technical and Operational Parameters
- Lithuania Mug Company Profiles
- Lithuania Mug Key Strategic Recommendations
Frequently Asked Questions About the Market Study (FAQs):
6Wresearch actively monitors the Lithuania Mug Market and publishes its comprehensive annual report, highlighting emerging trends, growth drivers, revenue analysis, and forecast outlook. Our insights help businesses to make data-backed strategic decisions with ongoing market dynamics. Our analysts track relevent industries related to the Lithuania Mug Market, allowing our clients with actionable intelligence and reliable forecasts tailored to emerging regional needs.
Yes, we provide customisation as per your requirements. To learn more, feel free to contact us on sales@6wresearch.com
1 Executive Summary |
2 Introduction |
2.1 Key Highlights of the Report |
2.2 Report Description |
2.3 Market Scope & Segmentation |
2.4 Research Methodology |
2.5 Assumptions |
3 Lithuania Mug Market Overview |
3.1 Lithuania Country Macro Economic Indicators |
3.2 Lithuania Mug Market Revenues & Volume, 2021 & 2031F |
3.3 Lithuania Mug Market - Industry Life Cycle |
3.4 Lithuania Mug Market - Porter's Five Forces |
3.5 Lithuania Mug Market Revenues & Volume Share, By Materials, 2021 & 2031F |
3.6 Lithuania Mug Market Revenues & Volume Share, By Application, 2021 & 2031F |
3.7 Lithuania Mug Market Revenues & Volume Share, By Distribution Channel, 2021 & 2031F |
3.8 Lithuania Mug Market Revenues & Volume Share, By End use, 2021 & 2031F |
4 Lithuania Mug Market Dynamics |
4.1 Impact Analysis |
4.2 Market Drivers |
4.2.1 Increasing trend towards eco-friendly products, leading to a higher demand for sustainable materials in mugs. |
4.2.2 Growth in the food and beverage industry, driving the need for mugs in cafes, restaurants, and hotels. |
4.2.3 Rising popularity of personalized and custom-designed mugs, boosting sales in the market. |
4.3 Market Restraints |
4.3.1 Competition from alternative drinkware products like tumblers and water bottles. |
4.3.2 Fluctuating raw material prices impacting production costs and pricing strategies. |
4.3.3 Limited disposable income of consumers affecting their purchasing power for non-essential items like mugs. |
5 Lithuania Mug Market Trends |
6 Lithuania Mug Market, By Types |
6.1 Lithuania Mug Market, By Materials |
6.1.1 Overview and Analysis |
6.1.2 Lithuania Mug Market Revenues & Volume, By Materials, 2021- 2031F |
6.1.3 Lithuania Mug Market Revenues & Volume, By Strengthened Glass, 2021- 2031F |
6.1.4 Lithuania Mug Market Revenues & Volume, By True Porcelain, 2021- 2031F |
6.1.5 Lithuania Mug Market Revenues & Volume, By Vitreous Enamel, 2021- 2031F |
6.1.6 Lithuania Mug Market Revenues & Volume, By Stainless Steel, 2021- 2031F |
6.1.7 Lithuania Mug Market Revenues & Volume, By Plastic, 2021- 2031F |
6.1.8 Lithuania Mug Market Revenues & Volume, By Others, 2021- 2031F |
6.2 Lithuania Mug Market, By Application |
6.2.1 Overview and Analysis |
6.2.2 Lithuania Mug Market Revenues & Volume, By Shaving Mug, 2021- 2031F |
6.2.3 Lithuania Mug Market Revenues & Volume, By Tiki Mug, 2021- 2031F |
6.2.4 Lithuania Mug Market Revenues & Volume, By Travel Mug, 2021- 2031F |
6.2.5 Lithuania Mug Market Revenues & Volume, By Thermochromics Mug, 2021- 2031F |
6.2.6 Lithuania Mug Market Revenues & Volume, By Puzzle Mug, 2021- 2031F |
6.2.7 Lithuania Mug Market Revenues & Volume, By Others, 2021- 2031F |
6.3 Lithuania Mug Market, By Distribution Channel |
6.3.1 Overview and Analysis |
6.3.2 Lithuania Mug Market Revenues & Volume, By Online, 2021- 2031F |
6.3.3 Lithuania Mug Market Revenues & Volume, By Offline, 2021- 2031F |
6.4 Lithuania Mug Market, By End use |
6.4.1 Overview and Analysis |
6.4.2 Lithuania Mug Market Revenues & Volume, By Household, 2021- 2031F |
6.4.3 Lithuania Mug Market Revenues & Volume, By Office, 2021- 2031F |
6.4.4 Lithuania Mug Market Revenues & Volume, By Commuter, 2021- 2031F |
6.4.5 Lithuania Mug Market Revenues & Volume, By Sport, 2021- 2031F |
6.4.6 Lithuania Mug Market Revenues & Volume, By Others, 2021- 2031F |
7 Lithuania Mug Market Import-Export Trade Statistics |
7.1 Lithuania Mug Market Export to Major Countries |
7.2 Lithuania Mug Market Imports from Major Countries |
8 Lithuania Mug Market Key Performance Indicators |
8.1 Customer engagement metrics such as social media interactions, website visits, and email open rates related to new mug launches or promotions. |
8.2 Average order value (AOV) for mugs to track the willingness of customers to spend on higher-priced or premium designs. |
8.3 Return on investment (ROI) from marketing campaigns targeting specific customer segments or promoting new features of mugs. |
9 Lithuania Mug Market - Opportunity Assessment |
9.1 Lithuania Mug Market Opportunity Assessment, By Materials, 2021 & 2031F |
9.2 Lithuania Mug Market Opportunity Assessment, By Application, 2021 & 2031F |
9.3 Lithuania Mug Market Opportunity Assessment, By Distribution Channel, 2021 & 2031F |
9.4 Lithuania Mug Market Opportunity Assessment, By End use, 2021 & 2031F |
10 Lithuania Mug Market - Competitive Landscape |
10.1 Lithuania Mug Market Revenue Share, By Companies, 2024 |
10.2 Lithuania Mug Market Competitive Benchmarking, By Operating and Technical Parameters |
11 Company Profiles |
12 Recommendations |
13 Disclaimer |
Export potential assessment - trade Analytics for 2030
Export potential enables firms to identify high-growth global markets with greater confidence by combining advanced trade intelligence with a structured quantitative methodology. The framework analyzes emerging demand trends and country-level import patterns while integrating macroeconomic and trade datasets such as GDP and population forecasts, bilateral import–export flows, tariff structures, elasticity differentials between developed and developing economies, geographic distance, and import demand projections. Using weighted trade values from 2020–2024 as the base period to project country-to-country export potential for 2030, these inputs are operationalized through calculated drivers such as gravity model parameters, tariff impact factors, and projected GDP per-capita growth. Through an analysis of hidden potentials, demand hotspots, and market conditions that are most favorable to success, this method enables firms to focus on target countries, maximize returns, and global expansion with data, backed by accuracy.
By factoring in the projected importer demand gap that is currently unmet and could be potential opportunity, it identifies the potential for the Exporter (Country) among 190 countries, against the general trade analysis, which identifies the biggest importer or exporter.
To discover high-growth global markets and optimize your business strategy:
Click Here
Pricing
- Single User License$ 1,995
- Department License$ 2,400
- Site License$ 3,120
- Global License$ 3,795

Search
Thought Leadership and Analyst Meet


Our Clients
Latest Reports
- United Kingdom (UK) Long-term Care Insurance Market (2026-2032) | Growth, Share, Consumer Insights, Drivers, Opportunities, Competition, Pricing Analysis, Segments, Restraints, Companies, Competitive, Value, Outlook, Size, Demand, Analysis, Challenges, Strategic Insights, Investment Trends, Revenue, Trends, Supply, Forecast
- United Kingdom (UK) Long Term Care Market (2026-2032) | Companies, Outlook, Analysis, Trends, Value, Revenue, Segmentation, Share, Forecast, Competitive Landscape, Growth, Size & Forecast
- Iraq Insulation and Waterproofing Market (2026-2032) | Outlook, Drivers, Growth, Size, Share, Industry, Revenue, Trends, Demand, Competitive, Strategic Insights, Opportunities, Segments, Companies, Challenges, Strategy, Consumer Insights, Analysis, Investment Trends, Value, Segmentation, Forecast, Restraints
- India Switchgear Market Outlook (2026 - 2032) | Size, Share, Trends, Growth, Revenue, Forecast, Analysis, Value, Outlook
- Pakistan Contraceptive Implants Market (2025-2031) | Demand, Growth, Size, Share, Industry, Pricing Analysis, Competitive, Strategic Insights, Strategy, Consumer Insights, Analysis, Investment Trends, Opportunities, Revenue, Segments, Value, Segmentation, Supply, Forecast, Restraints, Outlook, Competition, Drivers, Trends, Companies, Challenges
- Sri Lanka Packaging Market (2026-2032) | Outlook, Competition, Drivers, Trends, Demand, Pricing Analysis, Competitive, Strategic Insights, Companies, Challenges, Strategy, Consumer Insights, Analysis, Investment Trends, Opportunities, Growth, Size, Share, Industry, Revenue, Segments, Value, Segmentation, Supply, Forecast, Restraints
- India Kids Watches Market (2026-2032) | Strategy, Consumer Insights, Analysis, Investment Trends, Opportunities, Growth, Size, Share, Industry, Revenue, Segments, Value, Segmentation, Supply, Forecast, Restraints, Outlook, Competition, Drivers, Trends, Demand, Pricing Analysis, Competitive, Strategic Insights, Companies, Challenges
- Saudi Arabia Core Assurance Service Market (2025-2031) | Strategy, Consumer Insights, Analysis, Investment Trends, Opportunities, Growth, Size, Share, Industry, Revenue, Segments, Value, Segmentation, Supply, Forecast, Restraints, Outlook, Competition, Drivers, Trends, Demand, Pricing Analysis, Competitive, Strategic Insights, Companies, Challenges
- Romania Uninterruptible Power Supply (UPS) Market (2026-2032) | Industry, Analysis, Revenue, Size, Forecast, Outlook, Value, Trends, Share, Growth & Companies
- Saudi Arabia Car Window Tinting Film, Paint Protection Film (PPF), and Ceramic Coating Market (2025-2031) | Strategy, Consumer Insights, Analysis, Investment Trends, Opportunities, Growth, Size, Share, Industry, Revenue, Segments, Value, Segmentation, Supply, Forecast, Restraints, Outlook, Competition, Drivers, Trends, Demand, Pricing Analysis, Competitive, Strategic Insights, Companies, Challenges
Industry Events and Analyst Meet

India EV Show 2026

EV tech India Expo 2026

Auto Tech Asia 2026

Battery Tech India 2026

Smart Production Solutions Guangzhou 2026
Whitepaper
- Middle East & Africa Commercial Security Market Click here to view more.
- Middle East & Africa Fire Safety Systems & Equipment Market Click here to view more.
- GCC Drone Market Click here to view more.
- Middle East Lighting Fixture Market Click here to view more.
- GCC Physical & Perimeter Security Market Click here to view more.
6WResearch In News
- Doha a strategic location for EV manufacturing hub: IPA Qatar
- Demand for luxury TVs surging in the GCC, says Samsung
- Empowering Growth: The Thriving Journey of Bangladesh’s Cable Industry
- Demand for luxury TVs surging in the GCC, says Samsung
- Video call with a traditional healer? Once unthinkable, it’s now common in South Africa
- Intelligent Buildings To Smooth GCC’s Path To Net Zero