Lithuania Multi-Layer Ceramic Capacitor Market (2026-2032) | Supply, Consumer Insights, Opportunities, Value, Analysis, Drivers, Strategy, Strategic Insights, Revenue, Investment Trends, Share, Forecast, Pricing Analysis, Trends, Industry, Competition, Demand, Competitive, Segments, Size, Outlook, Challenges, Growth, Companies, Segmentation, Restraints
Market Forecast By Dielectric Type (Class I (NP0/C0G), Class II (X7R, X5R), High Voltage, Ultra-High Capacitance, Low ESL (Equivalent Series Inductance)), By Voltage Rating (Below 50V, 50-100V, 100-500V, 500V-1kV, Above 1kV), By Capacitance Range (Below 1 pF, 1 pF - 1 F, 1 F - 10 F, 10 F - 100 F, Above 100 F), By Application (Consumer Electronics, Telecommunications, Medical Devices, Industrial Electronics, Automotive Systems), By End User (Automotive, Aerospace, Healthcare, Industrial, Consumer Goods) And Competitive Landscape
| Product Code: ETC12948666 | Publication Date: Apr 2025 | Updated Date: Apr 2026 | Product Type: Market Research Report | |
| Publisher: 6Wresearch | No. of Pages: 65 | No. of Figures: 34 | No. of Tables: 19 | |
Lithuania Multi-Layer Ceramic Capacitor Market Size (2020-2030)
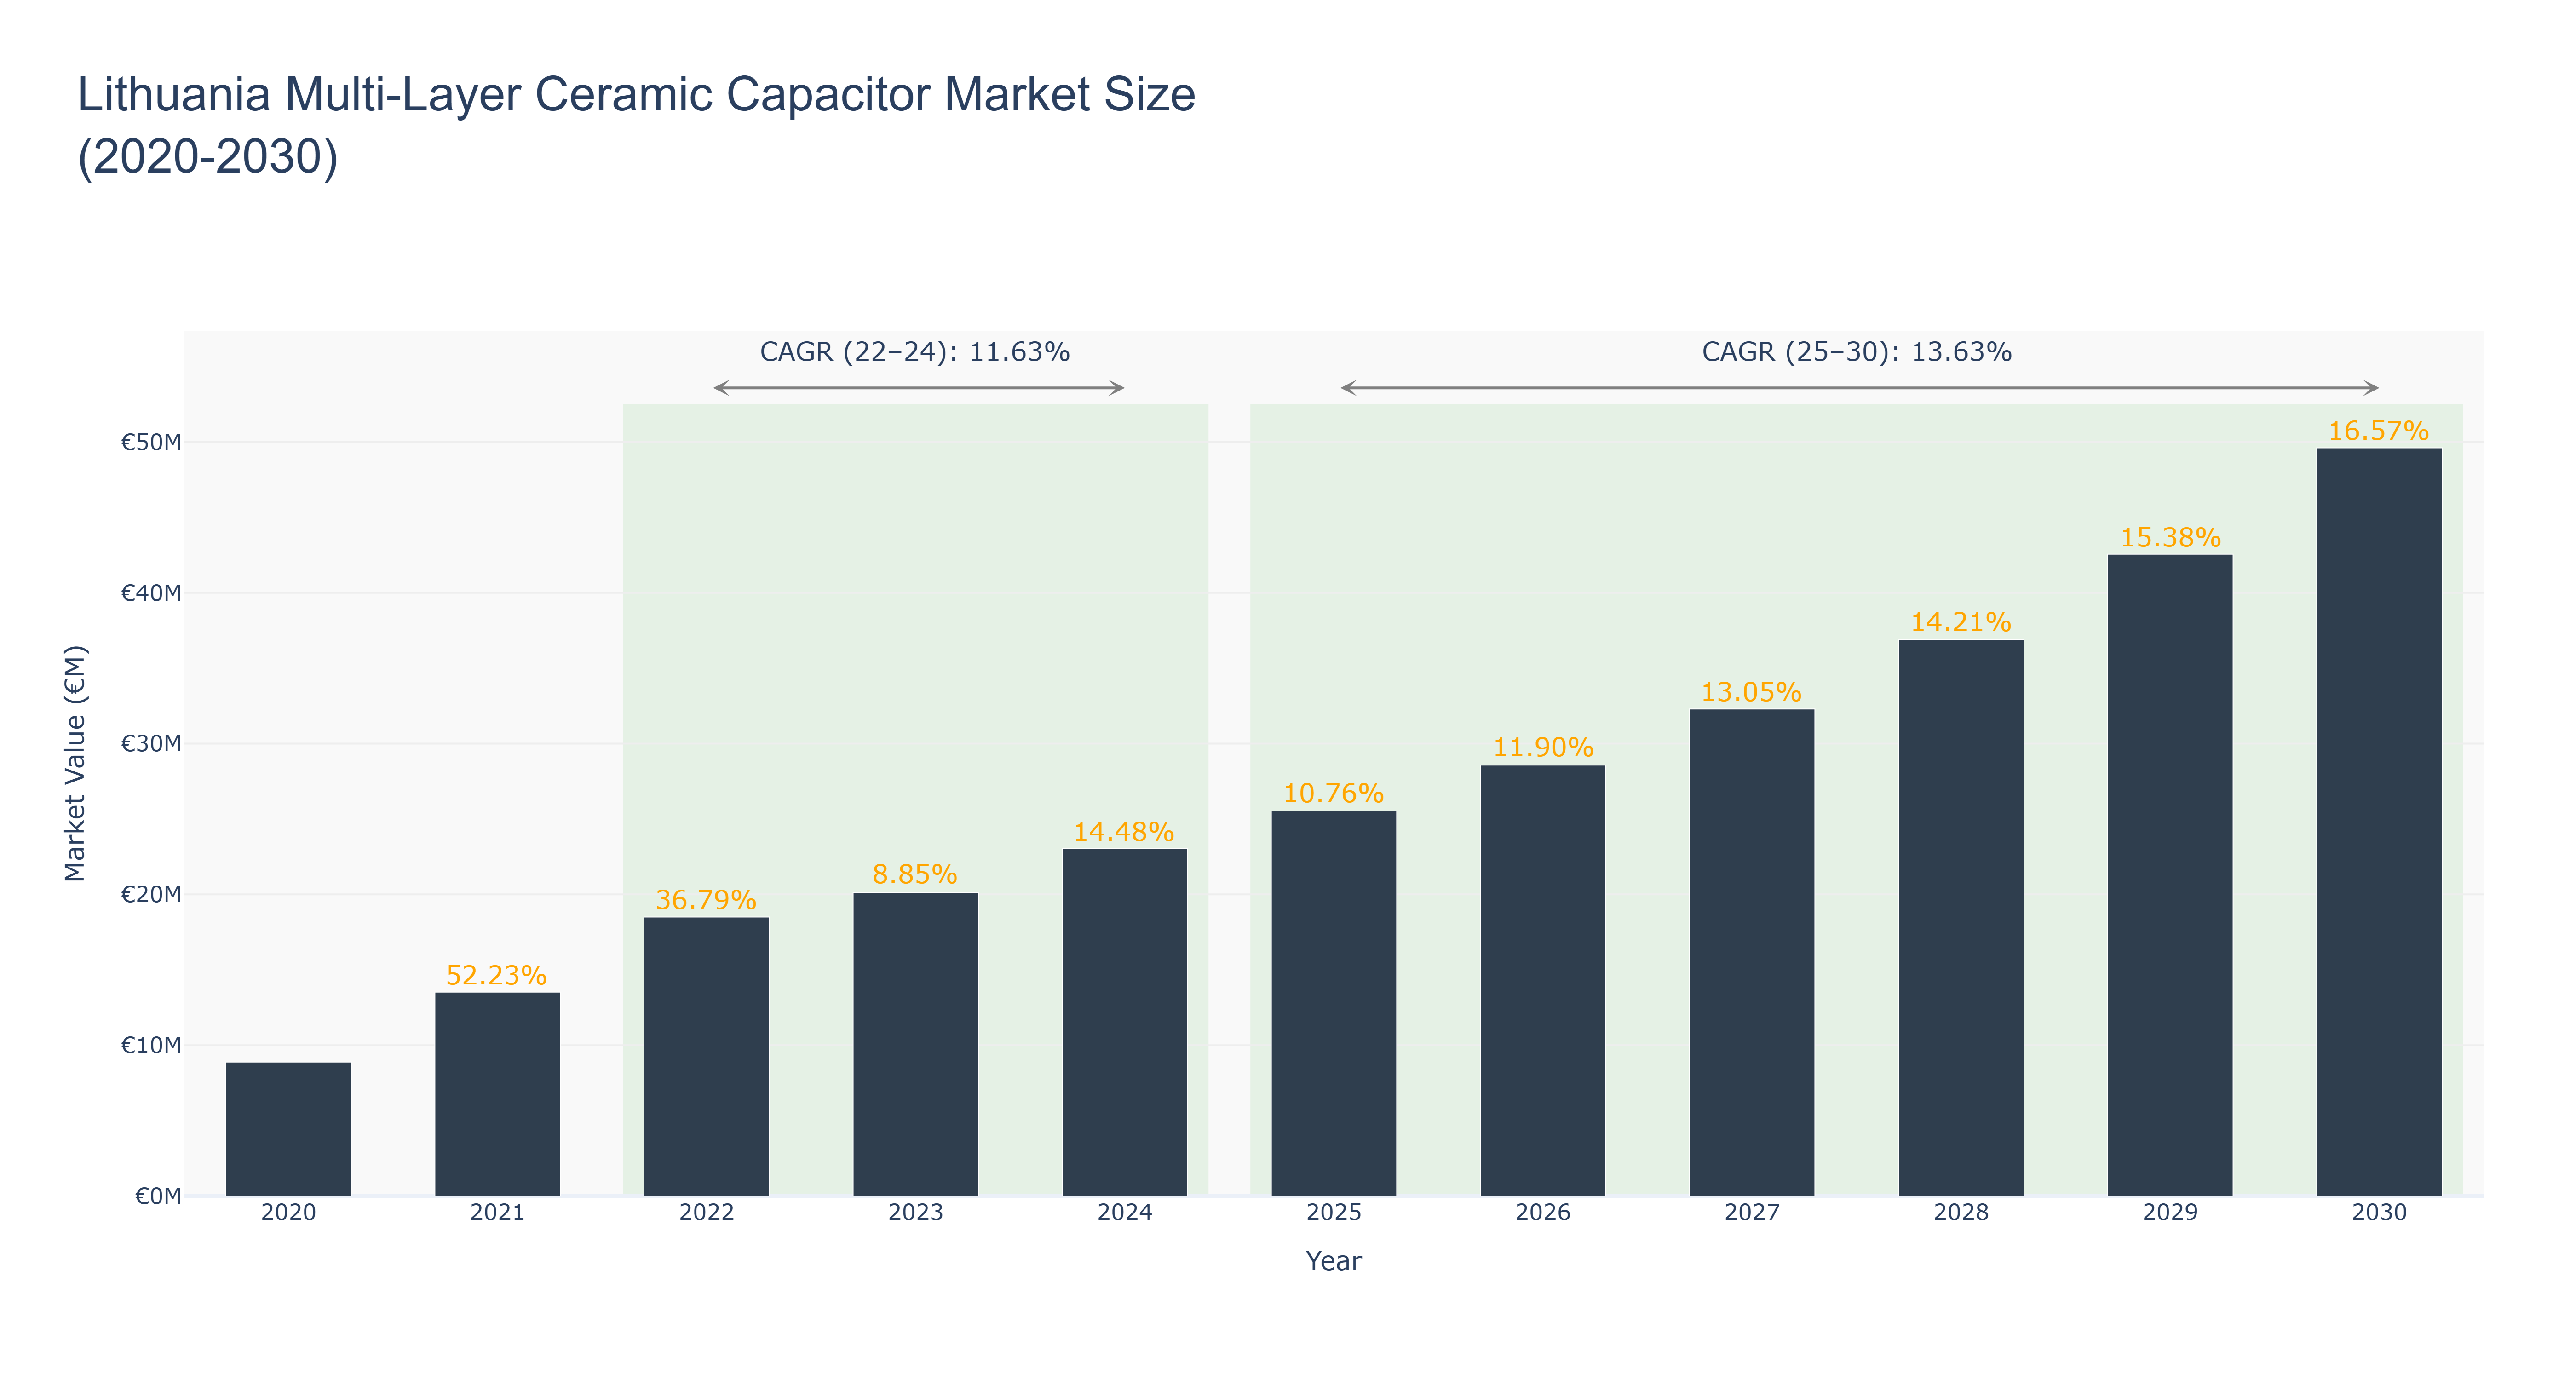
The Lithuania Multi-Layer Ceramic Capacitor Market has shown a steady growth trajectory over the past decade. The market size peaked at €49.62 million in 2030, with a notable CAGR of 13.63% from 2025 to 2030. The actual market size saw consistent growth from €18.50 million in 2022 to €23.05 million in 2024, driven by increasing demand for electronic components. The forecasted growth from 2025 to 2030 is attributed to advancements in technology and the expanding electronics industry in Lithuania. Recent developments include collaborations between local manufacturers and international players to enhance production capabilities, indicating a promising future for the market. As the demand for electronic devices continues to rise globally, the Lithuania Multi-Layer Ceramic Capacitor Market is poised for sustained growth in the coming years.
Lithuania Multi-Layer Ceramic Capacitor Market: Production & Trade Performance (2019-2025)
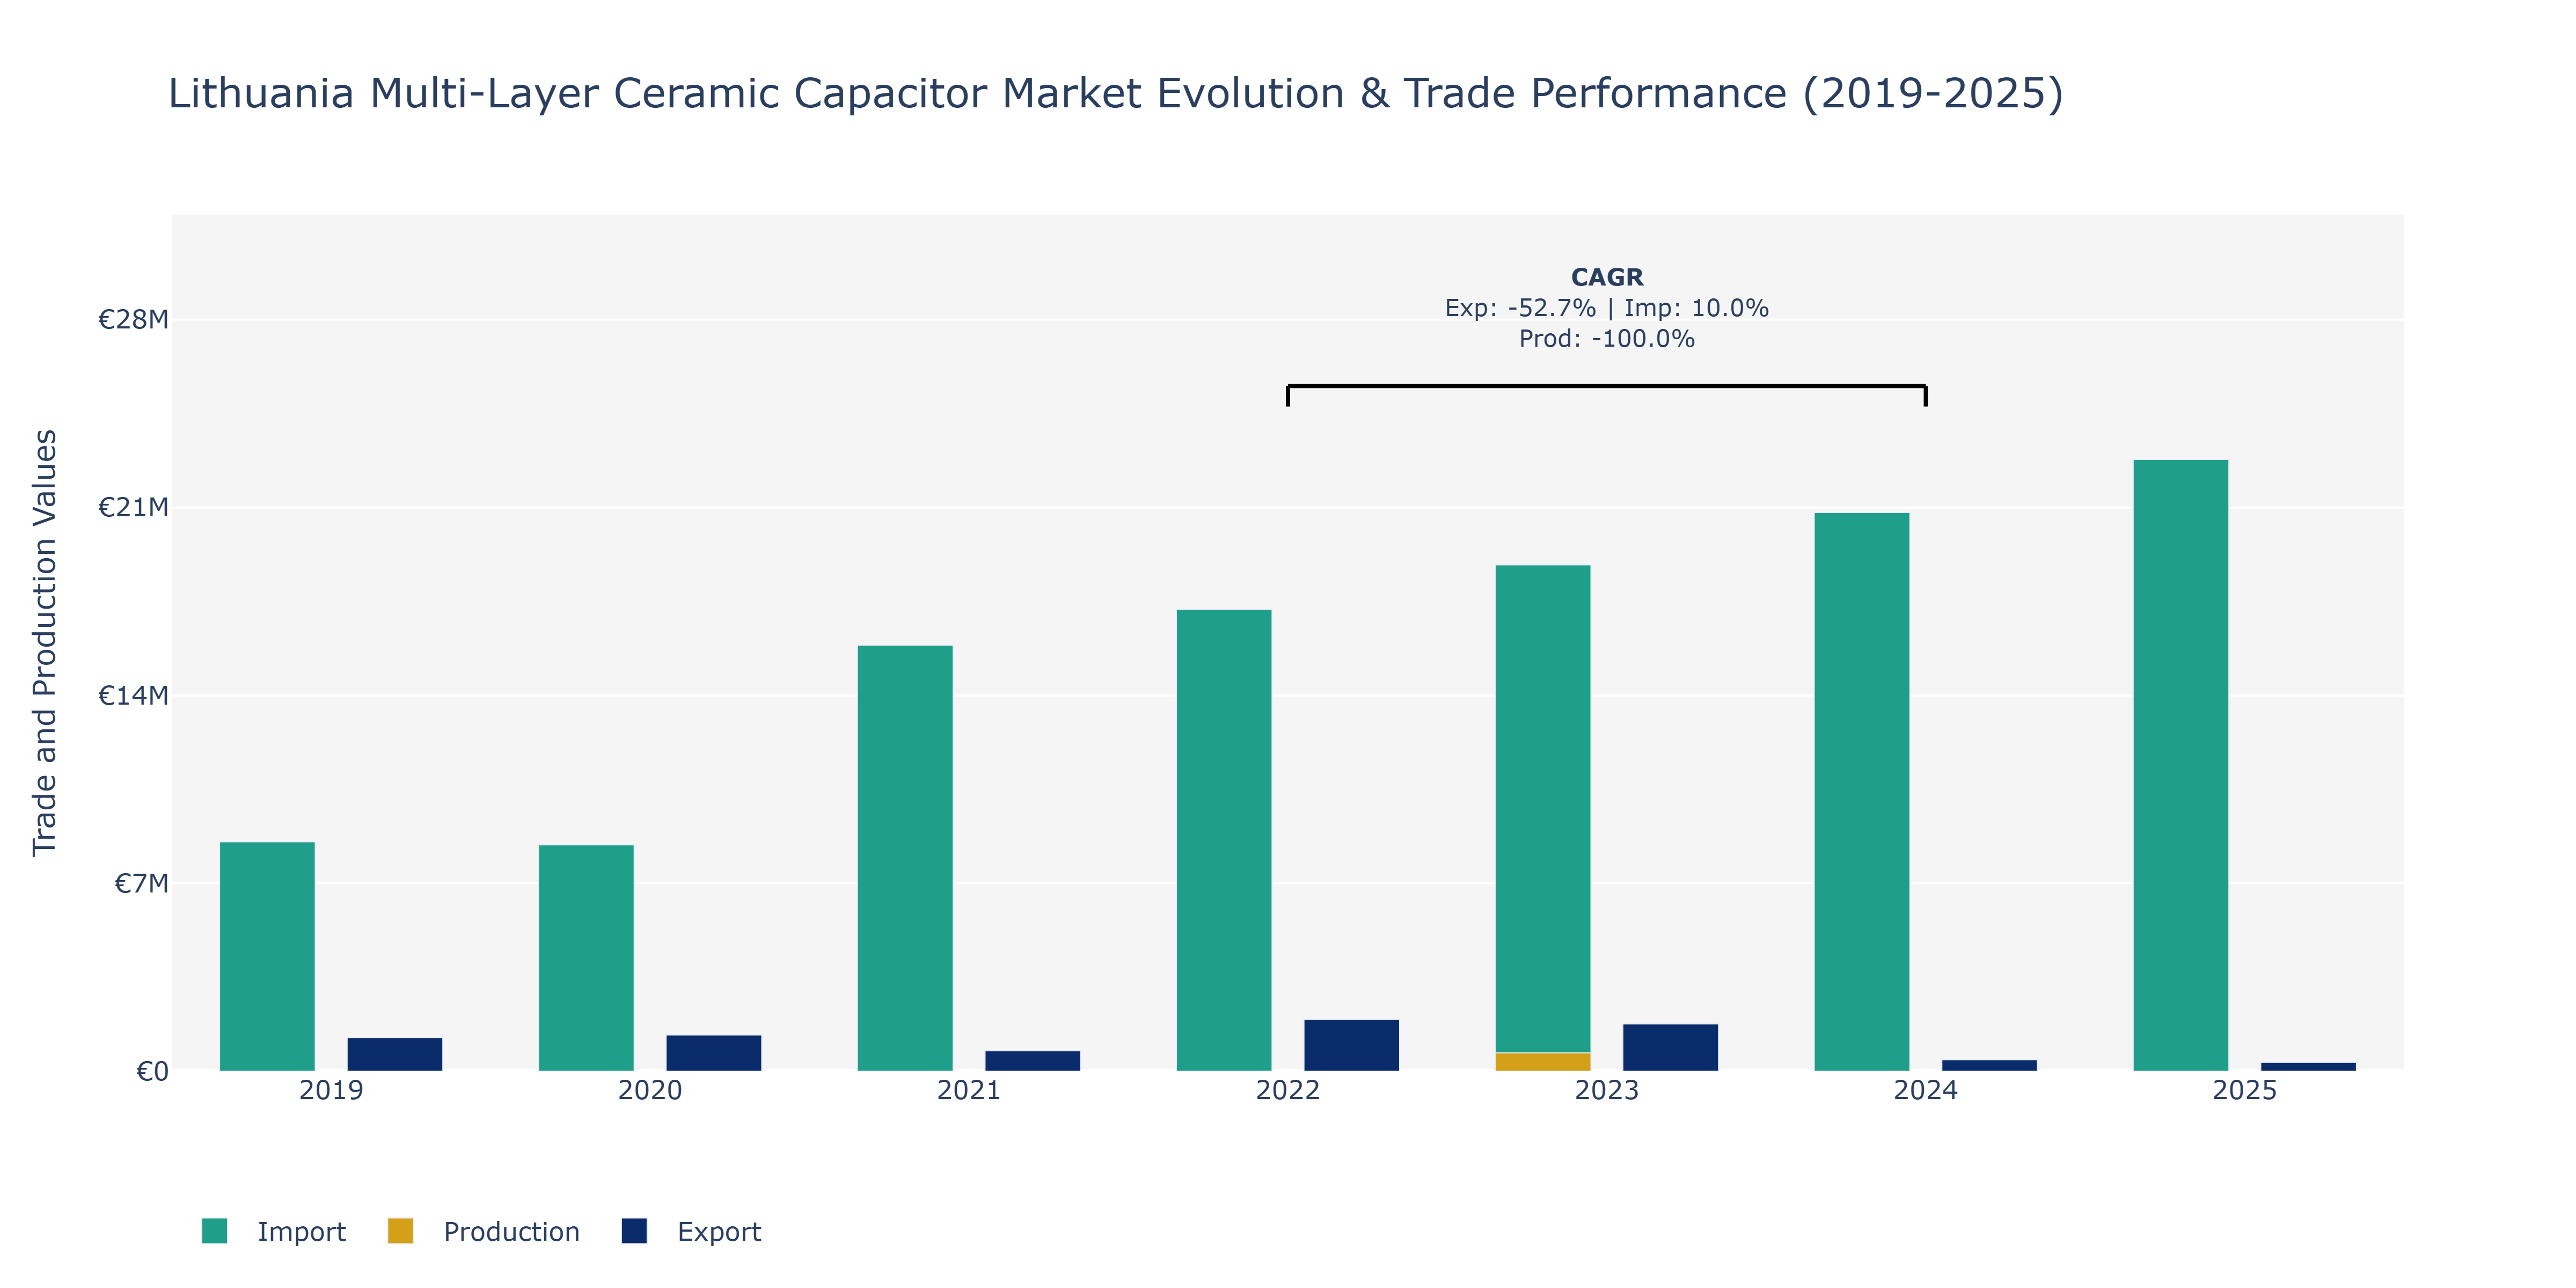
In the Lithuania Multi-Layer Ceramic Capacitor Market, the year 2021 saw a notable decrease in exports to €757.02 thousand, following a peak in 2020 at €1.35 million. However, a recovery was observed in 2022, with exports rising to €1.93 million. Imports, on the other hand, displayed a consistent upward trend from €8.54 million in 2019 to €22.79 million in 2025. Production, although starting at a mere €1 million in 2022, witnessed substantial growth to €685 million in 2023. The decline in production in 2024 to €431.56 thousand might be attributed to factors like supply chain disruptions or shifts in global demand for capacitors. The surge in imports could indicate increasing demand for electronic components in Lithuania, potentially driven by advancements in technology and the growing consumer electronics market globally, aligning with the country's role in the European tech industry.
Key Highlights of the Report:
- Lithuania Multi-Layer Ceramic Capacitor Market Outlook
- Market Size of Lithuania Multi-Layer Ceramic Capacitor Market, 2025
- Forecast of Lithuania Multi-Layer Ceramic Capacitor Market, 2032
- Historical Data and Forecast of Lithuania Multi-Layer Ceramic Capacitor Revenues & Volume for the Period 2022 - 2032F
- Lithuania Multi-Layer Ceramic Capacitor Market Trend Evolution
- Lithuania Multi-Layer Ceramic Capacitor Market Drivers and Challenges
- Lithuania Multi-Layer Ceramic Capacitor Price Trends
- Lithuania Multi-Layer Ceramic Capacitor Porter's Five Forces
- Lithuania Multi-Layer Ceramic Capacitor Industry Life Cycle
- Historical Data and Forecast of Lithuania Multi-Layer Ceramic Capacitor Market Revenues & Volume By Dielectric Type for the Period 2022 - 2032F
- Historical Data and Forecast of Lithuania Multi-Layer Ceramic Capacitor Market Revenues & Volume By Class I (NP0/C0G) for the Period 2022 - 2032F
- Historical Data and Forecast of Lithuania Multi-Layer Ceramic Capacitor Market Revenues & Volume By Class II (X7R, X5R) for the Period 2022 - 2032F
- Historical Data and Forecast of Lithuania Multi-Layer Ceramic Capacitor Market Revenues & Volume By High Voltage for the Period 2022 - 2032F
- Historical Data and Forecast of Lithuania Multi-Layer Ceramic Capacitor Market Revenues & Volume By Ultra-High Capacitance for the Period 2022 - 2032F
- Historical Data and Forecast of Lithuania Multi-Layer Ceramic Capacitor Market Revenues & Volume By Low ESL (Equivalent Series Inductance) for the Period 2022 - 2032F
- Historical Data and Forecast of Lithuania Multi-Layer Ceramic Capacitor Market Revenues & Volume By Voltage Rating for the Period 2022 - 2032F
- Historical Data and Forecast of Lithuania Multi-Layer Ceramic Capacitor Market Revenues & Volume By Below 50V for the Period 2022 - 2032F
- Historical Data and Forecast of Lithuania Multi-Layer Ceramic Capacitor Market Revenues & Volume By 50-100V for the Period 2022 - 2032F
- Historical Data and Forecast of Lithuania Multi-Layer Ceramic Capacitor Market Revenues & Volume By 100-500V for the Period 2022 - 2032F
- Historical Data and Forecast of Lithuania Multi-Layer Ceramic Capacitor Market Revenues & Volume By 500V-1kV for the Period 2022 - 2032F
- Historical Data and Forecast of Lithuania Multi-Layer Ceramic Capacitor Market Revenues & Volume By Above 1kV for the Period 2022 - 2032F
- Historical Data and Forecast of Lithuania Multi-Layer Ceramic Capacitor Market Revenues & Volume By Capacitance Range for the Period 2022 - 2032F
- Historical Data and Forecast of Lithuania Multi-Layer Ceramic Capacitor Market Revenues & Volume By Below 1 pF for the Period 2022 - 2032F
- Historical Data and Forecast of Lithuania Multi-Layer Ceramic Capacitor Market Revenues & Volume By 1 pF - 1 F for the Period 2022 - 2032F
- Historical Data and Forecast of Lithuania Multi-Layer Ceramic Capacitor Market Revenues & Volume By 1 F - 10 F for the Period 2022 - 2032F
- Historical Data and Forecast of Lithuania Multi-Layer Ceramic Capacitor Market Revenues & Volume By 10 F - 100 F for the Period 2022 - 2032F
- Historical Data and Forecast of Lithuania Multi-Layer Ceramic Capacitor Market Revenues & Volume By Above 100 F for the Period 2022 - 2032F
- Historical Data and Forecast of Lithuania Multi-Layer Ceramic Capacitor Market Revenues & Volume By Application for the Period 2022 - 2032F
- Historical Data and Forecast of Lithuania Multi-Layer Ceramic Capacitor Market Revenues & Volume By Consumer Electronics for the Period 2022 - 2032F
- Historical Data and Forecast of Lithuania Multi-Layer Ceramic Capacitor Market Revenues & Volume By Telecommunications for the Period 2022 - 2032F
- Historical Data and Forecast of Lithuania Multi-Layer Ceramic Capacitor Market Revenues & Volume By Medical Devices for the Period 2022 - 2032F
- Historical Data and Forecast of Lithuania Multi-Layer Ceramic Capacitor Market Revenues & Volume By Industrial Electronics for the Period 2022 - 2032F
- Historical Data and Forecast of Lithuania Multi-Layer Ceramic Capacitor Market Revenues & Volume By Automotive Systems for the Period 2022 - 2032F
- Historical Data and Forecast of Lithuania Multi-Layer Ceramic Capacitor Market Revenues & Volume By End User for the Period 2022 - 2032F
- Historical Data and Forecast of Lithuania Multi-Layer Ceramic Capacitor Market Revenues & Volume By Automotive for the Period 2022 - 2032F
- Historical Data and Forecast of Lithuania Multi-Layer Ceramic Capacitor Market Revenues & Volume By Aerospace for the Period 2022 - 2032F
- Historical Data and Forecast of Lithuania Multi-Layer Ceramic Capacitor Market Revenues & Volume By Healthcare for the Period 2022 - 2032F
- Historical Data and Forecast of Lithuania Multi-Layer Ceramic Capacitor Market Revenues & Volume By Industrial for the Period 2022 - 2032F
- Historical Data and Forecast of Lithuania Multi-Layer Ceramic Capacitor Market Revenues & Volume By Consumer Goods for the Period 2022 - 2032F
- Lithuania Multi-Layer Ceramic Capacitor Import Export Trade Statistics
- Market Opportunity Assessment By Dielectric Type
- Market Opportunity Assessment By Voltage Rating
- Market Opportunity Assessment By Capacitance Range
- Market Opportunity Assessment By Application
- Market Opportunity Assessment By End User
- Lithuania Multi-Layer Ceramic Capacitor Top Companies Market Share
- Lithuania Multi-Layer Ceramic Capacitor Competitive Benchmarking By Technical and Operational Parameters
- Lithuania Multi-Layer Ceramic Capacitor Company Profiles
- Lithuania Multi-Layer Ceramic Capacitor Key Strategic Recommendations
Frequently Asked Questions About the Market Study (FAQs):
6Wresearch actively monitors the Lithuania Multi-Layer Ceramic Capacitor Market and publishes its comprehensive annual report, highlighting emerging trends, growth drivers, revenue analysis, and forecast outlook. Our insights help businesses to make data-backed strategic decisions with ongoing market dynamics. Our analysts track relevent industries related to the Lithuania Multi-Layer Ceramic Capacitor Market, allowing our clients with actionable intelligence and reliable forecasts tailored to emerging regional needs.
Yes, we provide customisation as per your requirements. To learn more, feel free to contact us on sales@6wresearch.com
1 Executive Summary |
2 Introduction |
2.1 Key Highlights of the Report |
2.2 Report Description |
2.3 Market Scope & Segmentation |
2.4 Research Methodology |
2.5 Assumptions |
3 Lithuania Multi-Layer Ceramic Capacitor Market Overview |
3.1 Lithuania Country Macro Economic Indicators |
3.2 Lithuania Multi-Layer Ceramic Capacitor Market Revenues & Volume, 2022 & 2032F |
3.3 Lithuania Multi-Layer Ceramic Capacitor Market - Industry Life Cycle |
3.4 Lithuania Multi-Layer Ceramic Capacitor Market - Porter's Five Forces |
3.5 Lithuania Multi-Layer Ceramic Capacitor Market Revenues & Volume Share, By Dielectric Type, 2022 & 2032F |
3.6 Lithuania Multi-Layer Ceramic Capacitor Market Revenues & Volume Share, By Voltage Rating, 2022 & 2032F |
3.7 Lithuania Multi-Layer Ceramic Capacitor Market Revenues & Volume Share, By Capacitance Range, 2022 & 2032F |
3.8 Lithuania Multi-Layer Ceramic Capacitor Market Revenues & Volume Share, By Application, 2022 & 2032F |
3.9 Lithuania Multi-Layer Ceramic Capacitor Market Revenues & Volume Share, By End User, 2022 & 2032F |
4 Lithuania Multi-Layer Ceramic Capacitor Market Dynamics |
4.1 Impact Analysis |
4.2 Market Drivers |
4.2.1 Growing demand for consumer electronics and automotive electronics in Lithuania |
4.2.2 Increasing adoption of renewable energy sources driving the need for power electronics, where MLCCs are used |
4.2.3 Technological advancements leading to miniaturization and increased functionality of electronic devices |
4.3 Market Restraints |
4.3.1 Supply chain disruptions impacting the availability of raw materials for MLCC production |
4.3.2 Price volatility of key materials used in MLCC manufacturing affecting production costs |
4.3.3 Intense competition among MLCC manufacturers leading to pricing pressures |
5 Lithuania Multi-Layer Ceramic Capacitor Market Trends |
6 Lithuania Multi-Layer Ceramic Capacitor Market, By Types |
6.1 Lithuania Multi-Layer Ceramic Capacitor Market, By Dielectric Type |
6.1.1 Overview and Analysis |
6.1.2 Lithuania Multi-Layer Ceramic Capacitor Market Revenues & Volume, By Dielectric Type, 2022 - 2032F |
6.1.3 Lithuania Multi-Layer Ceramic Capacitor Market Revenues & Volume, By Class I (NP0/C0G), 2022 - 2032F |
6.1.4 Lithuania Multi-Layer Ceramic Capacitor Market Revenues & Volume, By Class II (X7R, X5R), 2022 - 2032F |
6.1.5 Lithuania Multi-Layer Ceramic Capacitor Market Revenues & Volume, By High Voltage, 2022 - 2032F |
6.1.6 Lithuania Multi-Layer Ceramic Capacitor Market Revenues & Volume, By Ultra-High Capacitance, 2022 - 2032F |
6.1.7 Lithuania Multi-Layer Ceramic Capacitor Market Revenues & Volume, By Low ESL (Equivalent Series Inductance), 2022 - 2032F |
6.2 Lithuania Multi-Layer Ceramic Capacitor Market, By Voltage Rating |
6.2.1 Overview and Analysis |
6.2.2 Lithuania Multi-Layer Ceramic Capacitor Market Revenues & Volume, By Below 50V, 2022 - 2032F |
6.2.3 Lithuania Multi-Layer Ceramic Capacitor Market Revenues & Volume, By 50-100V, 2022 - 2032F |
6.2.4 Lithuania Multi-Layer Ceramic Capacitor Market Revenues & Volume, By 100-500V, 2022 - 2032F |
6.2.5 Lithuania Multi-Layer Ceramic Capacitor Market Revenues & Volume, By 500V-1kV, 2022 - 2032F |
6.2.6 Lithuania Multi-Layer Ceramic Capacitor Market Revenues & Volume, By Above 1kV, 2022 - 2032F |
6.3 Lithuania Multi-Layer Ceramic Capacitor Market, By Capacitance Range |
6.3.1 Overview and Analysis |
6.3.2 Lithuania Multi-Layer Ceramic Capacitor Market Revenues & Volume, By Below 1 pF, 2022 - 2032F |
6.3.3 Lithuania Multi-Layer Ceramic Capacitor Market Revenues & Volume, By 1 pF - 1 F, 2022 - 2032F |
6.3.4 Lithuania Multi-Layer Ceramic Capacitor Market Revenues & Volume, By 1 F - 10 F, 2022 - 2032F |
6.3.5 Lithuania Multi-Layer Ceramic Capacitor Market Revenues & Volume, By 10 F - 100 F, 2022 - 2032F |
6.3.6 Lithuania Multi-Layer Ceramic Capacitor Market Revenues & Volume, By Above 100 F, 2022 - 2032F |
6.4 Lithuania Multi-Layer Ceramic Capacitor Market, By Application |
6.4.1 Overview and Analysis |
6.4.2 Lithuania Multi-Layer Ceramic Capacitor Market Revenues & Volume, By Consumer Electronics, 2022 - 2032F |
6.4.3 Lithuania Multi-Layer Ceramic Capacitor Market Revenues & Volume, By Telecommunications, 2022 - 2032F |
6.4.4 Lithuania Multi-Layer Ceramic Capacitor Market Revenues & Volume, By Medical Devices, 2022 - 2032F |
6.4.5 Lithuania Multi-Layer Ceramic Capacitor Market Revenues & Volume, By Industrial Electronics, 2022 - 2032F |
6.4.6 Lithuania Multi-Layer Ceramic Capacitor Market Revenues & Volume, By Automotive Systems, 2022 - 2032F |
6.5 Lithuania Multi-Layer Ceramic Capacitor Market, By End User |
6.5.1 Overview and Analysis |
6.5.2 Lithuania Multi-Layer Ceramic Capacitor Market Revenues & Volume, By Automotive, 2022 - 2032F |
6.5.3 Lithuania Multi-Layer Ceramic Capacitor Market Revenues & Volume, By Aerospace, 2022 - 2032F |
6.5.4 Lithuania Multi-Layer Ceramic Capacitor Market Revenues & Volume, By Healthcare, 2022 - 2032F |
6.5.5 Lithuania Multi-Layer Ceramic Capacitor Market Revenues & Volume, By Industrial, 2022 - 2032F |
6.5.6 Lithuania Multi-Layer Ceramic Capacitor Market Revenues & Volume, By Consumer Goods, 2022 - 2032F |
7 Lithuania Multi-Layer Ceramic Capacitor Market Import-Export Trade Statistics |
7.1 Lithuania Multi-Layer Ceramic Capacitor Market Export to Major Countries |
7.2 Lithuania Multi-Layer Ceramic Capacitor Market Imports from Major Countries |
8 Lithuania Multi-Layer Ceramic Capacitor Market Key Performance Indicators |
8.1 Average selling price of MLCCs in Lithuania |
8.2 Number of new product launches incorporating MLCCs in the Lithuanian market |
8.3 Percentage of MLCC imports compared to domestic production in Lithuania |
9 Lithuania Multi-Layer Ceramic Capacitor Market - Opportunity Assessment |
9.1 Lithuania Multi-Layer Ceramic Capacitor Market Opportunity Assessment, By Dielectric Type, 2022 & 2032F |
9.2 Lithuania Multi-Layer Ceramic Capacitor Market Opportunity Assessment, By Voltage Rating, 2022 & 2032F |
9.3 Lithuania Multi-Layer Ceramic Capacitor Market Opportunity Assessment, By Capacitance Range, 2022 & 2032F |
9.4 Lithuania Multi-Layer Ceramic Capacitor Market Opportunity Assessment, By Application, 2022 & 2032F |
9.5 Lithuania Multi-Layer Ceramic Capacitor Market Opportunity Assessment, By End User, 2022 & 2032F |
10 Lithuania Multi-Layer Ceramic Capacitor Market - Competitive Landscape |
10.1 Lithuania Multi-Layer Ceramic Capacitor Market Revenue Share, By Companies, 2025 |
10.2 Lithuania Multi-Layer Ceramic Capacitor Market Competitive Benchmarking, By Operating and Technical Parameters |
11 Company Profiles |
12 Recommendations |
13 Disclaimer |
Global Go To Market Strategy - 2030
Export potential enables firms to identify high-growth global markets with greater confidence by combining advanced trade intelligence with a structured quantitative methodology. The framework analyzes emerging demand trends and country-level import patterns while integrating macroeconomic and trade datasets such as GDP and population forecasts, bilateral import–export flows, tariff structures, elasticity differentials between developed and developing economies, geographic distance, and import demand projections. Using weighted trade values from 2020–2024 as the base period to project country-to-country export potential for 2030, these inputs are operationalized through calculated drivers such as gravity model parameters, tariff impact factors, and projected GDP per-capita growth. Through an analysis of hidden potentials, demand hotspots, and market conditions that are most favorable to success, this method enables firms to focus on target countries, maximize returns, and global expansion with data, backed by accuracy.
By factoring in the projected importer demand gap that is currently unmet and could be potential opportunity, it identifies the potential for the Exporter (Country) among 190 countries, against the general trade analysis, which identifies the biggest importer or exporter.
To discover high-growth global markets and optimize your business strategy:
Click Here
Pricing
- Single User License$ 1,995
- Department License$ 2,400
- Site License$ 3,120
- Global License$ 3,795

Leadership Perspectives from Industry Events
Search
Thought Leadership and Analyst Meet


Our Clients
6WResearch In News
- Doha a strategic location for EV manufacturing hub: IPA Qatar
- Demand for luxury TVs surging in the GCC, says Samsung
- Empowering Growth: The Thriving Journey of Bangladesh’s Cable Industry
- Demand for luxury TVs surging in the GCC, says Samsung
- Video call with a traditional healer? Once unthinkable, it’s now common in South Africa
- Intelligent Buildings To Smooth GCC’s Path To Net Zero
Latest Reports
- Taiwan Airport Wireless Infrastructure Market (2026-2032)
- Vietnam Airport Wireless Infrastructure Market (2026-2032)
- Thailand Airport Wireless Infrastructure Market (2026-2032)
- South Korea Airport Wireless Infrastructure Market (2026-2032)
- Romania Airport Wireless Infrastructure Market (2026-2032)
- Qatar Airport Wireless Infrastructure Market (2026-2032)
- Philippines Airport Wireless Infrastructure Market (2026-2032)
- Japan Airport Wireless Infrastructure Market (2026-2032)
- Taiwan Airport Winter Services Market (2026-2032)
- Vietnam Airport Winter Services Market (2026-2032)
Industry Events and Analyst Meet

HIMTEX 2026

India Refining Summit 2026

India EV Show 2026

EV tech India Expo 2026

Auto Tech Asia 2026
Whitepaper
- Middle East & Africa Commercial Security Market Click here to view more.
- Middle East & Africa Fire Safety Systems & Equipment Market Click here to view more.
- GCC Drone Market Click here to view more.
- Middle East Lighting Fixture Market Click here to view more.
- GCC Physical & Perimeter Security Market Click here to view more.