Lithuania Noble Gases Market (2026-2032) | Growth, Revenue, Pricing Analysis, Restraints, Companies, Forecast, Investment Trends, Drivers, Demand, Segmentation, Industry, Outlook, Trends, Strategy, Competition, Supply, Size, Consumer Insights, Analysis, Competitive, Value, Strategic Insights, Segments, Challenges, Share, Opportunities
Market Forecast By Type (Helium, Neon, Argon, Krypton), By Application (Cryogenics, Lighting, Welding, Insulation), By End User (Healthcare, Electronics, Metal Industry, Construction) And Competitive Landscape
| Product Code: ETC12753786 | Publication Date: Apr 2025 | Updated Date: Apr 2026 | Product Type: Market Research Report | |
| Publisher: 6Wresearch | Author: Sachin Kumar Rai | No. of Pages: 65 | No. of Figures: 34 | No. of Tables: 19 |
Lithuania Noble Gases Market Size (2020-2030)
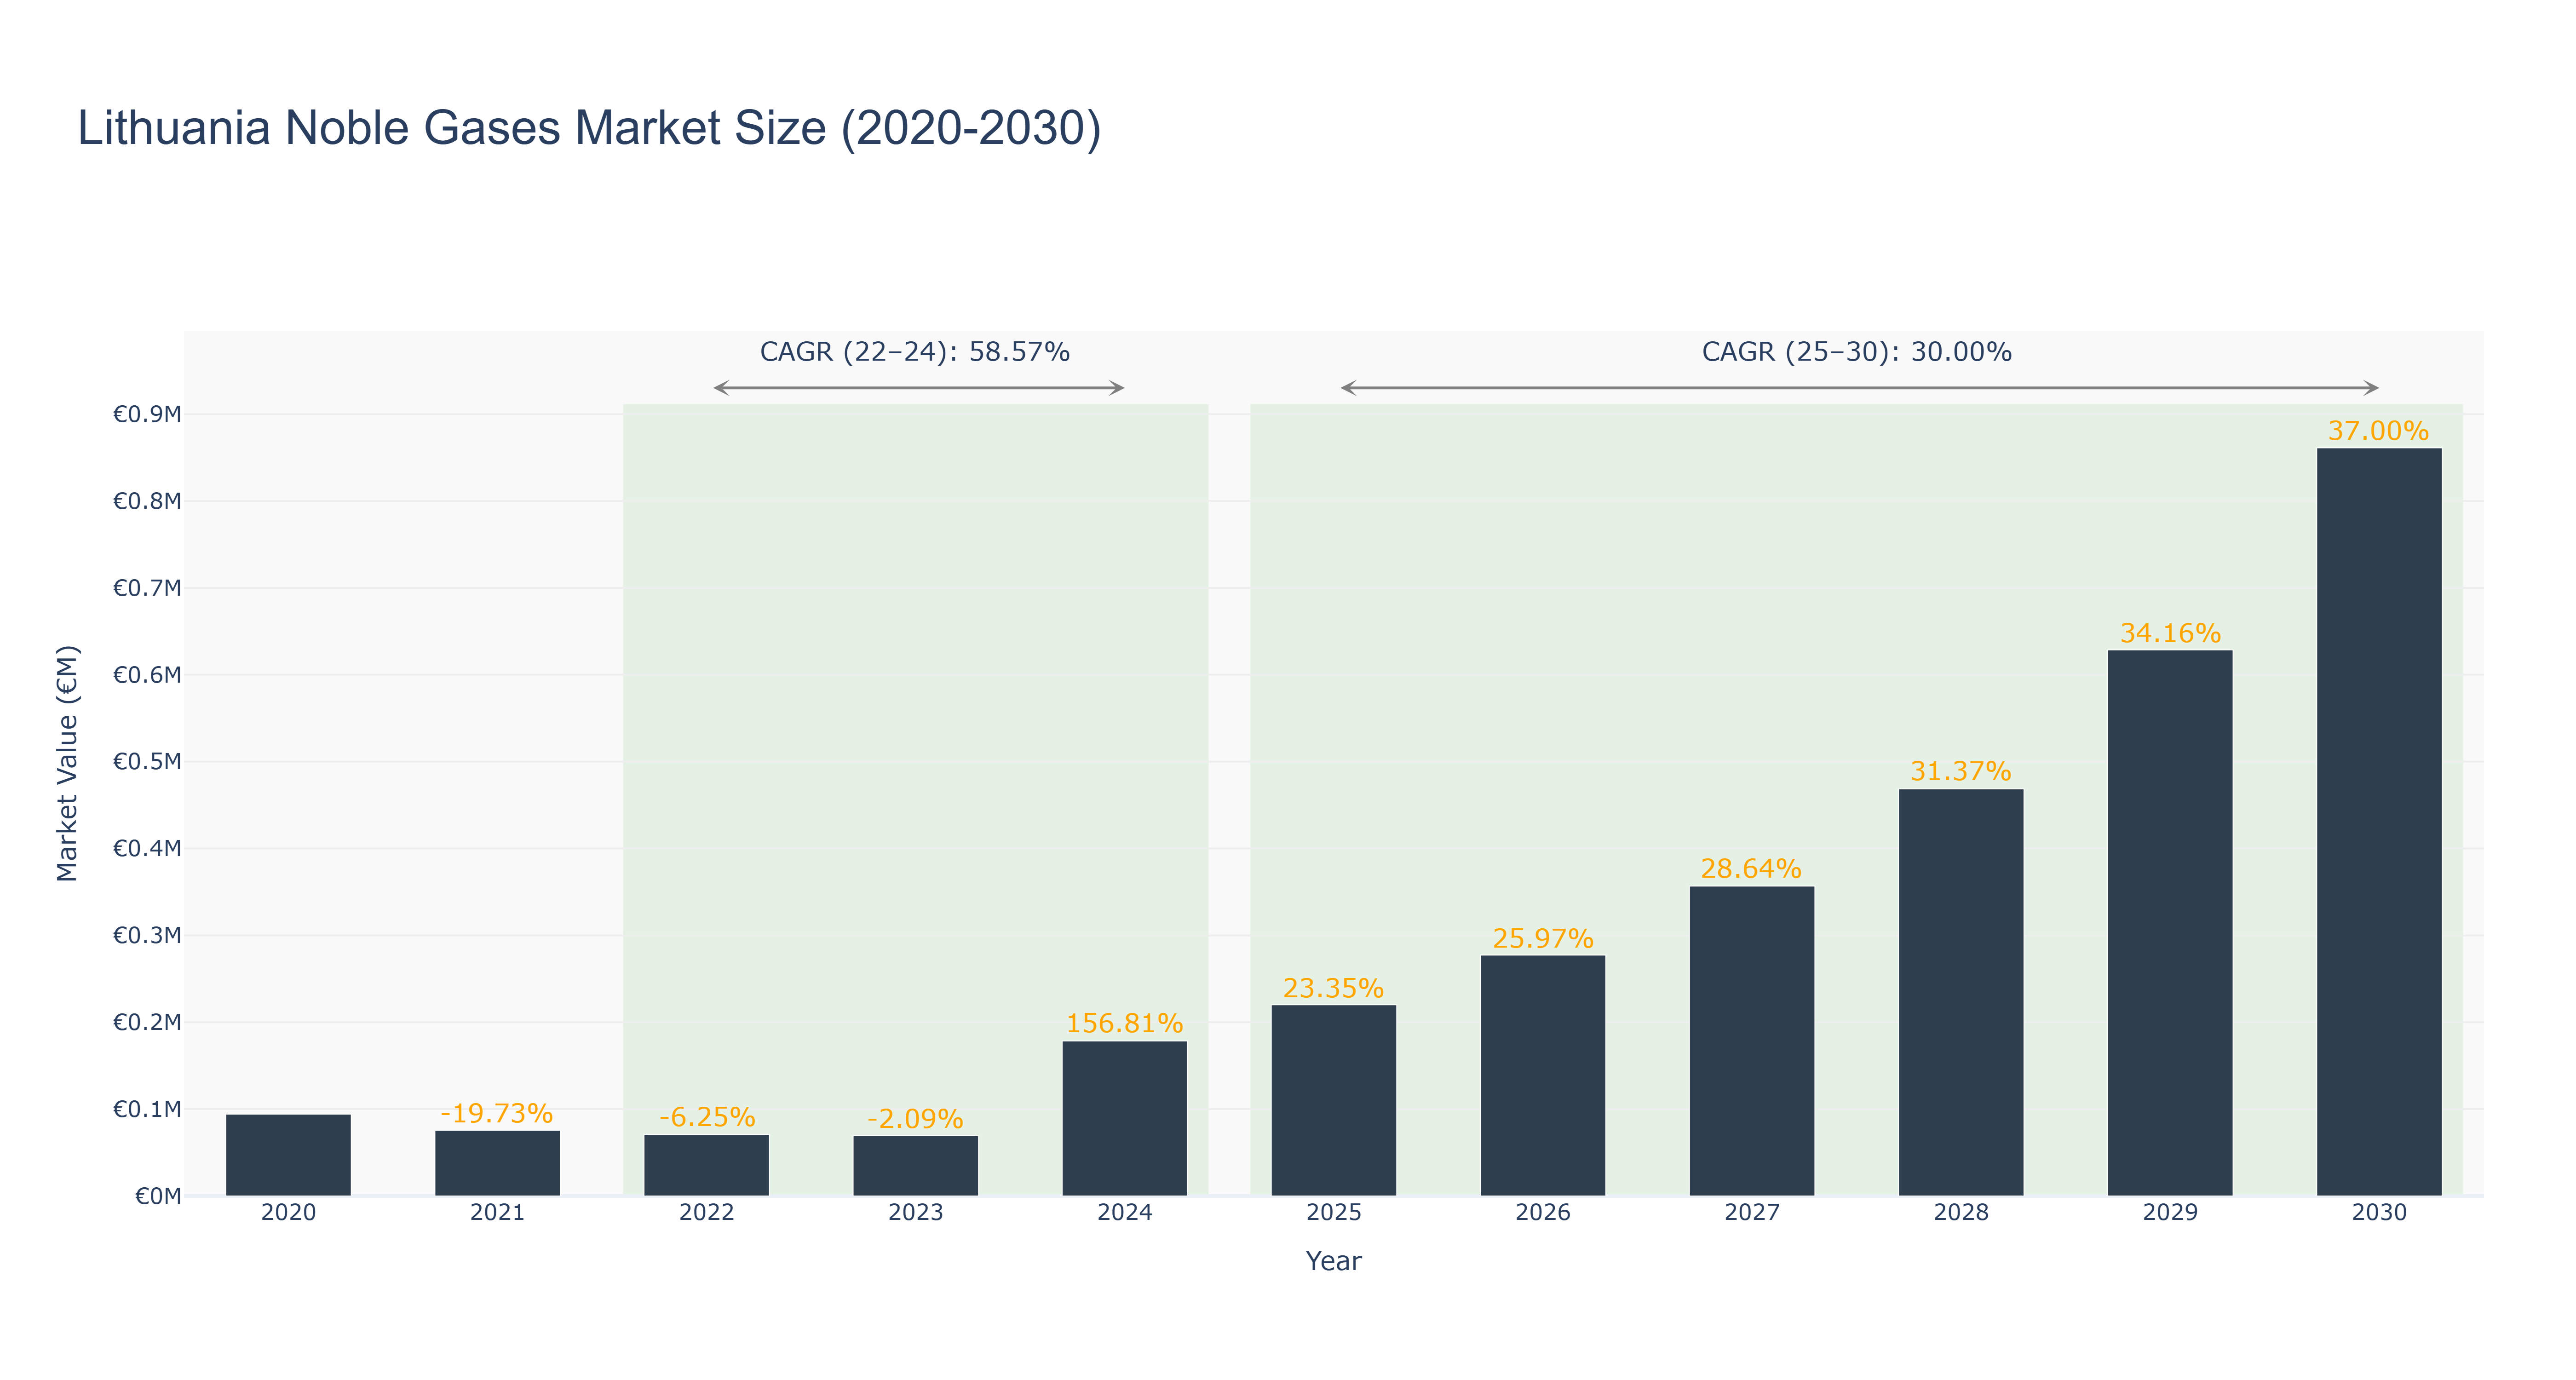
The Lithuania Noble Gases Market experienced a significant decline between 2021 and 2023, with market sizes dropping from €75.69 thousand in 2021 to €69.48 thousand in 2023, reflecting a cumulative decrease of 8.6%. However, a remarkable turnaround is anticipated, as the market is projected to soar to €178.42 thousand in 2024, marking a staggering growth of 156.81%. The compound annual growth rate (CAGR) for the actual period from 2022 to 2024 stands at 58.57%, driven by increased industrial demand and advancements in technology. Looking ahead, the forecast from 2025 to 2030 indicates sustained growth, with the market expected to reach €861.22 thousand by 2030, reflecting a CAGR of 30.00%. This growth is likely fueled by expanding applications of noble gases in various sectors, including healthcare and electronics, alongside potential investments in infrastructure and research initiatives within the region.
Lithuania Noble Gases Market: Production & Trade Performance (2019-2025)
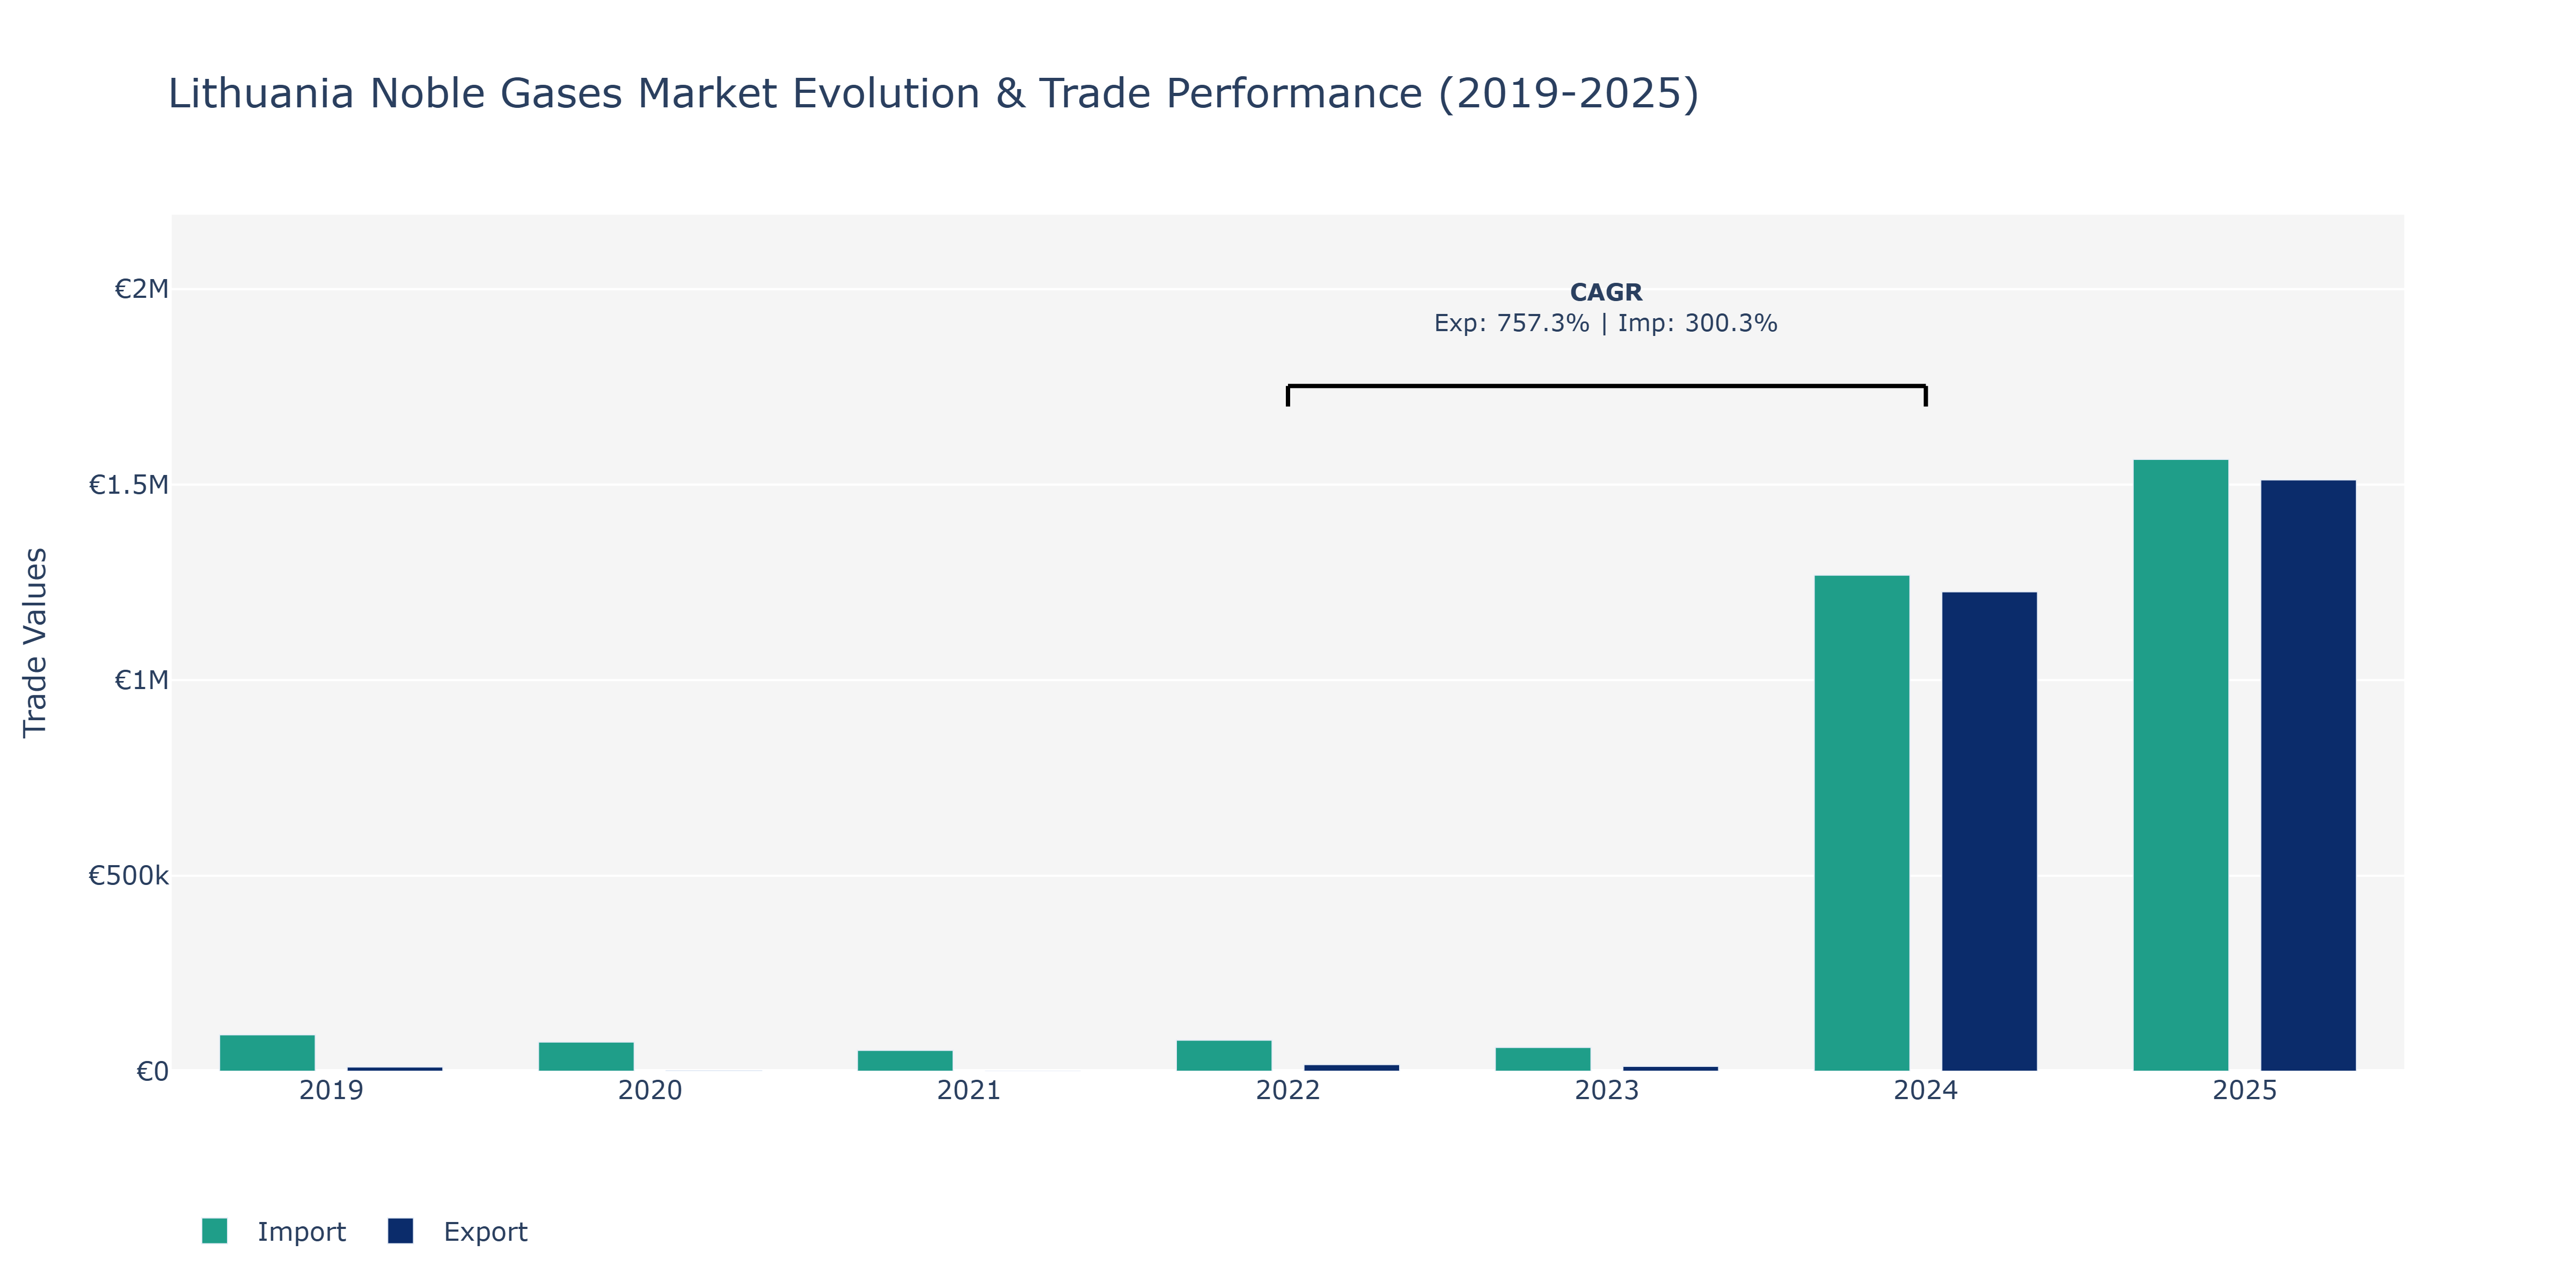
Between 2019 and 2025, Lithuania's Noble Gases Market displayed varying trends in both exports and imports. In 2019, exports stood at €10.73 thousand, witnessing a significant drop to €1.48 thousand in 2020, before experiencing a substantial surge to €1.22 million in 2024 and reaching €1.51 million in 2025. The imports, on the other hand, were valued at €92.96 thousand in 2019, declining to €74.36 thousand in 2020, and then gradually increasing to peak at €1.56 million in 2025. The notable peak in exports in 2025 can be attributed to increased demand for noble gases globally, fueled by advancements in various industries such as healthcare, electronics, and manufacturing. Furthermore, the rise in imports over the years can be linked to Lithuania's growing industrial sector and the need for these gases in diverse applications, including welding, lighting, and as inert atmospheres in metallurgy.
Key Highlights of the Report:
- Lithuania Noble Gases Market Outlook
- Market Size of Lithuania Noble Gases Market, 2025
- Forecast of Lithuania Noble Gases Market, 2032
- Historical Data and Forecast of Lithuania Noble Gases Revenues & Volume for the Period 2022 - 2032F
- Lithuania Noble Gases Market Trend Evolution
- Lithuania Noble Gases Market Drivers and Challenges
- Lithuania Noble Gases Price Trends
- Lithuania Noble Gases Porter's Five Forces
- Lithuania Noble Gases Industry Life Cycle
- Historical Data and Forecast of Lithuania Noble Gases Market Revenues & Volume By Type for the Period 2022 - 2032F
- Historical Data and Forecast of Lithuania Noble Gases Market Revenues & Volume By Helium for the Period 2022 - 2032F
- Historical Data and Forecast of Lithuania Noble Gases Market Revenues & Volume By Neon for the Period 2022 - 2032F
- Historical Data and Forecast of Lithuania Noble Gases Market Revenues & Volume By Argon for the Period 2022 - 2032F
- Historical Data and Forecast of Lithuania Noble Gases Market Revenues & Volume By Krypton for the Period 2022 - 2032F
- Historical Data and Forecast of Lithuania Noble Gases Market Revenues & Volume By Application for the Period 2022 - 2032F
- Historical Data and Forecast of Lithuania Noble Gases Market Revenues & Volume By Cryogenics for the Period 2022 - 2032F
- Historical Data and Forecast of Lithuania Noble Gases Market Revenues & Volume By Lighting for the Period 2022 - 2032F
- Historical Data and Forecast of Lithuania Noble Gases Market Revenues & Volume By Welding for the Period 2022 - 2032F
- Historical Data and Forecast of Lithuania Noble Gases Market Revenues & Volume By Insulation for the Period 2022 - 2032F
- Historical Data and Forecast of Lithuania Noble Gases Market Revenues & Volume By End User for the Period 2022 - 2032F
- Historical Data and Forecast of Lithuania Noble Gases Market Revenues & Volume By Healthcare for the Period 2022 - 2032F
- Historical Data and Forecast of Lithuania Noble Gases Market Revenues & Volume By Electronics for the Period 2022 - 2032F
- Historical Data and Forecast of Lithuania Noble Gases Market Revenues & Volume By Metal Industry for the Period 2022 - 2032F
- Historical Data and Forecast of Lithuania Noble Gases Market Revenues & Volume By Construction for the Period 2022 - 2032F
- Lithuania Noble Gases Import Export Trade Statistics
- Market Opportunity Assessment By Type
- Market Opportunity Assessment By Application
- Market Opportunity Assessment By End User
- Lithuania Noble Gases Top Companies Market Share
- Lithuania Noble Gases Competitive Benchmarking By Technical and Operational Parameters
- Lithuania Noble Gases Company Profiles
- Lithuania Noble Gases Key Strategic Recommendations
Frequently Asked Questions About the Market Study (FAQs):
6Wresearch actively monitors the Lithuania Noble Gases Market and publishes its comprehensive annual report, highlighting emerging trends, growth drivers, revenue analysis, and forecast outlook. Our insights help businesses to make data-backed strategic decisions with ongoing market dynamics. Our analysts track relevent industries related to the Lithuania Noble Gases Market, allowing our clients with actionable intelligence and reliable forecasts tailored to emerging regional needs.
Yes, we provide customisation as per your requirements. To learn more, feel free to contact us on sales@6wresearch.com
1 Executive Summary |
2 Introduction |
2.1 Key Highlights of the Report |
2.2 Report Description |
2.3 Market Scope & Segmentation |
2.4 Research Methodology |
2.5 Assumptions |
3 Lithuania Noble Gases Market Overview |
3.1 Lithuania Country Macro Economic Indicators |
3.2 Lithuania Noble Gases Market Revenues & Volume, 2022 & 2032F |
3.3 Lithuania Noble Gases Market - Industry Life Cycle |
3.4 Lithuania Noble Gases Market - Porter's Five Forces |
3.5 Lithuania Noble Gases Market Revenues & Volume Share, By Type, 2022 & 2032F |
3.6 Lithuania Noble Gases Market Revenues & Volume Share, By Application, 2022 & 2032F |
3.7 Lithuania Noble Gases Market Revenues & Volume Share, By End User, 2022 & 2032F |
4 Lithuania Noble Gases Market Dynamics |
4.1 Impact Analysis |
4.2 Market Drivers |
4.2.1 Growing demand for noble gases in the semiconductor industry for various applications such as lithography and etching. |
4.2.2 Increasing use of noble gases in medical imaging technologies like MRI and CT scans. |
4.2.3 Rising adoption of noble gases in lighting applications for energy-efficient lighting solutions. |
4.3 Market Restraints |
4.3.1 High cost associated with the production and purification of noble gases. |
4.3.2 Limited availability of noble gases due to their extraction from air separation units. |
4.3.3 Stringent regulations and environmental concerns related to the handling and disposal of noble gases. |
5 Lithuania Noble Gases Market Trends |
6 Lithuania Noble Gases Market, By Types |
6.1 Lithuania Noble Gases Market, By Type |
6.1.1 Overview and Analysis |
6.1.2 Lithuania Noble Gases Market Revenues & Volume, By Type, 2022 - 2032F |
6.1.3 Lithuania Noble Gases Market Revenues & Volume, By Helium, 2022 - 2032F |
6.1.4 Lithuania Noble Gases Market Revenues & Volume, By Neon, 2022 - 2032F |
6.1.5 Lithuania Noble Gases Market Revenues & Volume, By Argon, 2022 - 2032F |
6.1.6 Lithuania Noble Gases Market Revenues & Volume, By Krypton, 2022 - 2032F |
6.2 Lithuania Noble Gases Market, By Application |
6.2.1 Overview and Analysis |
6.2.2 Lithuania Noble Gases Market Revenues & Volume, By Cryogenics, 2022 - 2032F |
6.2.3 Lithuania Noble Gases Market Revenues & Volume, By Lighting, 2022 - 2032F |
6.2.4 Lithuania Noble Gases Market Revenues & Volume, By Welding, 2022 - 2032F |
6.2.5 Lithuania Noble Gases Market Revenues & Volume, By Insulation, 2022 - 2032F |
6.3 Lithuania Noble Gases Market, By End User |
6.3.1 Overview and Analysis |
6.3.2 Lithuania Noble Gases Market Revenues & Volume, By Healthcare, 2022 - 2032F |
6.3.3 Lithuania Noble Gases Market Revenues & Volume, By Electronics, 2022 - 2032F |
6.3.4 Lithuania Noble Gases Market Revenues & Volume, By Metal Industry, 2022 - 2032F |
6.3.5 Lithuania Noble Gases Market Revenues & Volume, By Construction, 2022 - 2032F |
7 Lithuania Noble Gases Market Import-Export Trade Statistics |
7.1 Lithuania Noble Gases Market Export to Major Countries |
7.2 Lithuania Noble Gases Market Imports from Major Countries |
8 Lithuania Noble Gases Market Key Performance Indicators |
8.1 Average selling price of noble gases in Lithuania. |
8.2 Number of new applications or industries using noble gases in Lithuania. |
8.3 Investments in research and development for innovative uses of noble gases within the Lithuanian market. |
9 Lithuania Noble Gases Market - Opportunity Assessment |
9.1 Lithuania Noble Gases Market Opportunity Assessment, By Type, 2022 & 2032F |
9.2 Lithuania Noble Gases Market Opportunity Assessment, By Application, 2022 & 2032F |
9.3 Lithuania Noble Gases Market Opportunity Assessment, By End User, 2022 & 2032F |
10 Lithuania Noble Gases Market - Competitive Landscape |
10.1 Lithuania Noble Gases Market Revenue Share, By Companies, 2025 |
10.2 Lithuania Noble Gases Market Competitive Benchmarking, By Operating and Technical Parameters |
11 Company Profiles |
12 Recommendations |
13 Disclaimer |
Export potential assessment - trade Analytics for 2030
Export potential enables firms to identify high-growth global markets with greater confidence by combining advanced trade intelligence with a structured quantitative methodology. The framework analyzes emerging demand trends and country-level import patterns while integrating macroeconomic and trade datasets such as GDP and population forecasts, bilateral import–export flows, tariff structures, elasticity differentials between developed and developing economies, geographic distance, and import demand projections. Using weighted trade values from 2020–2024 as the base period to project country-to-country export potential for 2030, these inputs are operationalized through calculated drivers such as gravity model parameters, tariff impact factors, and projected GDP per-capita growth. Through an analysis of hidden potentials, demand hotspots, and market conditions that are most favorable to success, this method enables firms to focus on target countries, maximize returns, and global expansion with data, backed by accuracy.
By factoring in the projected importer demand gap that is currently unmet and could be potential opportunity, it identifies the potential for the Exporter (Country) among 190 countries, against the general trade analysis, which identifies the biggest importer or exporter.
To discover high-growth global markets and optimize your business strategy:
Click Here
Pricing
- Single User License$ 1,995
- Department License$ 2,400
- Site License$ 3,120
- Global License$ 3,795

Search
Thought Leadership and Analyst Meet


Our Clients
Latest Reports
- Canada Cloud CFD Market (2026-2032) | Size & Revenue, Industry, Growth, Competitive Landscape, Forecast, Segmentation, Value, Outlook, Trends, Share, Analysis, Companies
- Taiwan Food Delivery Platform Market (2026-2032) | Companies, Outlook, Analysis, Trends, Value, Revenue, Segmentation, Share, Forecast, Competitive Landscape, Growth, Size & Forecast
- United Kingdom (UK) Long-term Care Insurance Market (2026-2032) | Growth, Share, Consumer Insights, Drivers, Opportunities, Competition, Pricing Analysis, Segments, Restraints, Companies, Competitive, Value, Outlook, Size, Demand, Analysis, Challenges, Strategic Insights, Investment Trends, Revenue, Trends, Supply, Forecast
- United Kingdom (UK) Long Term Care Market (2026-2032) | Companies, Outlook, Analysis, Trends, Value, Revenue, Segmentation, Share, Forecast, Competitive Landscape, Growth, Size & Forecast
- Iraq Insulation and Waterproofing Market (2026-2032) | Outlook, Drivers, Growth, Size, Share, Industry, Revenue, Trends, Demand, Competitive, Strategic Insights, Opportunities, Segments, Companies, Challenges, Strategy, Consumer Insights, Analysis, Investment Trends, Value, Segmentation, Forecast, Restraints
- India Switchgear Market Outlook (2026-2032) | Size, Share, Trends, Growth, Revenue, Forecast, Analysis, Value, Outlook
- Pakistan Contraceptive Implants Market (2025-2031) | Demand, Growth, Size, Share, Industry, Pricing Analysis, Competitive, Strategic Insights, Strategy, Consumer Insights, Analysis, Investment Trends, Opportunities, Revenue, Segments, Value, Segmentation, Supply, Forecast, Restraints, Outlook, Competition, Drivers, Trends, Companies, Challenges
- Sri Lanka Packaging Market (2026-2032) | Outlook, Competition, Drivers, Trends, Demand, Pricing Analysis, Competitive, Strategic Insights, Companies, Challenges, Strategy, Consumer Insights, Analysis, Investment Trends, Opportunities, Growth, Size, Share, Industry, Revenue, Segments, Value, Segmentation, Supply, Forecast, Restraints
- India Kids Watches Market (2026-2032) | Strategy, Consumer Insights, Analysis, Investment Trends, Opportunities, Growth, Size, Share, Industry, Revenue, Segments, Value, Segmentation, Supply, Forecast, Restraints, Outlook, Competition, Drivers, Trends, Demand, Pricing Analysis, Competitive, Strategic Insights, Companies, Challenges
- Saudi Arabia Core Assurance Service Market (2025-2031) | Strategy, Consumer Insights, Analysis, Investment Trends, Opportunities, Growth, Size, Share, Industry, Revenue, Segments, Value, Segmentation, Supply, Forecast, Restraints, Outlook, Competition, Drivers, Trends, Demand, Pricing Analysis, Competitive, Strategic Insights, Companies, Challenges
Industry Events and Analyst Meet

India EV Show 2026

EV tech India Expo 2026

Auto Tech Asia 2026

Battery Tech India 2026

Smart Production Solutions Guangzhou 2026
Whitepaper
- Middle East & Africa Commercial Security Market Click here to view more.
- Middle East & Africa Fire Safety Systems & Equipment Market Click here to view more.
- GCC Drone Market Click here to view more.
- Middle East Lighting Fixture Market Click here to view more.
- GCC Physical & Perimeter Security Market Click here to view more.
6WResearch In News
- Doha a strategic location for EV manufacturing hub: IPA Qatar
- Demand for luxury TVs surging in the GCC, says Samsung
- Empowering Growth: The Thriving Journey of Bangladesh’s Cable Industry
- Demand for luxury TVs surging in the GCC, says Samsung
- Video call with a traditional healer? Once unthinkable, it’s now common in South Africa
- Intelligent Buildings To Smooth GCC’s Path To Net Zero