Lithuania Organic Dyes Market (2026-2032) | Outlook, Growth, Industry, Companies, Value, Forecast, Share, Trends, Revenue, Analysis, Size & Segmentation
Market Forecast By Product Type (Acid, Basic, Reactive, Direct, Disperse, Sulphur, Others), By Application (Paints and Coatings, Textile, Plastics, Printing Inks, Others) And Competitive Landscape
| Product Code: ETC5295853 | Publication Date: Nov 2023 | Updated Date: Apr 2026 | Product Type: Market Research Report | |
| Publisher: 6Wresearch | Author: Ravi Bhandari | No. of Pages: 60 | No. of Figures: 30 | No. of Tables: 5 |
Lithuania Organic Dyes Market Size (2020-2030)
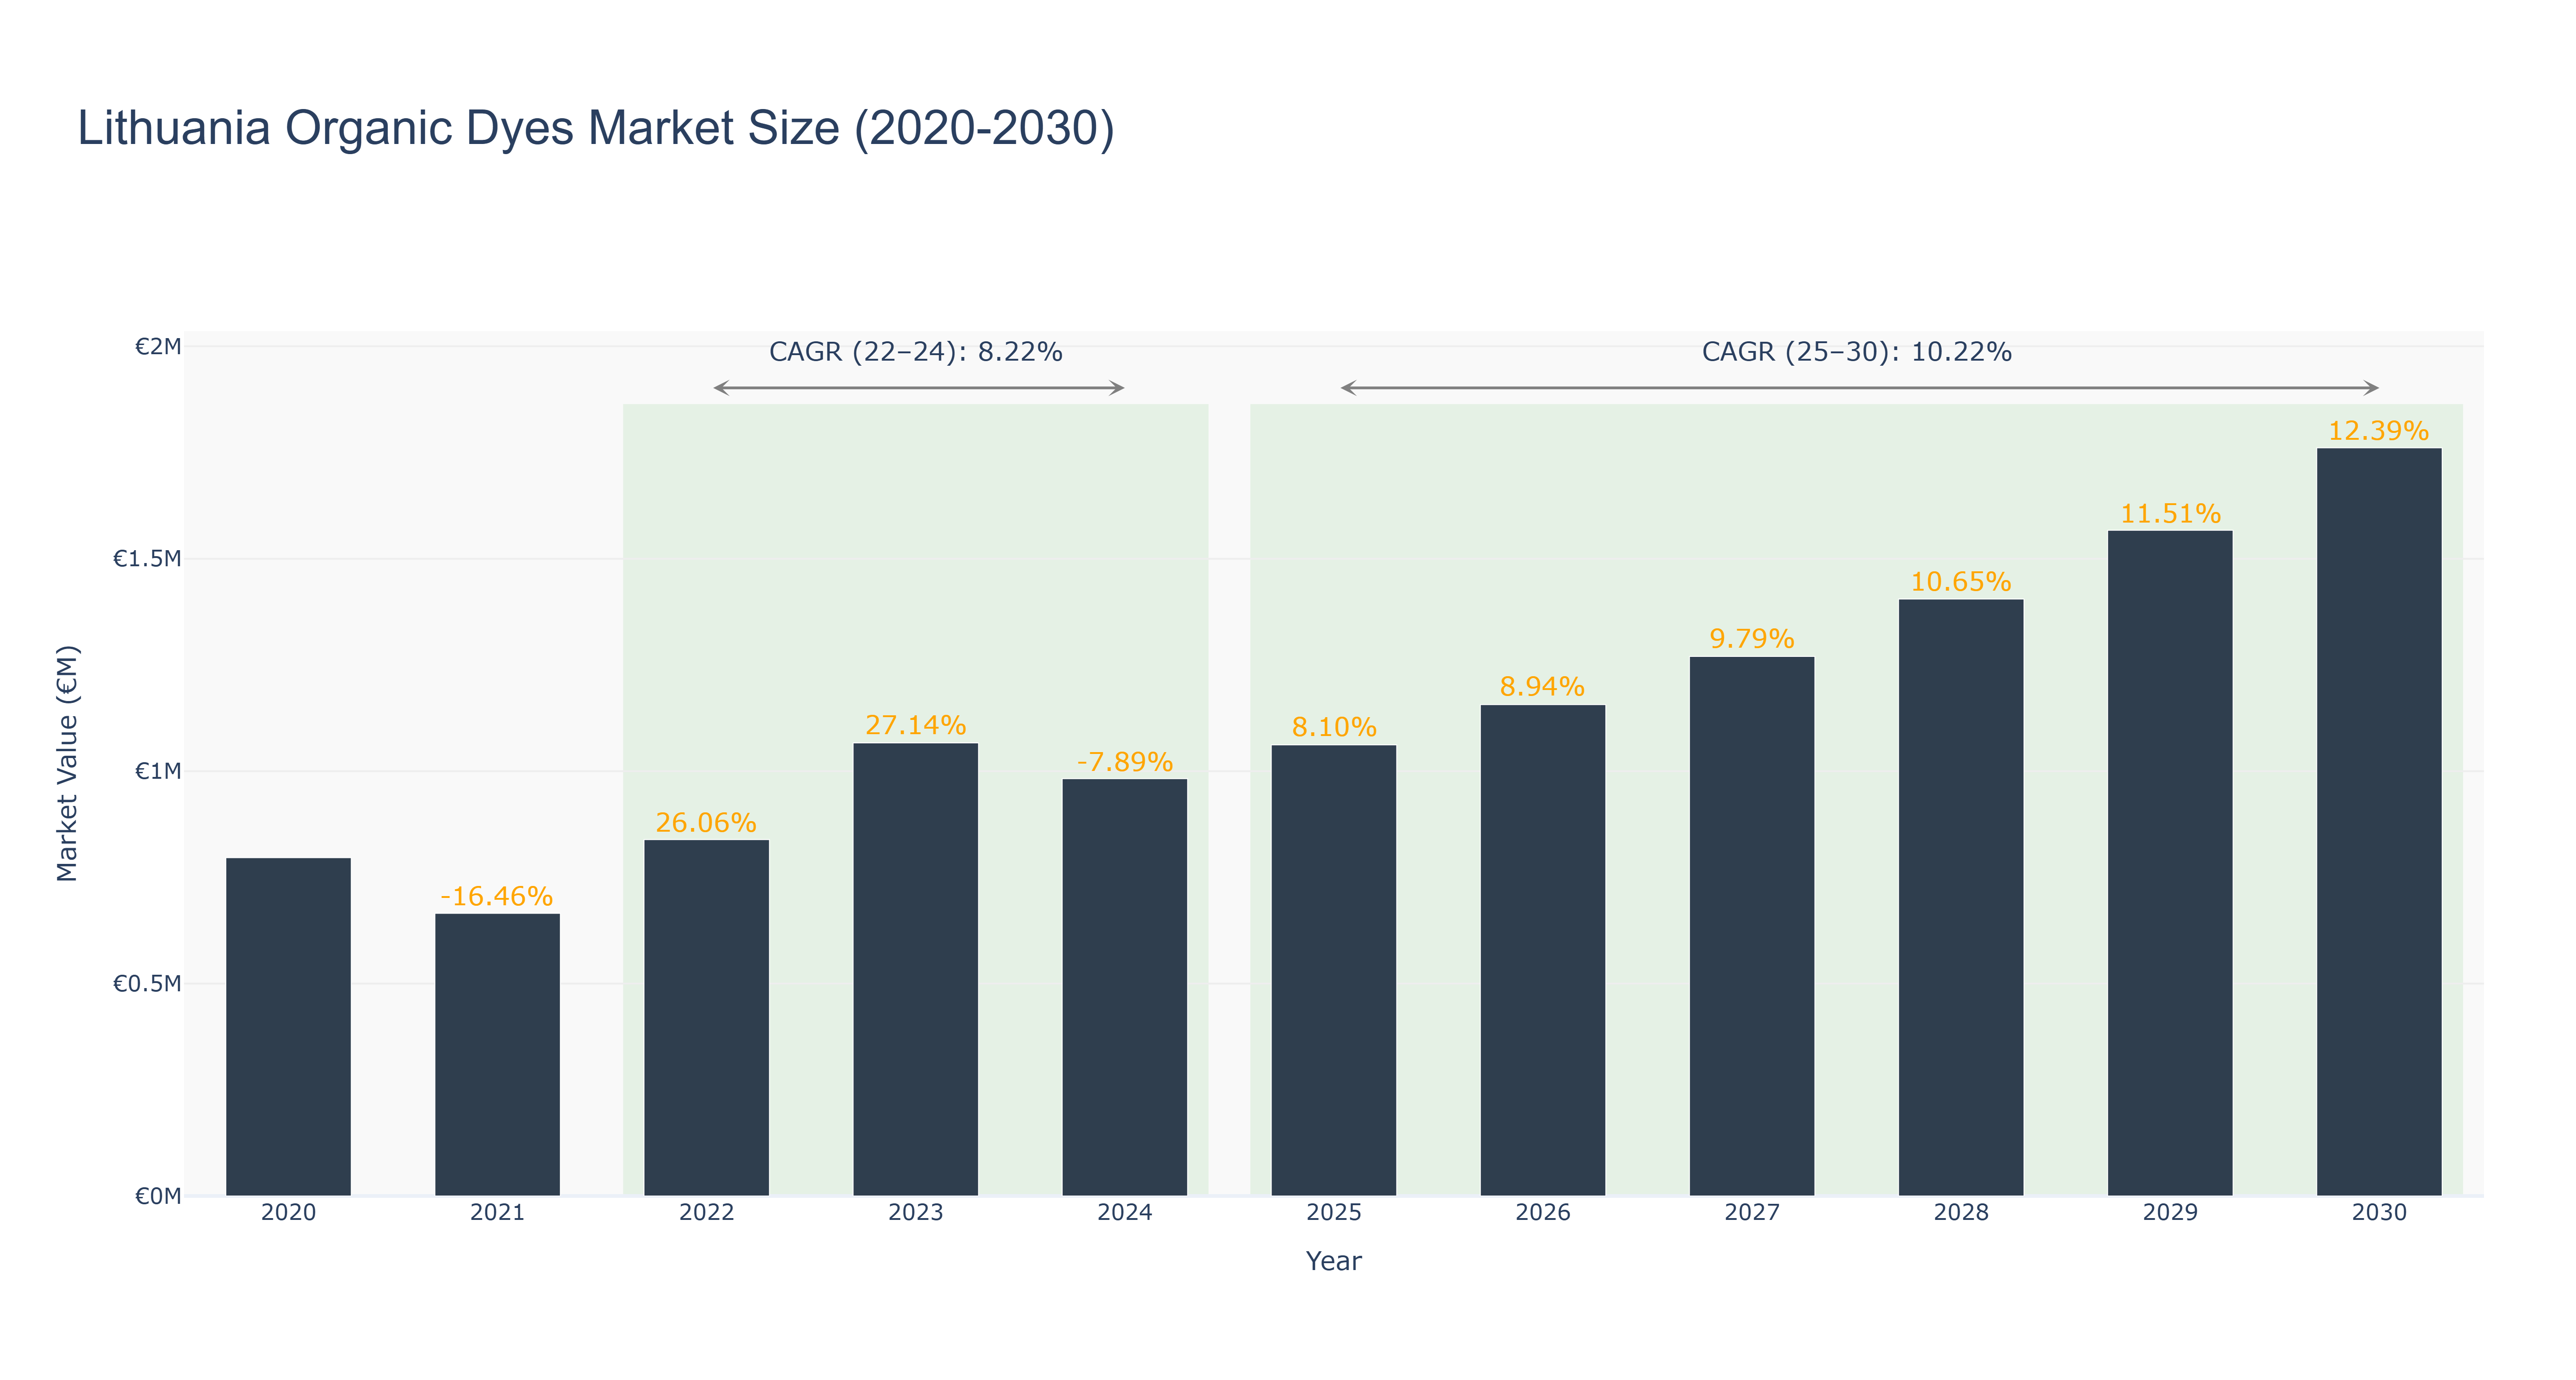
The Lithuania Organic Dyes Market has shown a fluctuating trend over the past decade. The peak market size of €1.76 million is forecasted for 2030, with continuous growth since 2020. Actual market sizes ranged from €0.67 million in 2021 to €1.16 million in 2026. The market experienced a decline in 2024, attributed to a negative growth rate of -7.89%, potentially due to economic downturns or regulatory changes. Conversely, the market saw significant growth in 2023 and beyond, likely driven by increasing demand for organic products and sustainability initiatives. Looking ahead, the market is poised for further expansion, with a CAGR of 10.22% from 2025 to 2030. Recent developments in Lithuania's textile industry, focusing on eco-friendly practices, are expected to drive the demand for organic dyes in the near future.
Lithuania Organic Dyes Market: Production & Trade Performance (2019-2025)
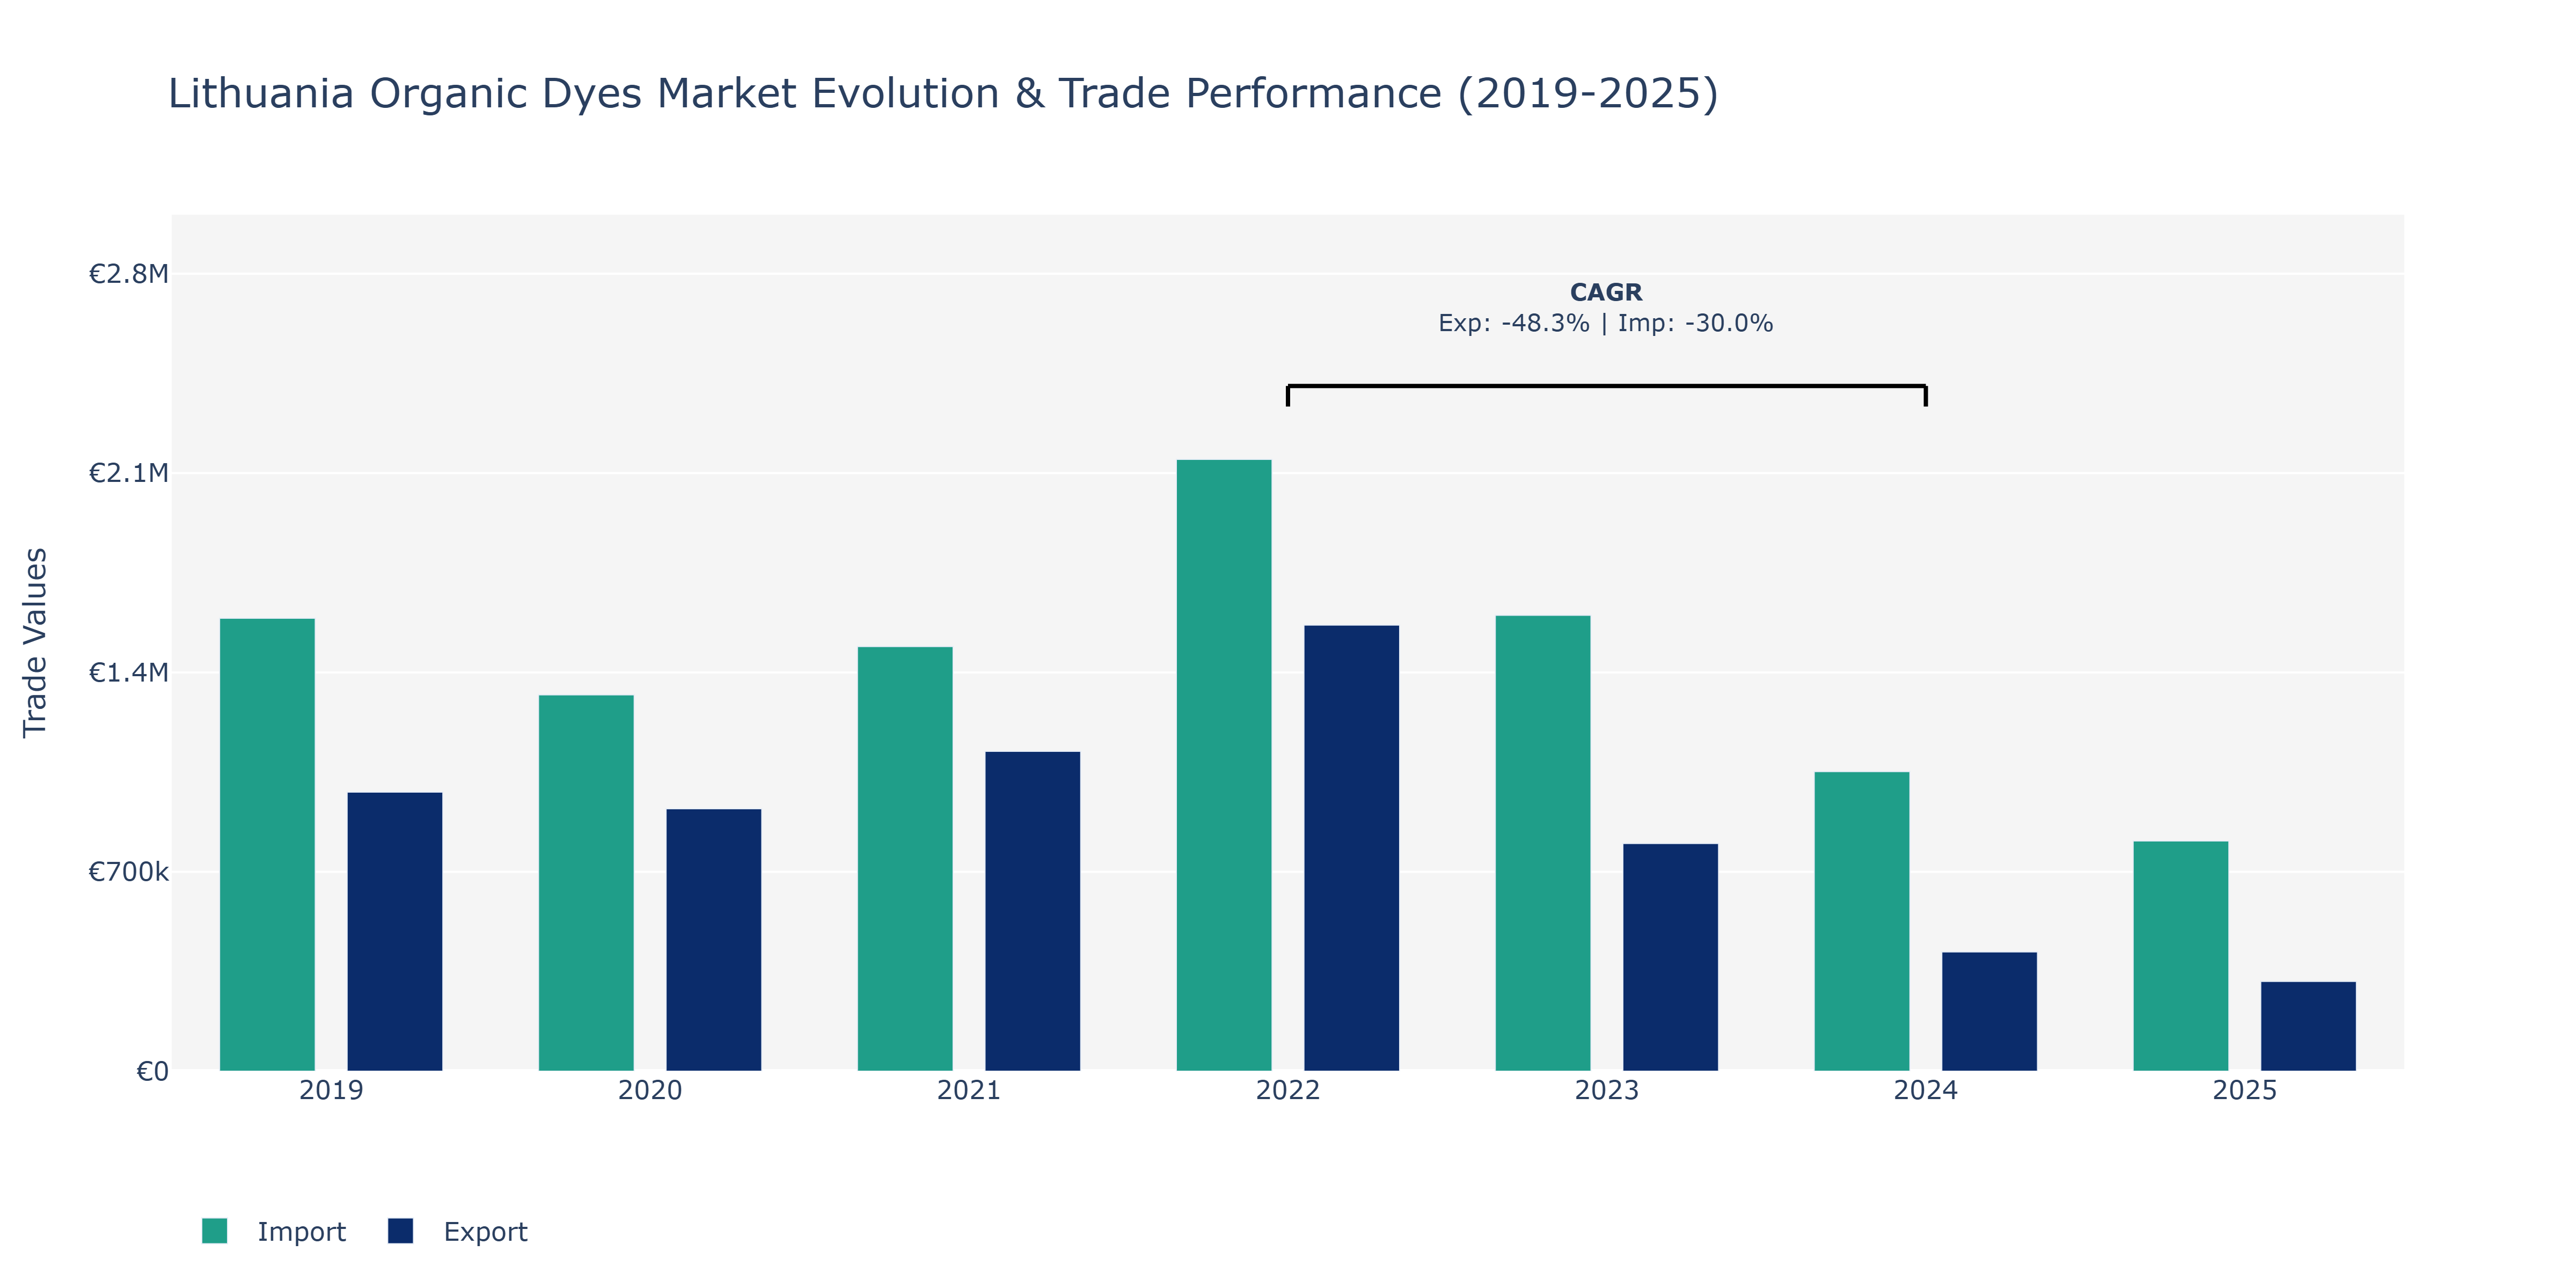
From 2019 to 2025, Lithuania's Organic Dyes Market exhibited varied trends in exports and imports. In 2022, both exports and imports peaked at €1.57 million and €2.15 million, respectively, showcasing a substantial increase compared to previous years. However, by 2025, exports decreased to around €315 thousand, while imports dropped to approximately €808.4 thousand. This decline could be attributed to factors such as fluctuating global demand, raw material price volatility, and evolving trade agreements impacting the organic dyes sector. The CAGR for exports from 2022 to 2024 was -48.28%, indicating a significant downturn, while imports experienced a -30.03% CAGR during the same period. External factors like changing consumer preferences towards sustainable products and regulatory shifts promoting eco-friendly dyes might have influenced these fluctuations in Lithuania's Organic Dyes Market. To sustain growth, market players could focus on innovation, quality assurance, and strategic partnerships to navigate through these challenging dynamics in the organic dyes industry.
Key Highlights of the Report:
- Lithuania Organic Dyes Market Outlook
- Market Size of Lithuania Organic Dyes Market, 2025
- Forecast of Lithuania Organic Dyes Market, 2032
- Historical Data and Forecast of Lithuania Organic Dyes Revenues & Volume for the Period 2022 - 2032F
- Lithuania Organic Dyes Market Trend Evolution
- Lithuania Organic Dyes Market Drivers and Challenges
- Lithuania Organic Dyes Price Trends
- Lithuania Organic Dyes Porter`s Five Forces
- Lithuania Organic Dyes Industry Life Cycle
- Historical Data and Forecast of Lithuania Organic Dyes Market Revenues & Volume By Product Type for the Period 2022 - 2032F
- Historical Data and Forecast of Lithuania Organic Dyes Market Revenues & Volume By Acid for the Period 2022 - 2032F
- Historical Data and Forecast of Lithuania Organic Dyes Market Revenues & Volume By Basic for the Period 2022 - 2032F
- Historical Data and Forecast of Lithuania Organic Dyes Market Revenues & Volume By Reactive for the Period 2022 - 2032F
- Historical Data and Forecast of Lithuania Organic Dyes Market Revenues & Volume By Direct for the Period 2022 - 2032F
- Historical Data and Forecast of Lithuania Organic Dyes Market Revenues & Volume By Disperse for the Period 2022 - 2032F
- Historical Data and Forecast of Lithuania Organic Dyes Market Revenues & Volume By Sulphur for the Period 2022 - 2032F
- Historical Data and Forecast of Lithuania Organic Dyes Market Revenues & Volume By Others for the Period 2022 - 2032F
- Historical Data and Forecast of Lithuania Organic Dyes Market Revenues & Volume By Application for the Period 2022 - 2032F
- Historical Data and Forecast of Lithuania Organic Dyes Market Revenues & Volume By Paints and Coatings for the Period 2022 - 2032F
- Historical Data and Forecast of Lithuania Organic Dyes Market Revenues & Volume By Textile for the Period 2022 - 2032F
- Historical Data and Forecast of Lithuania Organic Dyes Market Revenues & Volume By Plastics for the Period 2022 - 2032F
- Historical Data and Forecast of Lithuania Organic Dyes Market Revenues & Volume By Printing Inks for the Period 2022 - 2032F
- Historical Data and Forecast of Lithuania Organic Dyes Market Revenues & Volume By Others for the Period 2022 - 2032F
- Lithuania Organic Dyes Import Export Trade Statistics
- Market Opportunity Assessment By Product Type
- Market Opportunity Assessment By Application
- Lithuania Organic Dyes Top Companies Market Share
- Lithuania Organic Dyes Competitive Benchmarking By Technical and Operational Parameters
- Lithuania Organic Dyes Company Profiles
- Lithuania Organic Dyes Key Strategic Recommendations
Frequently Asked Questions About the Market Study (FAQs):
6Wresearch actively monitors the Lithuania Organic Dyes Market and publishes its comprehensive annual report, highlighting emerging trends, growth drivers, revenue analysis, and forecast outlook. Our insights help businesses to make data-backed strategic decisions with ongoing market dynamics. Our analysts track relevent industries related to the Lithuania Organic Dyes Market, allowing our clients with actionable intelligence and reliable forecasts tailored to emerging regional needs.
Yes, we provide customisation as per your requirements. To learn more, feel free to contact us on sales@6wresearch.com
1 Executive Summary |
2 Introduction |
2.1 Key Highlights of the Report |
2.2 Report Description |
2.3 Market Scope & Segmentation |
2.4 Research Methodology |
2.5 Assumptions |
3 Lithuania Organic Dyes Market Overview |
3.1 Lithuania Country Macro Economic Indicators |
3.2 Lithuania Organic Dyes Market Revenues & Volume, 2022 & 2032F |
3.3 Lithuania Organic Dyes Market - Industry Life Cycle |
3.4 Lithuania Organic Dyes Market - Porter's Five Forces |
3.5 Lithuania Organic Dyes Market Revenues & Volume Share, By Product Type, 2022 & 2032F |
3.6 Lithuania Organic Dyes Market Revenues & Volume Share, By Application, 2022 & 2032F |
4 Lithuania Organic Dyes Market Dynamics |
4.1 Impact Analysis |
4.2 Market Drivers |
4.2.1 Increasing consumer awareness and demand for eco-friendly and sustainable products |
4.2.2 Growing adoption of organic dyes in various industries such as textiles, food, and cosmetics |
4.2.3 Favorable government regulations promoting the use of organic dyes in Lithuania |
4.3 Market Restraints |
4.3.1 Higher production costs associated with organic dyes compared to conventional synthetic dyes |
4.3.2 Limited availability of raw materials for organic dye production |
4.3.3 Lack of standardized quality control measures in the organic dye industry |
5 Lithuania Organic Dyes Market Trends |
6 Lithuania Organic Dyes Market Segmentations |
6.1 Lithuania Organic Dyes Market, By Product Type |
6.1.1 Overview and Analysis |
6.1.2 Lithuania Organic Dyes Market Revenues & Volume, By Acid, 2022 - 2032F |
6.1.3 Lithuania Organic Dyes Market Revenues & Volume, By Basic, 2022 - 2032F |
6.1.4 Lithuania Organic Dyes Market Revenues & Volume, By Reactive, 2022 - 2032F |
6.1.5 Lithuania Organic Dyes Market Revenues & Volume, By Direct, 2022 - 2032F |
6.1.6 Lithuania Organic Dyes Market Revenues & Volume, By Disperse, 2022 - 2032F |
6.1.7 Lithuania Organic Dyes Market Revenues & Volume, By Sulphur, 2022 - 2032F |
6.2 Lithuania Organic Dyes Market, By Application |
6.2.1 Overview and Analysis |
6.2.2 Lithuania Organic Dyes Market Revenues & Volume, By Paints and Coatings, 2022 - 2032F |
6.2.3 Lithuania Organic Dyes Market Revenues & Volume, By Textile, 2022 - 2032F |
6.2.4 Lithuania Organic Dyes Market Revenues & Volume, By Plastics, 2022 - 2032F |
6.2.5 Lithuania Organic Dyes Market Revenues & Volume, By Printing Inks, 2022 - 2032F |
6.2.6 Lithuania Organic Dyes Market Revenues & Volume, By Others, 2022 - 2032F |
7 Lithuania Organic Dyes Market Import-Export Trade Statistics |
7.1 Lithuania Organic Dyes Market Export to Major Countries |
7.2 Lithuania Organic Dyes Market Imports from Major Countries |
8 Lithuania Organic Dyes Market Key Performance Indicators |
8.1 Percentage increase in the number of companies adopting organic dyes in their production processes |
8.2 Growth in the number of new organic dye products introduced to the market |
8.3 Improvement in the efficiency of organic dye production processes |
8.4 Increase in research and development investment in organic dye technologies |
8.5 Expansion of distribution channels for organic dyes |
9 Lithuania Organic Dyes Market - Opportunity Assessment |
9.1 Lithuania Organic Dyes Market Opportunity Assessment, By Product Type, 2022 & 2032F |
9.2 Lithuania Organic Dyes Market Opportunity Assessment, By Application, 2022 & 2032F |
10 Lithuania Organic Dyes Market - Competitive Landscape |
10.1 Lithuania Organic Dyes Market Revenue Share, By Companies, 2025 |
10.2 Lithuania Organic Dyes Market Competitive Benchmarking, By Operating and Technical Parameters |
11 Company Profiles |
12 Recommendations | 13 Disclaimer |
Export potential assessment - trade Analytics for 2030
Export potential enables firms to identify high-growth global markets with greater confidence by combining advanced trade intelligence with a structured quantitative methodology. The framework analyzes emerging demand trends and country-level import patterns while integrating macroeconomic and trade datasets such as GDP and population forecasts, bilateral import–export flows, tariff structures, elasticity differentials between developed and developing economies, geographic distance, and import demand projections. Using weighted trade values from 2020–2024 as the base period to project country-to-country export potential for 2030, these inputs are operationalized through calculated drivers such as gravity model parameters, tariff impact factors, and projected GDP per-capita growth. Through an analysis of hidden potentials, demand hotspots, and market conditions that are most favorable to success, this method enables firms to focus on target countries, maximize returns, and global expansion with data, backed by accuracy.
By factoring in the projected importer demand gap that is currently unmet and could be potential opportunity, it identifies the potential for the Exporter (Country) among 190 countries, against the general trade analysis, which identifies the biggest importer or exporter.
To discover high-growth global markets and optimize your business strategy:
Click Here
Pricing
- Single User License$ 1,995
- Department License$ 2,400
- Site License$ 3,120
- Global License$ 3,795

Search
Thought Leadership and Analyst Meet


Our Clients
Latest Reports
- India Ultrasonic Smart Water Meter Market (2026-2032) | Outlook, Competition, Drivers, Trends, Demand, Competitive, Strategic Insights, Companies, Challenges, Strategy, Consumer Insights, Analysis, Opportunities, Growth, Size, Share, Industry, Revenue, Segments, Value, Segmentation, Supply, Forecast, Restraints,
- India Electromagnetic Bulk Flow Meter Market (2026-2032) | Analysis, Challenges, Strategic Insights, Supply, Forecast, Growth, Share, Consumer Insights, Competitive, Value, Outlook, Size & Demand,
- India Battery Powered Bulk Flow Meter Market (2026-2032) | Outlook, Analysis, Competitive Landscape, Growth, Size, Trends, Value, Revenue, Companies, Segmentation, Share & Forecast
- Bosnia and Herzegovina Fuel-Efficient Winglets Market (2026-2032) | Growth, Competition, Strategy, Restraints, Trends, Challenges, segmentation, Value, Outlook, Investment Opportunities, Analysis, Revenue, Companies, Insights, Pricing, Size, Drivers, Demand, Share, Forecast
- Canada Cloud CFD Market (2026-2032) | Size & Revenue, Industry, Growth, Competitive Landscape, Forecast, Segmentation, Value, Outlook, Trends, Share, Analysis, Companies
- Taiwan Food Delivery Platform Market (2026-2032) | Companies, Outlook, Analysis, Trends, Value, Revenue, Segmentation, Share, Forecast, Competitive Landscape, Growth, Size & Forecast
- United Kingdom (UK) Long-term Care Insurance Market (2026-2032) | Growth, Share, Consumer Insights, Drivers, Opportunities, Competition, Pricing Analysis, Segments, Restraints, Companies, Competitive, Value, Outlook, Size, Demand, Analysis, Challenges, Strategic Insights, Investment Trends, Revenue, Trends, Supply, Forecast
- United Kingdom (UK) Long Term Care Market (2026-2032) | Companies, Outlook, Analysis, Trends, Value, Revenue, Segmentation, Share, Forecast, Competitive Landscape, Growth, Size & Forecast
- Iraq Insulation and Waterproofing Market (2026-2032) | Outlook, Drivers, Growth, Size, Share, Industry, Revenue, Trends, Demand, Competitive, Strategic Insights, Opportunities, Segments, Companies, Challenges, Strategy, Consumer Insights, Analysis, Investment Trends, Value, Segmentation, Forecast, Restraints
- India Switchgear Market Outlook (2026-2032) | Size, Share, Trends, Growth, Revenue, Forecast, Analysis, Value, Outlook
Industry Events and Analyst Meet

HIMTEX 2026

India Refining Summit 2026

India EV Show 2026

EV tech India Expo 2026

Auto Tech Asia 2026
Whitepaper
- Middle East & Africa Commercial Security Market Click here to view more.
- Middle East & Africa Fire Safety Systems & Equipment Market Click here to view more.
- GCC Drone Market Click here to view more.
- Middle East Lighting Fixture Market Click here to view more.
- GCC Physical & Perimeter Security Market Click here to view more.
6WResearch In News
- Doha a strategic location for EV manufacturing hub: IPA Qatar
- Demand for luxury TVs surging in the GCC, says Samsung
- Empowering Growth: The Thriving Journey of Bangladesh’s Cable Industry
- Demand for luxury TVs surging in the GCC, says Samsung
- Video call with a traditional healer? Once unthinkable, it’s now common in South Africa
- Intelligent Buildings To Smooth GCC’s Path To Net Zero